prices, production and exports
Antônio Salazar P. Brandão Elcyon Caiado Rocha Lima
Abstract: This paper specifies and estimates an econometric model of the soybean market (grain, oil and meal) to assess the effects of U.S. domestic support to soybeans on world soybean prices, production and exports.
The model divides the world into five regions (modules): Argentina, Brazil, the European Union, the United States (US) and the Rest of the
This paper has been prepared at the request of the Confederação Nacional da Agricultura e Pecuária do Brasil (CNA) as a partial fulillment of agreement nº 2.00.830/200-2 signed by the CNA and the Ministério da Agricultura, Pecuária e Abastecimento to assess the effects of U.S. domestic support to soybeans on the Brazilian soybean sector. The authors want to express their gratitude to several peo-ple and institutions: the participants of the various meetings and seminars headed by Pedro de Camargo Netto who was then Secretary of Production and Marketing, Ministério da Agricultura e do Abastecimento; to ABIOVE staff who shared informa-tion and knowledge of U.S. policy with us; to Guilherme Leite da Silva Dias, Sávio Pereira, Getúlio Pernambuco and Fábio Trigueirinho who have had extensive discus-sions with us and contributed signiicantly to the conception of the model and to our understanding of U.S. agricultural policy; to the OECD Agricultural Directorate who shared their knowledge of agricultural policies in the OECD countries and their modeling experience with us. We have also beneited enormously from data and other information contained in AgLink (which was accessible to us through the agreement of Ministério da Agricultura and the OECD). None of those mentioned above are re-sponsible for the errors and omissions that may still remain.
World (ROW). There are interactions between the modules through the international prices and the net exports of each soybean product. The international prices of grain, oil and meal are endogenous and are determined equating net exports of the first four modules (Argentina, Brazil, European Union and the U.S.) to net imports of the ROW. The analysis is conducted eliminating the U.S. domestic support to soybeans and simulating the impacts on the variables of interest. The simulations show a significant impact of the US subsidy to soybeans on world prices and net exports of the four selected regions.
Key words: soubeans subsidy, soybean market, international trade.
JEL Classification: F7, Q7
Resumo: Este trabalho estima um modelo econométrico do mercado de soja e derivados com o objetivo de avaliar os efeitos das políticas de apoio interno dos Estados Unidos sobre os preços internacionais, sobre a produção e sobre as exportações.
O modelo divide o mundo em cinco regiões: Argentina, Brasil, Estados Unidos, União Européia e Demais países. A interação entre as regiões ocorre através dos preços internacionais e pelas exportações líquidas em cada um dos mercados. Os preços internacionais dos três produtos são determinados igualando-se a soma das exportações líquidas das cinco regiões.
A análise é feita eliminando o apoio doméstico nos Estados Unidos e simulando o impacto nas variáveis de interesse. As simulações mostram impactos significativos do subsídio americano sobre os preços interna-cionais e sobre as exportações líquidas de Argentina, Brasil, Estados Unidos e União Européia.
Palavras-chave: subsídio à soja, mercado da soja, comércio internacional.
. Introduction
The Farm Bill of 996, the Federal Agriculture Improvement and Re-form (Fair) Act, introduced significant changes in U.S. agricultural policy. This partial reform of agricultural policy was an attempt to reduce bud-get expenditures and to meet agreements signed in the Uruguay Round. Traditional types of assistance, mostly based on current production and market conditions, were discontinued in favor of decoupled payments (called production flexibility contracts, PFC) not associated with current production or area. All acreage restrictions were eliminated.
With the fall in prices after 997, U.S. government expenditures with
Amber Box support (not excluding de minimis exemptions) went from
US$ 7 billions in 997, to US$ 4 billion in 998, to US$ 23 billion in 999 and fell slightly to US$ 2 billion in 2000 (Hart and Babcock, Table 2, p. 0). Support for soybeans under this category increased from almost zero in 997 to US$ .3 billion in 998, to US$ 2.8 billion in 999 and 2000.
Payments based on historical programs (the same as the PFCs), whi-ch have replaced the old Loan Deficiency Payments, have been another major component of U.S. support to agriculture. Expenditures under this heading went from US$ 5.2 billion in 996, to US$ 6.3 billion in 997, to US$ 8.4 billion in 998, to US$ 0.9 billion in 999 and have fallen slightly to US$ 0.5 billion in 2000 (OECD).
Soybeans have benefited from the U.S. commodity loan programs since 94, but were not subjected to the acreage restrictions imposed on feed grains, rice, wheat and upland cotton (Westcott and Price, p.5). In most of the period after 970 market prices have been above the loan rate and the main benefit of the program was to provide liquidity to farmers until production was sold. This was not the case before 970 and in the middle of the decade of the 980s (see Westcott and Price pp. 6 and 7).
The marketing loan program in the U.S. started in 986 for rice and upland crop and was extended to soybeans and other oilseeds in 99
(Westcott and Price, p.3) and to wheat and feed grains in 993. The Fair Act continued the market loan program for these crops.
The PFC payments, introduced by the Fair Act, were an attempt to move towards income support rather than price support. Producers of commodities previously eligible for deficiency payments were entitled to payments based the area planted with such crops during the 5-year period previous to 996. Soybeans were not eligible for PFC payments.
The PFC payments have been considered by U.S. policy makers and by the WTO official decoupled with no or small effect on current produc-tion and on trade. However, time has shown that what seemed true in principle was not so in practice. With the elimination of acreage controls the PFC payments provided extra operating capital that allowed farmers to expand area. This took place for products that had higher returns per hectare. The increase in the loan rate for soybeans US$ 5.26 per bushel in the 997/98 marketing year triggered a substantial expansion of soybean acreage at the expenses of other crops, mainly wheat. But the production and trade distortions became even more evident with the Farm Security and Rural Investment Act (FSRIA) of 2002 that allowed changes in base acreage and yield and, as such, introduced an expectation element in the farmer’s decision process. In other words, farmers that grow soybeans (and other products included in the policy) now will be eligible to receive the subsidies of the 2008 Farm Bill. That is, tomorrow’s subsidies induce more production, more exports and lower world prices today. This is clearly a non-decoupled form of domestic support.
After 999 the U.S. government introduced direct payments to soy-bean producers (the Oilseed Program). These payments were introduced after marketing loss assistance was granted to other crops and they are based on past areas and yields. Nevertheless, these payments have effects that are similar to the PFCs and are likely to raise current production in the U.S., raise U.S. exports and further reduce world prices of soybeans.
In this paper we assess the effects of the U.S. domestic support to soybeans and its consequences to world prices and to Brazilian produc-tion and exports. To achieve this we first built an econometric model of the world soybean market. The counter factual analysis consisted of the elimination of the U.S. domestic support to soybeans and to track the impacts on the variables of interest.
The paper is organized as follows: section 2 presents stylized facts about the production of soybeans in the U.S. and Brazil; section 3 descri-bes the U.S. Marketing Assistance Loan Program and other policies that have distorting effects on production, trade and world prices; section 4 lays down the principal characteristics of the econometric model used to estimate the impact of domestic support in the U.S. on world prices and Brazilian production and exports; section 5 contains the principal results and section 6 concludes the paper.
2. Stylized facts
U.S. acreage for products where area was tied to deficiency payments before the Fair Act decreased substantially after 996. Between 996 and 2000 area reductions were as follows: corn .9 million hectares; wheat 5.0 million hectares; sorghum .6 million hectares; and barley 506 thousand hectares. During the same period the increase in soybeans area was 4.2
million hectares5, which shows that the change in legislation had a major
impact on the area planted with this crop.
Production of soybeans increased mostly because of area, since yields
did not change during this period6. This is seen in Table that displays
area, production and yield for the period 979/200. Production increased 7 percent between 996 and 200, area increased 9 percent and yield,
declined percent over the same period7. Figure , which is based on
indices of three-year averages, shows the same data.
The corresponding data for Brazil are shown in Table 2 and Figure 2,
5 Area increases were also observed in cotton (358 thousand hectares); sunlower (04 thousand hectares) and rice (98 thousand hectares).
6 Yield is a partial index of productivity. A more appropriate indicator is the total factor productivity index, whose calculation goes beyond the scope of this analysis.
where it can be seen the strong expansion of both area and yield during the same period. But the key difference is that domestic support has not changed at all during this period in Brazil, while this was not the case in the U.S.. A significant policy change that took place recently in Brazil was the elimination of the value added tax (ICMS) on exports of agricultural and semi processed goods in 996. In other words, market forces have driven the strong performance displayed by the sector in Brazil.
Figure 3 shows the volume of U.S. soybeans exports since 990. After the loan rate was raised to US$ 5.26 per bushel in the 997/998-crop year exports have jumped, increasing percent between 997 and 999 and 2 percent between 998 and 999. U.S. exports have been expanding since 990, as figure 3 shows; however, from 998 to 200 they have shown additional vigor. This is particularly disturbing in light of the fact that the U.S. dollar has become stronger over this period, that world prices have been declining and that yields have not increased (Figure 4 shows export volumes and yield indices).
These elements show clearly that marketing assistance loan program have played a major role to explain the evolution of production and exports. In other words, while in Brazil the market has been the driving force behind the expansion of the soybean sector, in the U.S. the recent expansion is induced by government expenditures to support the sector.
3. The U.S. Marketing Loan Assistance, Fixed Payments and
Counter Cyclical Payments
The US Marketing Loan Assistance Program operates through two instruments:
• Loan Rates; and • Marketing Loans.
Loan repayment can be made in either of the forms below: • payment of the principal plus interest; or
• forfeiting ownership of the loan collateral and keeping the proceeds of the loan.
Marketing Loans. Marketing loans changed significantly the ope-ration of the program. Farmers are allowed to repay the loans at prices below the original loan rate plus interest. This is likely to occur when market prices are below the loan rates.
With marketing loans the government accumulation of stocks is reduced, since farmers retain ownership of production and sell directly on the market. In consequence the policy has removed the price support mechanism embedded in the Loan Program before.
The benefits of the program to farmers are granted through two different channels:
• Loan Program. In this case production is pledged as collateral for the loan in the same form described before. But farmers can repay the loan, at anytime during the loan period, at market prices. For soybeans the repayment prices are posted county prices that are calculated daily. The difference between the Loan Rate and the county prices represents a benefit of the program for producers. Notice also that no interest accrues on the loan when the loan repayment rate is below the loan rate plus interest.
• Loan Deficiency Payment (LDP). In this case farmers do not take any loans and the benefit of the program is the difference between the loan rate and the county prices. If an LDP is paid on portion of a crop it is no longer eligible for a loan.
The benefits of the Marketing Loan feature of the program have been, on average, higher than described above. This is due to the fact that far-mers retain ownership of production and to the fact that the Loan Rate no longer provides price support. Thus the decision to take the benefit of the Marketing Loan is independent of the decision to sell production.
Typically a farmer will take the benefit of the program at the time market prices are seasonally at the lowest point and sell the crop later when prices are high again. Westcott and Price conclude the following from this:
encou-rages producers to plant more land to supported crops than they otherwise would and, as discussed earlier, may also influence the mix of crops planted. (p. 7)
Based on 999 information, Westcott and Price (p.8) show the follo-wing for soybeans:
Season average price: $ 4.65/bushel;
Marketing loan benefit: $ 0.85/bushel; (95 percent of the crop
received a marketing loan benefit; about 88 percent received and LDP with an average payment rate of $ 0.9/bushel and 7 percent received a loan gain of $ 0.76/bushel)
Average per-unit revenue: $ 5.50/bushel;
Commodity Loan Rate (999): $ 5.26/bushel; and
Revenue above Loan Rate: $ 0.24/bushel.
Thus, the marketing loan benefit amounts to 8.28 percent of the season average price and the revenue above the loan rate amounts to 5.6 percent.
Westcott and Price (200) have estimated the impact of this subsidy on world prices and other variables. Selected parts of their analysis and conclusions are quoted below:
“Soybean plantings are higher with marketing loans through 2004 except in 2000 ...Marketing loan benefits increase soybean net returns relative to returns to other crops in most years of the simulations, providing an economic incentive to plant more soy-beans. In 2000, however, relatively large marketing loan benefits for corn pull away land from soybeans.” (p. 7)
“Exports of soybeans are increased through 2004, except in 2000 when corn program benefits lead to lower soybean plantings. Exports of soybean meal and soybean oil rise as well when soy-bean acreage increases as higher domestic crush of soysoy-beans leads to higher production and lower prices in soybean product market.” (p. 7)
through 2004) prices for soybeans are reduced, with the largest impact of 49 cents occurring in 200 when acreage gains for the crop are highest.” (p. 9)
In the simulation made by these author’s, the impacts on prices from 998 to 2000 are minor; the highest is in 200 when the marketing assistance loan reduces prices by 49 cents per bushel, corresponding roughly to a reduction of 0 percent relative to the baseline with the
marketing loan assistance8.
Westcott and Price (200) analysis takes into account the following crops: wheat, corn, sorghum, barley, oats, soybean, rice and cotton. The effect of the marketing loan assistance on area planted is larger from 999
to 200 with acreage increases of 80 to .6 million hectares9 relative to
the no marketing loan assistance scenario. As inspection of figures 20 to 24 (p. 6) of the paper indicates that the effects on upland cotton and on soybeans are the largest relative to those on wheat, corn and rice. A similar conclusion regarding to exports is suggested by figures 25 to 30, with the difference that impacts on rice exports are large too. And for prices, other than soybean, the conclusion of the authors is that:
“In 999 through 200, wheat prices are lowered 4 to 7 cents per bushel in the marketing loan simulation, while corn prices are reduced 3 to 9 cents per bushel in 999 and 2000.... Rice prices are reduced throughout the simulation period, with declines of 0 to 20 cents per hundredweight in 2000 through 2005. Simu-lated price reductions for upland cotton range from to 5 cents per pound through 2002, the years of the largest cotton acreage increase due to marketing loan benefits.” (p. 9).
OECD (2000, p. 59) has performed a similar exercise. They have assumed that:
• there were no loan program payments for other crops and that other countries' policies remain unchanged; and
The paper does not contain tables. The percentage mentioned in the text is based on inspection
of Figure 34, page 20.
• the marketing loans to be US$ 49/ton in 20000; US$ 43/ton in 200;
US$ 3/ton in 2002; US$ 2/t in 2003; US$ 2/t in 2004 and zero in 2005. Based on these assumptions, they have concluded that:
“The withdrawal of such payments leads to lower soyabeans output (initially –5 percent) and increase the output of maize (initially +2 percent) and wheat (initially + percent). These production changes have temporary impacts on export levels and world prices. Initially world prices of soyabeans are 6 to 7 percent higher while world maize price are 3 percent lower. However, these effects are eroded by 2004 as markets adjust.” (OECD 2000, p. 59)
These studies indicate clearly that the Marketing Assistance Loan Program does have effects on world soybean prices and trade. However the impacts on Brazil’s production and exports are not mentioned in the papers and cannot be inferred from their results. A dedicated model, where Brazil in explicitly included, is needed to make this assessment.
Direct payments for oilseeds were introduced in the crop year 999/2000 based on past acreage and yields. They not only have been maintained by the FSRIA but were raised from about US$ 0,5 per bushel to US$ 0,44 per bushel. These payments are now specific to soybeans and are based on the acreage and yields of the period 998/200. As before
they are likely to be treated as decoupled by the WTO.
The FSRIA reduced the loan rate for soybeans from US$ 5.26 per bushel to US$ 5.00 per bushel for the period 2002-2007.
The counter cyclical payments are a novelty of the FSRIA in compa-rison with the FAIR Act. These are based on a target price whose value is US$ 5.80 per bushel until 2007. The counter cyclical payments are determined by the following formula:
Target price - (higher of farm price or loan rate) - direct payment
Counter cyclical payments are based on area and yield of soybeans
du-ring past periods, and are likely to be treated as decoupled by the WTO2.
10 The actual value of the marketing loan assistance in 2000 was US$ 3/ton (calculations based
on Hart and Babcock, 2001, Table 2 and the U.S. production of 5,055 million tons).
For the sake of completeness, we indicate below the methodology established by the FSRIA to determine acreage and yields for both direct and counter cyclical payments.
For direct payments
Soybean area is the average area during 998/200. (Farm Eco-nomics Facts & Opinions, June 5, 2002, no page numbers) Soybean yields, for the purpose of direct payments, are calculated as
follows: average of soybean yields from 1998 through 2001 times .7814.
The .7814 equals the ratio of the national soybean yields between 1981
through 1985 to national yields from 1998 to 2001. This adjustment keeps soybean program yield on a comparable base with corn and wheat yields. If a farm yield form 1998 through 2001 is below 75% of the county yield, the farm yield can be replaced by 75% of the
county yield. (Farm Economics Facts & Opinions, June 5, 2002,
no page numbers)
For counter cyclical payments
The area is determined exactly as in the case of the direct payments. For the determination of yields however the farmer may choose from three methodologies, as indicated below. (Farm Economics Facts & Opinions, June 5, 2002, no page numbers)
Program yield, which is determined by the same procedure used in the direct payments program.
The 70% difference method where yield is equal to the program yield plus 70% of the difference between the average yield for 998 through 200 and the program yield.
The 93.5% method where yield is equal to 93.5% of the average yield during the period998 to 200.
pro-ducers relative to the previous legislation. The raise in other payments more than compensated the reduction of the loan rates. For comparison purposes, assume that soybean market price, in the crop year 2002/2003, is US$ 4.45 per bushel and that acreage and yield of a typical farmer remain constant. A hypothetical comparison of the support received before and after the FSRIA made below:
Before the FSRIA Direct payments
Counter cyclical payments - Non existent
Marketing loan assistance
Total return
After the FSRIA Direct payments
Counter cyclical payments
Marketing loan assistance
Total return
has actually decreased from US$ .08/bushel to US$ 0.82/bushel. This is a critical issue for the next round of trade negotiations and for the soybean panel against the U.S. in the WTO.
. Model structure and experiments
This section lays down the main aspects of the world soybean mo-del, describes the steps to simulate the policy change and the counter factual analysis.
The world is divided into five regions (modules): Argentina, Brazil, the European Union, the United States (US) and the Rest of the World (ROW). The diagrams in Annex III show the model structure for each module.
For each module, area and yield equations determine the supply of soybeans. The domestic demand for soybeans by the crushing industry
and the domestic demand for “Other Uses” of soybeans are estimated3.
After determining the demand for crushing, “Other Uses” and soybeans supply, net exports are obtained from the identity:
net exports = production – crushing demand – other uses
Productions of oil and meal are fixed proportions of the volume of soybeans crushed. These are, in turn, divided in two parts: net exports and “Other Uses”. We estimate equations for net exports of soybean meal and for ”Other Uses” of soybean oil.
Net imports of soybeans, soybean oil and soybean meal of the rest of the world are exogenous, which means that they are not affected by the elimination of the U.S. Marketing Assistance Loan and other policies.
Equating net exports of the first four modules (Argentina, Brazil, European Union and the U.S.) to net imports of the ROW determines the international price of grain, oil and meal. These prices are expressed in domestic currency units, in real terms, by multiplying the dollar values by the region real exchange rate.
Equations linking the international price in domestic currency, to the domestic prices in domestic currency – price transmission equations – for the three products are also estimated. This is done with due consideration
13 The exception is the European Union where a net import equation was estimated and other
of domestic policies that may have affected this relation, such as the elimination of the export tax on soybeans in Brazil in 996.
The equations of the model, with the respective coefficients and sta-tistics, are presented in Annex I. All variables have the correct signs and are significant. There is no evidence of autocorrelation of the residuals and the fit of model within the sample is good.
Comparing the baseline scenario with one where no subsidy exists allo-ws for the estimation of the effects of the changes in policies. The baseline consists of the model forecasts for the period where data is available and of the projections, based on the relevant parameters of the FSRIA.
The two scenarios considered in the counter factual analyses are described below:
• Scenario . WTO rules are not changed and the Marketing Loan Assistance is the only policy that influences U.S. exports and world prices. This scenario is consistent with the lower impact on world prices and on world trade.
• Scenario 2. In addition to Marketing Loan Assistance, direct pay-ments and counter cyclical paypay-ments are removed. This gives an upper bound for the impacts on world prices and world trade.
It is clear that neither the direct payments nor the counter cyclical payments are entirely decoupled, as assumed in Scenario 2. The impact of these two subsidies on production and exports depend on expecta-tions regarding the next farm bill in 2007 and, as such, their effects may be smaller than those indicated in the simulations below. Nevertheless, the two scenarios give a reasonable range of variation for the variables relevant for this analysis.
5. Results
Table 3 - U.S. Marketing Loan Payments - US$/bushel
() (2) (3) (4) (5) (6) (7)
Years Loan Rate
Producer Price*
Adjustment factor (%)**
Marketing loan payments
() - (3) x (2)
Direct pay-ment ***
Counter cyclical payments
Producer return
998 5.26 4.93 0.98 0.45 0.00 0.00 5.38
999 5.26 4.63 0.95 0.87 0.4 0.00 5.63
2000 5.26 4.55 0.9 . 0.5 0.00 5.8
200 5.26 4.25 0.94 .25 0.5 0.00 5.65
2002 5.00 4.55 0.94 0.72 0.44 0.36 5.95
2003 5.00 4.55 0.94 0.72 0.44 0.36 5.95
2004 5.00 4.55 0.94 0.72 0.44 0.36 5.95
Source: USDA and Farm Security and Rural Investment Act, 2002. * After 200 estimated prices.
** The adjustment factor considers that the contract is closed at the lowest value of the season’s market price. After 200 estimated based on the 200 value.
*** Oilseed program until 200. After 200, Farms Security and Rural Investment Act.
In Scenario 1 the values of the marketing loan payments are reduced
to zero. In the Scenario 2 the producer return is the same as producer
price, that is, the marketing loan payments, the direct payments and the counter cyclical payments are all reduced to zero.
Scenario 1. Tables 4 to 3 contain results of simulations. Table 4 contains estimated price changes due to the removal of the marketing loan assistance. The average increase in world prices increase over the period 998/2004 in 3.95 percent, with highest values, of the order of 7 percent, in 2000 and in 200 when the marketing loan payments were at their peak. It is seen that producer prices in the U.S. are reduced on average .48 percent and Brazilian prices increase by about 3.8 percent, in line with the change in world prices.
The changes in world oil and meal prices are seen in Table 5. The ave-rage impact on oil prices is quite surprising, since it is even higher than the impact on grain prices. This is caused by the large reduction on crushing in the U.S. and by the small effect on domestic consumption. Meal prices, on the other hand, increase less than soybean world prices.
Table 6 shows the impacts on soybeans production in Argentina, Brazil and the U.S.. There is a reduction of approximately 30 million tons during the period 998/2004 in the U.S. production of soybeans, which correspond to approximately 5.3 percent of the production estimated in the baseline. This is, in part, compensated by increases in Argentina and Brazil of the order of 4 percent in each country. The largest impacts on Brazil take place during the period 200 and 2003, where production losses between 2 and 2.5 million tons per year.
Tables 7, 8 and 9 show the corresponding impacts on soybean oil production, soybean meal production and in soybean crushing. These impacts are in line with the changes observed in world prices and in soybeans production. Notice that the impact on Brazil is quite significant compared with that of Argentina and of the European Union.
In summary, the analysis of these tables indicate that the removal of the marketing loan assistance in the U.S. will have favorable impacts on soybean production as well as on the domestic crushing industry.
Tables 0 to 3 show net exports. The results indicate again that the impact of the removal of this subsidy on the world market is significant. Exports from the U.S. would be smaller (about 3 million tons in 2002) and those of Brazil and Argentina increased. In Brazil the highest impact is in 200, about 2 million tons, and the impact, during the period 998/2004, is of the order of 7 million tons. The impact on the value of exports, as seen in Table , is close to US$ 2 billion dollars, with the largest values (US$ 450 and US$ 382 millions) concentrated in 200 and 2002.
By the total value of net exports of the soybean complex are larger, since Brazilian exports of soybean oil and soybean meal will increase too. The total effect reaches the value of US$ 75 million in 200, dropping to US 699 millions in 2002. The total increment of exports of the soybean complex during the period is US$ 3 billion.
assistance is defined as domestic support (Amber Box). However, its impacts on U.S. exports are large relative to the change in production, as the following analysis shows. Total reduction in production in the U.S. over the period 998/2004 is of the order of 30 million tons. This is turn lead to a reduction of about 4 million tons in crushing and 4 million tons in exports of soybeans. That is, 50 percent of the effect on production influences directly exports. The 50 percent directed to addi-tional crushing also finds its way to the world markets through more exports of soybean oil and soybean meal. Thus, this program contains an important element of export subsidy that is ignored by the current definitions adopted in the WTO.
Scenario 2. Tables 4 to 23 contain results of simulations. The results encountered in this scenario do not differ qualitatively of those found in Scenario . The difference in the simulation between the two is that we have included fixed payments and counter cyclical payments as if they were not decoupled. As noted before, there is clearly an impact on production and trade induced by these policies that works through an expectation mechanism induced by the fact that the 2007 farm bill is likely to allow revisions of acreage and yield and only farmers who are now producing will be eligible for the revisions. To capture this mechanism in an econometric model is not easy and not feasible sin-ce the data is not yet available. In view of this difficulty, the authors agreed to simulate the effect of the removal of these policies as if they were not decoupled. This is likely to provide an upper bound for the actual impacts of the change in policy.
It is not necessary to analyze Tables 4 to 23 in detail since the nature of the results is similar. Nevertheless, we emphasize the points below.
• World price of soybeans increase by a maximum of 9 percent in 2000 and the increase remains above 7 percent in 200 and 2002.
• Producer prices in the U.S. are reduced 6 percent on average, with values as high as 20 percent towards the end of the period.
6. Summary
This paper has analyzed the impact of the current U.S. policy for soybeans on Brazilian production and trade of soybean and soybean products. The main findings of the study were:
• The elimination of the domestic support to soybeans will increase world prices of soybeans and of soybean products. The average increase in soybean prices during the period 998/2004 varies between 4 and 5 percent according to the liberalization scenario considered. The maxi-mum increase in prices occurs in 2000 and 200, when the marketing loan program provided the highest levels of support.
• Brazilian production over the entire period is reduced between 0 and 3 million tons.
• Exports of soybeans are reduced between 7 and 9 million tons, equivalent to US$ .6 to US$ 2.2 billion.
• Exports of the soybean complex are reduced between US$ 3 and US$ 4 billion dollars.
• This domestic support provided by U.S. policy has a significant impact on trade, since about 50 percent of the increase in soybean pro-duction will be exported directly. But the total impact is even greater since exports of soybean meal and soybean oil will take place too.
Antônio Salazar P
. Brandão e Elcyon Caiado Rocha Lima
6 9
Rio de Janeiro, vol. 44, nº 04, p. 631-676, out/dez 2006 – Impressa em dezembro 2006
ables
Years Area 000 ha Yield t/ha Production 000 t Area Index* Yield Index* Production Index* Area 000 ha Yield t/ha Production 000 t Area Index* Yield Index* Production Index*979 28,900 2.3 6,526 n.a. n.a. n.a. 8,774 .73 5,56 n.a. n.a. n.a. 980 28,30 .73 48,922 n.a. n.a. n.a. 8,50 .77 5,007 n.a. n.a. n.a.
98 27,335 .98 54,36 06 79 83 8,203 .56 2,836 73 7 5
982 28,687 2.08 59,6 06 78 83 8,37 .79 4,582 7 72 5
983 25,8 .72 44,58 03 78 80 9,42 .65 5,54 73 70 5
984 27,420 .85 50,644 03 76 79 0,53 .8 8,279 79 73 58
985 25,555 2.24 57,28 99 78 77 9,82 .55 4,250 82 70 57
986 24,446 2.6 52,869 97 84 8 9,32 .86 6,979 8 73 59
987 23,545 2.24 52,736 92 90 83 0,600 .7 8,02 82 7 59
988 23,83 .77 42,53 90 83 75 2,236 .93 23,579 9 77 70
989 24,64 2.3 52,354 90 83 75 ,585 .76 20,444 98 75 74
990 23,390 2.24 52,46 90 83 75 9,67 .64 5,757 95 75 7
99 23,950 2.26 54,065 90 89 8 9,44 2.06 9,456 87 76 66
992 23,950 2.49 59,62 90 94 84 0,635 2.4 22,70 85 82 69
993 24,36 2.09 50,886 9 92 83 ,525 2.7 24,963 90 89 80
994 24,938 2.74 68,445 92 99 9 ,675 2.23 26,068 96 9 88
995 25,292 2.34 59,75 94 97 9 0,29 2.32 23,872 95 94 89
996 25,980 2.49 64,78 96 02 98 ,486 2.38 27,327 95 97 92
997 28,33 2.58 73,77 00 00 00 3,304 2.46 32,665 00 00 00
998 29,49 2.56 74,599 05 03 08 3,008 2.4 3,377 08 0 09
999 29,839 2.42 72,225 0 02 2 3,640 2.5 34,27 4 03 7
2000 30,49 2.49 75,055 2 0 3 3,935 2.8 39,000 6 08 25
200 30,440 2.58 78,669 4 0 5 8 3
Rio de Janeiro, vol. 44, nº 04, p. 631-676, out/dez 2006 – Impressa em dezembro 2006 Impacts of the U
.S. subsidy to soybeans on W
orld prices, production and exports
Table 4 - Elimination of the U.S. Marketing
Loan Assistance for Soybeans
Table 5 - Elimination of the U.S. Marketing
Loan Assistance for Soybeans
(Percentage changes in soybean prices) (Percentage changes in soybean oil and meal prices)
Years World Price
Producer Price in the U.S.
Producer Price in
Brazil
Years Soybean Oil Soybean Meal
998 .82 -7.32 .75 998 2.33 .54
999 5.25 -2.9 5.04 999 7.82 4.5
2000 7.44 -4.99 7.4 2000 2.4 6.29
200 6.94 -5.79 6.66 200 5.47 5.36
2002 5.3 -0.4 5. 2002 3.0 3.2
2003 .4 -0.88 .35 2003 .8 -2.47
2004 0.0 -7.46 0.0 2004 5.4 -3.7
Average 3.95 -.48 3.8 Average 9.28 2.04
Antônio Salazar P
. Brandão e Elcyon Caiado Rocha Lima
6
5
Table 6 - Elimination of the U.S. Marketing Loan
Assistance for Soybeans
Table 7 - Elimination of the U.S. Marketing Loan
Assistance for Soybeans
(Changes in soybean production - 000 tons) (Changes in soybean oil production - 000 tons)
Years Argentina Brazil U.S. Years Argentina Brazil U.S. E.U.
998 50 30 -605 998 0 0 -46 0
999 229 397 -2,53 999 5 -52
2000 538 ,4 -3,662 2000 9 27 -242 6
200 940 2,97 -5,74 200 32 67 -35 38
2002 ,525 2,445 -5,955 2002 6 36 -500 24
2003 2,248 2,257 -5,847 2003 5 78 -582 3
2004 3,9 ,45 -6,075 2004 82 24 -738 47
Total 8,72 9,98 -29,47 Total 399 627 -2,60 428
Rio de Janeiro, vol. 44, nº 04, p. 631-676, out/dez 2006 – Impressa em dezembro 2006 Impacts of the U
.S. subsidy to soybeans on W
orld prices, production and exports
Table 8 - Elimination of the U.S. Marketing Loan
As-sistance for Soybeans
Table 9 - Elimination of the U.S. Marketing Loan
As-sistance for Soybeans
(Changes in soybean meal production - 000 tons) (Changes in soybean crushing - 000 tons)
Years Argentina Brazil U.S. E.U. Years Argentina Brazil U.S. EU*
998 0 0 -92 0 998 0 0 -24 0
999 4 22 -643 3 999 5 28 -809 4
2000 37 0 -,032 25 2000 43 36 -,280 3
200 35 266 -,498 59 200 59 333 -,850 98
2002 260 543 -2,30 52 2002 306 679 -2,629 65
2003 490 72 -2,48 476 2003 577 89 -3,063 595
2004 772 855 -3,46 620 2004 908 ,068 -3,884 775
Total ,698 2,508 -,2 ,803 Total ,998 3,34 -3,754 2,253
Antônio Salazar P
. Brandão e Elcyon Caiado Rocha Lima
6
5
3
Table 10 - Elimination of the U.S. Marketing Loan
Assistance for Soybeans
Table 11 - Elimination of the U.S. Marketing Loan
Assistance for Soybeans
(Changes in soybean net exports - 000 tons) (Changes in the value of soybean net exports - US$ million)
Years Argentina Brazil U.S. EU* Years Argentina Brazil U.S. EU*
998 23 63 -74 88 998 20 37 48 -38
999 30 460 -830 240 999 72 95 88 -05
2000 340 ,06 -,777 33 2000 26 292 -4 -30
200 593 ,922 -2,857 342 200 82 450 -225 -23
2002 946 ,782 -3,042 34 2002 250 382 -30 -95
2003 ,336 ,349 -2,80 25 2003 266 250 -428 -8
2004 ,850 37 -2,286 65 2004 326 65 -40
Total 5,28 7,052 -3,776 ,505 Total ,243 ,674 -,242 -498
Source: Model results Source: Model results
* Since the EU is a net importer of soybeans, a positive number indicates less imports
Rio de Janeiro, vol. 44, nº 04, p. 631-676, out/dez 2006 – Impressa em dezembro 2006 Impacts of the U
.S. subsidy to soybeans on W
orld prices, production and exports
Table 12 - Elimination of the U.S. Marketing
Loan Assistance for Soybeans, Brazil
Table 13 - Elimination of the U.S. Marketing Loan
Assistance for Soybeans, Brazil
(Changes in soybean and soybean products net exports - 000 tons)
(Changes in soybean and soybean products net exports - US$ million)
Years Soybeans Soybean oil
Soybean
Meal Years Soybeans
Soybean oil
Soybean Meal
Total Change
998 63 2 5 998 37 24 29 90
999 460 39 59 999 95 40 92 327
2000 ,06 57 48 2000 292 76 49 58
200 ,922 99 288 200 450 22 78 75
2002 ,782 48 507 2002 382 43 73 699
2003 ,349 206 602 2003 250 70 39 459
2004 37 20 79 2004 65 27 5 207
Total 7,052 762 2,339 Total ,674 703 674 3,05
Antônio Salazar P
. Brandão e Elcyon Caiado Rocha Lima
6
5
5
Table 14 - Elimination of the U.S. Marketing Loan
Assistance, Fixed and Counter Cyclical Payments for Soybeans
Table 15 – Elimination of the U.S. Marketing Loan
Assistance, Fixed and Counter Cyclical Payments for Soybeans
(Percentage changes in soybean prices) (Percentage changes in soybean oil and meal prices)
Years World Price
Producer Price in the U.S.
Producer Price
in Brazil Years Soybean Oil Soybean Meal
998 .83 -7.3 .76 998 2.33 .54
999 6.5 -3.64 6.25 999 9.37 5.62
2000 9.9 -5.45 8.8 2000 5. 7.89
200 7.32 -7.33 7.02 200 7.06 5.74
2002 7.87 -9.8 7.55 2002 6 5.44
2003 4.4 -9.68 4.23 2003 6.26 0.59
2004 0.02 -9.09 0.02 2004 5.98 -4.07
Average 5.2 -6.2 5.02 Average .5 3.2
Rio de Janeiro, vol. 44, nº 04, p. 631-676, out/dez 2006 – Impressa em dezembro 2006 Impacts of the U
.S. subsidy to soybeans on W
orld prices, production and exports
Table 16 - Elimination of the U.S. Marketing
Loan Assistance, Fixed and Counter Cyclical Payments for Soybeans
Table 17 - Elimination of the U.S. Marketing Loan
Assistance, Fixed and Counter Cyclical Payments for Soybeans
(Changes in soybean production - 000 tons) (Changes in soybean oil production - 000 tons)
Years Argentina Brazil U.S. Years Argentina Brazil U.S. E.U.
998 50 3 -606 998 0 0 -46 0
999 266 48 -2,556 999 5 -82
2000 643 ,374 -4,442 2000 0 30 -287 5
200 ,094 2,667 -5,888 200 39 79 -389 47
2002 ,847 2,800 -7,264 2002 72 6 -605 43
2003 2,899 2,960 -8,069 2003 40 203 -734 36
2004 4,20 2,378 -8,352 2004 280 273 -995 207
Total ,000 2,628 -37,77 Total 542 75 -3,239 539
Antônio Salazar P
. Brandão e Elcyon Caiado Rocha Lima
6
5
7
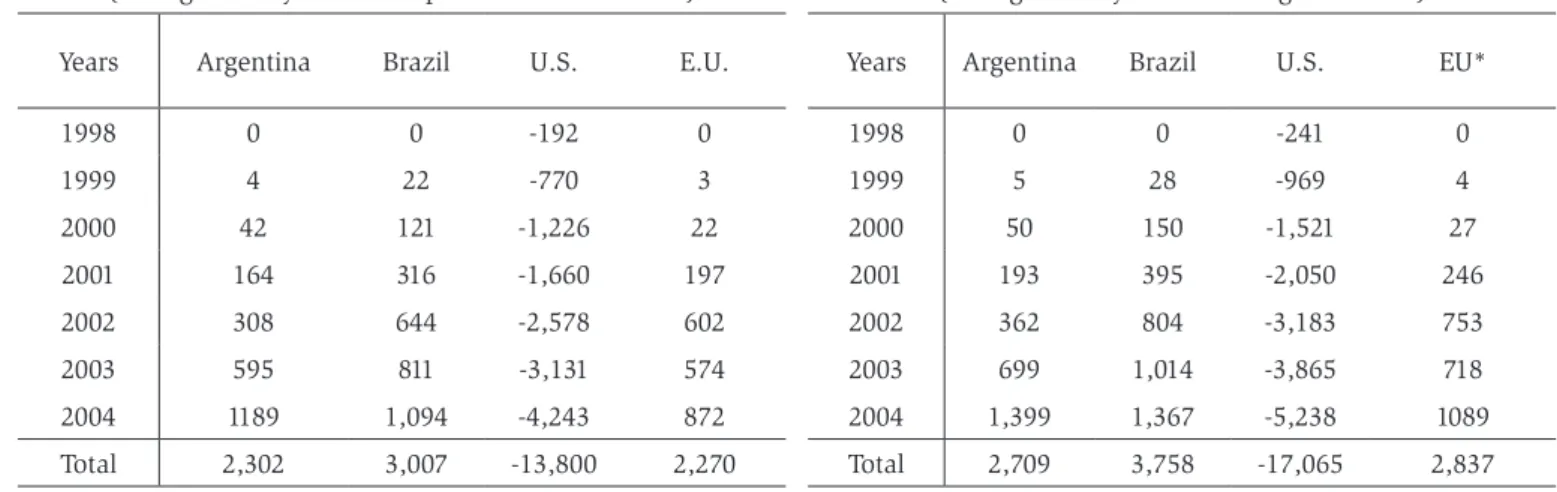
Table 18 - Elimination of the U.S. Marketing Loan
Assistance, Fixed and Counter Cyclical Payments for Soybeans
Table 19 – Elimination of the U.S. Marketing Loan
Assistance, Fixed and Counter Cyclical Payments for Soybeans
(Changes in soybean meal production - 000 tons) (Changes in soybean crushing - 000 tons)
Years Argentina Brazil U.S. E.U. Years Argentina Brazil U.S. EU*
998 0 0 -92 0 998 0 0 -24 0
999 4 22 -770 3 999 5 28 -969 4
2000 42 2 -,226 22 2000 50 50 -,52 27
200 64 36 -,660 97 200 93 395 -2,050 246
2002 308 644 -2,578 602 2002 362 804 -3,83 753
2003 595 8 -3,3 574 2003 699 ,04 -3,865 78
2004 89 ,094 -4,243 872 2004 ,399 ,367 -5,238 089
Total 2,302 3,007 -3,800 2,270 Total 2,709 3,758 -7,065 2,837
Rio de Janeiro, vol. 44, nº 04, p. 631-676, out/dez 2006 – Impressa em dezembro 2006 Impacts of the U
.S. subsidy to soybeans on W
orld prices, production and exports
Table 20 – Elimination of the U.S. Marketing Loan
Assistance, Fixed and Counter Cyclical Payments for Soybeans
Table 21 – Elimination of the U.S. Marketing Loan
Assistance, Fixed and Counter Cyclical Payments for Soybeans
(Changes in soybean net exports – 000 tons) (Changes in the value of soybean net exports - US$ million)
Years Argentina Brazil U.S. EU* Years Argentina Brazil U.S. EU*
998 23 63 -75 88 998 2 37 49 -38
999 47 503 -948 298 999 87 23 23 -30
2000 404 ,355 -2,59 400 2000 54 363 - -6
200 693 2,32 -3,378 365 200 205 529 -29 -29
2002 ,30 2,034 -3,65 452 2002 328 468 -302 -4
2003 ,698 ,988 -3,948 262 2003 42 409 -506 -78
2004 2,202 983 -3,269 84 2004 388 73 -574 4
Total 6,297 9,247 -7,492 ,948 Total ,594 2,2 -,5 -662
Source: Model results Source: Model results
* Since the EU is a net importer of soybeans, a positive number indicates less imports
Antônio Salazar P
. Brandão e Elcyon Caiado Rocha Lima
6
5
9
Table 22 - Elimination of the U.S. Marketing
Loan Assistance, Fixed and Counter Cyclical Payments for Soybeans, Brazil
Table 23 - Elimination of the U.S. Marketing Loan
Assistance, Fixed and Counter Cyclical Payments for Soybeans, Brazil
(Changes in soybean and soybean products net exports - 000 tons)
(Changes in soybean and soybean products net exports - US$ million)
Years Soybeans Soybean
oil Soybean Meal Years Soybeans
Soybean oil
Soybean
Meal Total Change
998 63 2 5 998 37 24 29 9
999 503 48 69 999 23 49 4 393
2000 ,355 66 72 2000 363 92 85 640
200 2,32 08 334 200 529 34 96 860
2002 2,034 86 62 2002 468 80 252 900
2003 ,988 244 739 2003 409 223 52 783
2004 983 243 928 2004 73 49 40 362
Total 9,247 907 2,879 Total 2,2 850 968 4,029
8. References
Hart, Charles E. and Bruce A. Babcock. Implications of the WTO on the
Redesign of U.S. Farm Policy. Center for Agricultural and Rural
Develo-pment, Iowa State University, Briefing Paper 01-BP 32, May 200.
Nelson, Frederick J. Aligning U.S. Farm Policy with World Trade
Com-mitments, Agricultural Outlook, January – February 2002, pp. 2-6.
OECD Agricultural Outlook 2000-2005, Paris, 2000.
OECD Agricultural Outlook 2001-2006, Paris, 200.
OECD Agricultural Policies in OECD Countries: Monitoring and
Eva-luation, Paris, 200.
OECD Agricultural Databases, CD, Paris 200.
Orden, David. Reform’s Stunted Crop, in Regulation, Spring 2002, Vol.
25, N° .
Scronce, Philip W. Grains and Oilseeds Outlook for 2001. Feed Grains
and Oilseeds Analysis Group, Farm Service Agency, U.S. Department of Agriculture. Agricultural Outlook Forum 200, February 23, 200.
USDA Agricultural Statistics 2001, CD, Washington, D.C., 200
Valdés, Alberto and William Foster. Reflections on the Policy
Impli-cations of Agricultural Price Distortions and Price Transmission for Producers in Developing Countries and Transition Economies. Paper
presented at the OECD Global Forum on Agriculture, OECD, Paris, May
23 and 24, 2002.
Westcott, Paul and Michael J. Price. Analysis of the U.S. Commodity
Loan Program with Commodity Loan Provisions. Economic Research
Service/USDA, Agricultural Economic Report No. 801, April 200.
Westcott, Paul C. and Michael J. Price. Impacts of the U.S. Marketing
Loan Program for Soybeans. Special Article for Oil Crops Situation and
9. Annex I - Equations
Argentina Module
Table 24
Other uses Domestic Prices Equations argsjoc argfaoc argoloc argsjpdd argfapdd argolpdd
constant 536.462 29.6394 - .9484 -
-(92.633) (87.802) (0.632)
argfapid - - - - 0.9863
-(0.003)
argolpid - - - 0.996
(0.003)
argsjpid - - - 0.5844 -
-(0.02)
argfaoc(-1) - -0.594 - - -
-(0.2283)
argoloc(-1) - - -0.4500 - -
-(0.20)
argsjoc(-1) -0.076 - - - -
-(0.0956)
argsjoc(-2) -0.739 - - - -
-(0.099)
argfaqp-argfaqp(-1) - 0.38 - - -
-(0.0585)
argsjqp-argsjqp(-1) 0.5355 - - - -
-(0.0499)
argpib - - .2975 - -
-(0.223)
argostax1 - - - 6.0704 -
Rio de Janeiro, vol. 44, nº 04, p. 631-676, out/dez 2006 – Impressa em dezembro 2006 Impacts of the U
.S. subsidy to soybeans on W
orld prices, production and exports
Table 25 - Area, Crushing and Yield Equations
constant argsjarea(-1) argsjesmag(-1) argsjyld(-1) argmargid(-1)1 argsjpid argsjpdd(-1)
*argsjyld(-1)
argmlpdd(-1) *argmlyld(-1)
time trend
argsjarea - 0.9802 - - - - 0.34 -0.37
-(0.04) (0.08) (0.05)
argsjesmag 0.9074 - 0.904 - 0.005 - - -
-(0.9) (0.02) (0.00)
argsjyld - - - -0.2677 - 0.557 - - 0.00
(0.22) (0.03) (0.00)
Brazil Module
Table 26
Net Exports Other Uses Domestic Prices Equations brfaexl brsjoc1 broloc brsjpdd brfapdd brolpdd
constant - 6364 - - -0.7506 -0.802
(904) (0.350) (0.5024)
brfapid 0.0896 - - - .229
-(0.0295) (0.0550)
brolpid - - -0.2028 - - .25
(0.04) (0.0690)
brsjpid1 - -4.606 - - -
-(2.230)
brsjpid - - - 0.960 -
-(0.002)
brfaqp .24 - - - -
-(0.0909)
brsuqp -0.744 - - - -
-(0.0886)
brfaexl(-1) 0.00 - - - -
-(0.0637)
broloc(-1) - - -0.9777 - -
-(0.3400)
broloc(-2) - - -0.69 - -
-(0.3405)
broloc(-3) - - -0.3934 - -
-(0.2763)
brfrango -0.766 - - - -
-(0.0649)
brpop - - .2673 - -
-(0.3475)
brtjur1 - -65.933 - - -
-(37.5900)
brsjoc(-2)1 - -0.7322 - - -
-(0.2354)
time trend 0.0834
(0.0233)
dummy - - 0.0832 0.0479 0.547
(0.029) (0.0390) (0.0552)
Rio de Janeiro, vol. 44, nº 04, p. 631-676, out/dez 2006 – Impressa em dezembro 2006 Impacts of the U
.S. subsidy to soybeans on W
orld prices, production and exports
Table 27 - Area, Crushing and Yield Equations
brsjarea(-1) brsjesmag(-1) brsjesmag(-2) brsjpid(-1) brsjpdd brmlpdd(-1) brrecunit(-1) brsjpdd(-1)
*brsjtyld(-1) time trend
brsjarea 0.524 - - - - -0.508 - 0.5373
-(0.0) (0.) (0.)
brsjesmag - 0.6364 0.3256 -0.7547 - - 0.8045 -
-(0.3) (0.3) (0.7) (0.8)
brsjyld - - - - 0.0537 - - - 0.0258
European Union Module
Table 28
Net Exports Equations Domestic Prices Equations cesjiml cefaiml ceolexl cesjpdd1 cefapdd ceolpdd1
constant 0.0482 - - 684.700 -
-(4.985) (45.3229)
cefapid - -0.2940 - - .336
-(0.002) (0.44)
cefapid(-1) - - - - -0.227
-(0.37)
ceolpid - - 0.200 -
-(0.0536)
ceolpid1 - - - - .2888
(0.027)
ceolpid(-1)1 - - - - - -0.7004
(0.678)
cesjpid1 - - - 0.4707 -
-(0.076)
ceolpdd(-1)1 - - - - - 0.4377
(0.747)
ceolqp1 - - 0.000 - -
-(0.000)
ceruqp - 0.4672 - - -
-(0.506)
cefaiml(-1) - 0.5666 - - -
-(0.489)
cesjiml(-1) -0.220 - - - -
-(0.2864)
cesjiml(-2) 0.2527 - - - -
-(0.2687)
ceolexl(-2) - - 0.4060 - -
-(0.0748)
cesjtcr*misjpid -0.3084 - - - -
-(0.54)
dummy - - - -543.8232 -
-(29.2943)
Rio de Janeiro, vol. 44, nº 04, p. 631-676, out/dez 2006 – Impressa em dezembro 2006 Impacts of the U
.S. subsidy to soybeans on W
orld prices, production and exports
Table 29 - Area, Crushing and Yield Equations
cesjarea(-1) cemargid(-1)1 cesjesmag(-1) cesjesmag(-2) cesjesmag(-3) cesjpdd cesjtyld(-1) cesjyld(-1) time
trend
cesjarea 0.579 - - - - 0.249 0.9709
-(0.0) (0.07) (0.65)
cesjesmag - 0.0052 0.252 0.6422 0.295 - - -
-(0.00) (0.25) (0.25) (0.28)
cesjyld - - - 0.099 - 0.306 0.055
(0.03) (0.24) (0.0)
U.S. Module
Table 30
Net Exports Other Uses Domestic Prices Equations euafaexl euasjoc1 euaoloc euasjpdd euafapdd1 euaolpdd constant -20.4383 8567 .7932 -0.0749 - -0.6092
(4.07) (356) (.478) (0.922) (0.2352)
euafapid 0.236 - - - -
-(0.062)
euafapid1 - - - - .0354
-(0.0405)
euaolpid - - -0.754 - - .0965
(0.0494) (0.0373)
euasjpid1 - -54.9704 - - -
-(2.9759)
euasjpid - - - .0073 -
-(0.0346)
euafapdd(-1)1 - - - - -0.0485
-(0.0396)
euafaqp 2.9342 - - - -
-(0.3850)
euafaexl(-2) -0.39 - - - -
-(0.069)
euaoloc(-2) - - -0.2946 - -
-(0.683)
euasjoc(-2)1 - -0.3379 - - -
-(0.692)
dummy - - - - -.343
-(2.9906)
time trend -0.064 - 0.0367 - -
-(0.005) (0.0049)
Rio de Janeiro, vol. 44, nº 04, p. 631-676, out/dez 2006 – Impressa em dezembro 2006 Impacts of the U
.S. subsidy to soybeans on W
orld prices, production and exports
Table 31 - Area, Crushing and Yield Equations
constant euasjarea (-1)
euasjarea (-2)
euatrrret1 (-1)
euasjyld (-1)
euasjyld
(-2) euamargid1euasjqp
euasjrret1(-1) /
euamlrret1(-1) euasjrret1 dummy time trend
euasjarea 2.07 0.3557 0.38 0.0749 - - - - 0.244 - 0.083
-(.4) (0.9) (0.7) (0.04) (0.08) (0.02)
euasjesmag - - - 0.004 0.9408 - - -
-(0.00) (0.00)
euasjyld - - - -0.3253 -0.2358 - - - 0.22 - 0.0289
(0.29) (0.27) (0.04) (0.0)
Antônio Salazar P
. Brandão e Elcyon Caiado Rocha Lima
6
6
9
The equations for area and yield for the U.S. were reestimated for Scenario 2. The new equations are shown in Table 32 below.
Table 32 - Area, Crushing and Yield Equations
constant euasjarea (-1)
euasjarea (-2)
euatrturet (-1)
euasjyld (-1)
euasjyld
(-2) euamargid1 euasjqp
euasjturet(-1)
/euamlturet(-1) euasjturet dummy time trend euasjarea 6.4899 0.228 0.469 -0.0497 - - - - 0.2734 - 0.0645
-(.4) (0.4) (0.3) (0.04) (0.05) (0.02)
euasjyld - - - -0.329 -0.2339 - 0.2 - 0.0287
(0.29) (0.27) (0.04) (0.0)
0. Annex II - Notation
Argentine Module
argfaoc soybean meal other uses, 000 ton, calculation.
argfapdd soybean meal domestic price, Pesos/ton, MECON/SAGPyA.
argfapid soybean meal international price, Pesos/ton, CBOT.
argfaqp soybean meal production, 000 ton, OIL WORLD.
argmargid crushing margin at international prices
argmlpdd maize domestic price, pesos/ton, MECON/SAGPyA.
argmlyld maize yield, kg/ha.
argoloc soybean oil other uses,000 ton, calculation.
argolpdd soybean oil domestic price, Pesos/ton, MECON/SAGPyA.
argolpid soybean oil international price, Pesos/ton, CBOT.
argostax oil seed tax rate
argpib gross domestic product, FMI/IFS - International.
argsjoc soybean other uses, 000 ton, calculation.
argsjarea soybean area planted, 000 ha, MECON.
argsjesmag soybean crushing, 000 ton, OIL WORLD.
argsjpdd soybean domestic price, Pesos/ton, MECON/SAGPyA.
argsjpid soybean international price, Pesos/ton, CBOT.
argsjyld soybean yield ton/ha, MECON.
Brazilian Module
brfaexl soybean meal net exports, 000 ton, OIL WORLD.
brfapdd soybean meal domestic price, R$/ton, DERAL/DEB - SEAB/PR.
brfapid soybean meal international price, R$/ton, CBOT.
brfaqp soybean meal production 000 ton, OIL WORLD.
brfrango chicken meat production 000 ton, UBA / APINCO.
brmlpdd maize domestic price, R$/ton, FGV.
broloc soybean oil other uses,000 ton, calculation.
brolpid soybean oil international price, R$/ton, CBOT.
brpop population estimated, IBGE.
brrecunit unitary revenue from crushing
brsjarea soybean area planted, 000 ha, IBGE.
brsjesmag soybean crushing, 000 ton, OIL WORLD.
brsjoc soybean other uses,000 ton, calculation.
brsjpdd soybean domestic price, R$/ton, FGV.
brsjpid soybean international price, R$/ton, CBOT.
brtjur real interest rate.
brsjyld soybean yield ton/ha, IBGE.
brsuqp pork production 000 ton, IBGE.
U.S. Module
euafaexl soybean meal net exports, 000 ton, OIL WORLD.
euafapdd soybean meal domestic price, US$/ton, USDA.
euafapid soybean meal international price, US$/ton, CBOT.
euafaqp soybean meal production 000 ton, OIL WORLD.
euamlrret1 farm return for corn producers
euamargid crushing margin at international prices
euaoloc soybean oil other uses,000 ton, calculation.
euaolpdd soybean oil domestic price, US$/ton, USDA.
euaolpid soybean oil international price, US$/ton, CBOT.
euatrplr loan rate for wheat
euasjarea soybean area planted, 000 ha, USDA.
euasjesmag soybean crushing, 000 ton, OIL WORLD.
euasjoc soybean other uses,000 ton, calculation.
euasjpdd soybean domestic price, US$/ton, USDA.
euasjpid soybean international price, US$/ton, CBOT.
euasjqp soybean production 000 ton, OIL WORLD.
euasjrret1 soybean farmer return
euasjturet price paid to the soybean producer (includes subsidies, marke-ting loan assistance, direct payment and counter cyclical pay-ment), calculation
euatrturet price paid to the wheat producer (includes subsidies, marke-ting loan assistance, direct payment and counter cyclical pay-ment), calculation
euamlturet price paid to the maize producer (includes subsidies, marke-ting loan assistance, direct payment and counter cyclical pay-ment), calculation
European Union Module
cefaiml soybean meal net imports, 000 ton, OIL WORLD.
cefapdd soybean meal domestic price, Euro/ton, AgLink
cefapid soybean meal international price, Euro/ton, AgLink
cemargid crushing margin at international prices
ceolexl soybean oil net exports,000 ton, OIL WORLD.
ceolpdd soybean oil domestic price, Euro/ton, AgLink
ceolpid soybean oil international price, Euro/ton, AgLink
ceolqp soybean oil production 000 ton, AgLink
cesjarea soybean area planted, 000 ha, AgLink
cesjesmag soybean crushing, 000 ton, OIL WORLD.
cesjiml soybean net imports, 000 ton, OIL WORLD.
cesjpdd soybean domestic price, Euro/ton, AgLink
cesjpid soybean international price, Euro/ton.
ceruqp ruminant production 000 ton, AgLink
cesjyld soybean yield ton/ha, AgLink
cesjtcr soybean farm return
cesjtyld soybean yield trend, calculation.
misjpid soybean international market price Euro/ton, calculation.
Antônio Salazar P
. Brandão e Elcyon Caiado Rocha Lima
6 7 3
Rio de Janeiro, vol. 44, nº 04, p. 631-676, out/dez 2006 – Impressa em dezembro 2006 SOYBEAN MODEL
Σ
Σ
=
=
Module Real ExchageRate Considering Tax,
Subsidies, Transportation Costs
Net Imports of Soybean Oil (Rest of
the World) Determination of
International Prices of Soybean and Soybean
Oil and Meal (in constant US$) International Prices of
Soybean and Soybean Oil and Meal (in constant domestic
currency) Domestic Prices ( in
constant domestic currency) Soybean Yeild Soybean Meal Production Σ
=
A R G E N T I N E M O D U L E Technical Coefficient Technical Coefficient Soybean Area Soybean Production CrushingNet Imports of Soybean Meal (Rest of the
World)
Net Imports of Soybean (Rest of the World) Aggregate Net Exports of Soybean (All Modules) Soybean Meal Net Exports Soybean Oil Net Exports Aggregate Net Exports of Soybean Oil (All
Modules) Adding up Net
Exports of all Modules Aggregate Net Exports of Soybean Meal (All Modules) Soybean Net Export Other Uses Soybean Meal (including change in Stocks) Soybean Oil Production Other Uses Soybean (including change in Stocks) Other Uses Soybean oil (including change in Stocks)
Rio de Janeiro, vol. 44, nº 04, p. 631-676, out/dez 2006 – Impressa em dezembro 2006 Impacts of the U
.S. subsidy to soybeans on W
orld prices, production and exports
Σ
Σ
=
=
Module Real ExchageRate Considering Tax,
Subsidies, Transportation Costs
Net Imports of Soybean Oil (Rest of
the World) Determination of
International Prices of Soybean and Soybean Oil and Meal (in
constant US$) International Prices of
Soybean and Soybean Oil and Meal (in constant domestic
currency) Domestic Prices ( in
constant domestic currency) Soybean Yeild Soybean Oil Production Soybean Meal Production Σ
=
B R A Z I L M O D U L E Technical Coefficient Technical Coefficient Soybean Area Soybean Production CrushingNet Imports of Soybean Meal (Rest
of the World)
Net Imports of Soybean (Rest of the
World) Aggregate Net Exports of Soybean (All Modules) Soybean Net Export Soybean Meal Net Exports Soybean Oil Net Exports Aggregate Net Exports of Soybean Oil (All Modules) Adding up Net Exports of all Modules Aggregate Net Exports of Soybean Meal (All Modules) Other Uses Soybean Meal (including change in Stocks) Other Uses soybean Oil (including change in Stocks) Other Uses Soybean (including change in Stocks)
Antônio Salazar P
. Brandão e Elcyon Caiado Rocha Lima
6 7 5 Σ Σ
=
=
Module Real Exchage Rate Considering Tax,
Subsidies, Transportation Costs
Net Imports of Soybean Oil (Rest of
the World) Determination of
International Prices of Soybean and Soybean
Oil and Meal (in constant US$) International Prices of
Soybean and Soybean Oil and Meal (in constant domestic
currency) Domestic Prices ( in
constant domestic currency) Soybean Yeild Soybean Oil Production Soybean Meal Production Σ
=
U. S. M O D U L E Technical Coefficient Technical Coefficient Soybean Area Soybean Production CrushingNet Imports of Soybean Meal (Rest
of the World)
Net Imports of Soybean (Rest of the
Rio de Janeiro, vol. 44, nº 04, p. 631-676, out/dez 2006 – Impressa em dezembro 2006 Impacts of the U
.S. subsidy to soybeans on W
orld prices, production and exports
SOYBEAN MODEL
Σ
Σ
=
=
Module Real ExchageRate Considering Tax,
Subsidies, Transportation Costs
Net Imports of Soybean Oil (Rest of
the World) Determination of
International Prices of Soybean and Soybean
Oil and Meal (in constant US$) International Prices of
Soybean and Soybean Oil and Meal (in constant domestic
currency) Domestic Prices ( in
constant domestic currency) Soybean Yeild Soybean Oil Production Soybean Meal Production Σ
=
E U R O P E A N U N I O N M O D U L E Technical Coefficient Technical Coefficient Soybean Area Soybean Production CrushingNet Imports of Soybean Meal (Rest of the
World)
Net Imports of Soybean (Rest of the World) Aggregate Net Exports of Soybean (All Modules) Soybean Meal Net Exports Soybean Oil Net Exports Aggregate Net Exports of Soybean Oil (All
Modules) Adding up Net
Exports of all Modules Aggregate Net Exports of Soybean Meal (All Modules) Other Uses Soybean Meal (including change in Stocks) Soybean Net Exports Other Uses Soybean Oil (including change in Stocks) Other Uses Soybean (including change in Stocks) R
ecebido em junho de 2
006 e r
evisto em outubr
o de 2