579 DOI: 10.1590/1982-0224-20140157
Fish complementarity is associated to forests in Amazonian streams
Carolina Rodrigues Bordignon
1, Lilian Casatti
1, María Angélica Pérez-Mayorga
1,
Fabrício Barreto Teresa
2and Gabriel Lourenço Brejão
1The functional structure of communities is commonly measured by the variability in functional traits, which may demons-trate complementarity or redundancy patterns. In this study, we tested the influence of environmental variables on the functional structure of fish assemblages in Amazonian streams within a deforestation gradient. We calculated six ecomor -phological traits related to habitat use from each fish species, and used them to calculate the net relatedness index (NRI) and the nearest taxon index (NTI). The set of species that used the habitat differently (complementary or overdispersed assemblages) occurred in sites with a greater proportion of forests. The set of species that used the habitat in a similar way (redundant or clustered assemblages) occurred in sites with a greater proportion of grasses in the stream banks. Therefore, the deforestation of entire watersheds, which has occurred in many Amazonian regions, may be a central factor for the functional homogenization of fish fauna.
A estrutura funcional das comunidades é comumente medida através da variabilidade nos traços funcionais, que pode demonstrar padrões de complementaridade ou redundância. Testamos a influência de variáveis ambientais na estrutura funcional de peixes de riachos Amazônicos ao longo do gradiente de desmatamento. Para cada espécie, calculamos seis traços ecomorfológicos relacionados ao uso do hábitat e usamos esses traços para calcular o índice de proximidade de táxon (NRI) e o índice do táxon mais próximo (NTI). Os conjuntos de espécies que usam o hábitat de modo distinto (comunidades complementares) ocorreram em trechos de microbacias com maior proporção de florestas, e os conjuntos de espécies que utilizam o hábitat de forma similar (comunidades redundantes) ocorreram em trechos com maior proporção de gramíneas nas margens. Portanto, o desmatamento de microbacias inteiras, como vem acontecendo em muitas regiões Amazônicas, pode ser o fator principal para a homogeneização funcional da ictiofauna.
Keywords: Amazon Forest, Conservation, Ecomorphology, Functional diversity, Habitat use.
1Universidade Estadual Paulista (UNESP), Departamento de Zoologia e Botânica, Rua Cristóvão Colombo 2.265, 15054-000 São José
do Rio Preto, SP, Brazil. (CRB) [email protected] (corresponding author), (LC) [email protected], (MAPM) anyelicaperez@ yahoo.com, (GLB) [email protected]
2Universidade Estadual de Goiás (UEG), Unidade Universitária de Ciências Exatas e Tecnológicas, BR-153, 3.105, 75132-903 Anápolis
GO, Brazil. [email protected]
Introduction
The functional diversity of a community can be greatly influenced by the loss or addition of species with different traits from most species (i.e., functionally unique) (Cianciaruso et al., 2013). These changes may occur due to different processes, and deforestation has been associated with decreases in functional diversity in different communities (Tilman et al., 1997; Dolédec et al., 2006; Flynn et al., 2009; Barragán et al., 2011). The consequences of these changes can be dramatic, especially in areas of high biodiversity, such as the Amazon (Barletta et al., 2010), one of the most important biomes of the planet due to the extent of its rainforests and drainage network (Krusche et al., 2005). Approximately 735,000 km2 of the 5 million km2 that comprised the original Amazon Forest biome have been deforested
in Brazil until 2013 (Instituto Nacional de Pesquisas Espaciais (INPE), 2014). This phenomenon is particularly alarming in the state of Rondônia, which has the second highest deforestation rate in Brazil (772 km² in 2013), and in 2006 approximately 65.9% of the state area had been cleared (INPE, 2010).
The functional structure of communities is commonly measured through the variability in functional traits (i.e., functional diversity; Mouchet et al., 2010), which may demonstrate complementarity or redundancy patterns (Falk et al., 2006). High functional complementarity occurs in communities with higher functional diversity than expected by chance (Blüthgen & Klein, 2011). Conversely, functional redundancy is the occurrence of functionally similar species which have less functional diversity than expected by chance (Loreau, 2004). The occurrence of complementary or redundant communities may reflect the differential influence of environmental filters (Poff et al., 1997). For example, in highly degraded streams, where the harsh environmental conditions filters species through their traits, so that species with a given set of traits can only survive, it is expected that coexisting species would be functionally more similar (functionally redundant communities). Conversely, higher resource availability and habitat complexity in pristine streams may provide favourable conditions to functionally distinct species to coexist, forming communities with higher functional complementarity.
We tested the influence of environmental variables on the functional structure of Amazonian stream fish communities in watersheds with different degrees of deforestation. We expected to find communities functionally more different in stream reaches embedded in watersheds with higher amounts of forests.
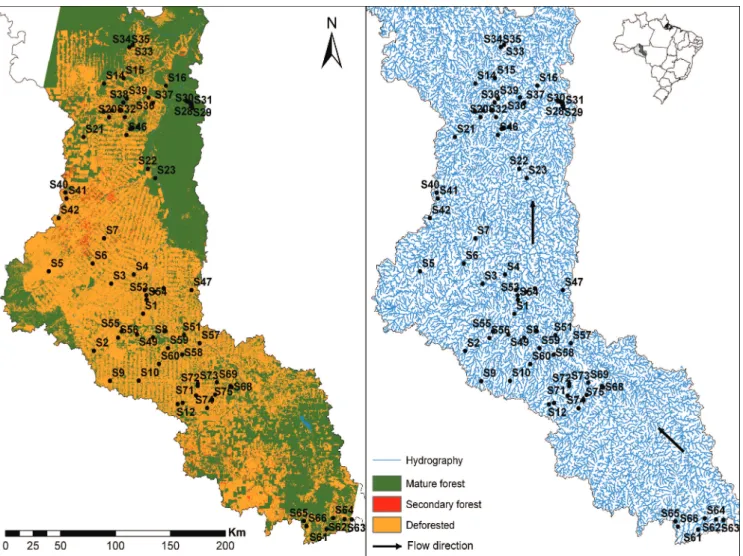
Material and Methods
Study area. This study was conducted in the rio Machado basin (Fig. 1), which drains the most populated area of Rondônia, Northern Brazil, with a total catchment area of 75,400 km2. The rio Machado is approximately 1,200 km long (Fernandes & Guimarães, 2002) and is formed by the confluence of the Comemoração and Pimenta Bueno rivers. Along its course, it also receives the Rolim de Moura, Urupá, Jaru, Machadinho, and Preto rivers and flows into the right bank of the rio Madeira (Ballester et al., 2003). This region has many terra firme streams, which are intermittent during most of the dry season (Fernandes & Guimarães, 2002).
This region has been altered since 1970, with settlements along the highway BR-364. The watersheds that form the rio Machado basin are covered by forests (mature and secondary, ranging from 0 to 100% of coverage) or grasses which are used as pasture for cattle ranching (Fernandes & Guimarães, 2002). Due to this mixed degree of forest cover conditions, the rio Machado basin represents a suitable model for studying the biological consequences of human activities, such as habitat loss and simplification, on diverse aspects of fish ecology, notably on the functional diversity. Samplings were conducted in streams with different degrees of forest cover, from highly degraded to entirely forested, like thoseinside the protected areas, such as Jaru Biological Reserve and Rio Preto-Jacundá, Castanheira, and Aquariquara Extractive Reserves.
Watersheds selection. We generated the drainage network and the watersheds using the hydrological model S.W.A.T. (Soil and Water Assessment Tools) and satellite images of MDET SRTM (90 x 90 m resolution) from NASA (available at www.usgs.gov) to select the watersheds to be sampled. In order to standardize the stream order (2nd to 4th orders sensu Strahler, 1957), we selected watersheds with areas between 1,500 ha and 5,000 ha that represented the forest coverage variation in the watersheds (from 0 to 100% of forests). Overall, we sampled 75 streams reaches (one per
watershed), 80-m long, that were definitively selected in situ after following these criteria: accessibility and authorization by the owners, maximum depth of 1.5 m, and the presence of perennial watercourses. We conducted the fieldwork in
August and October of 2011 and in June and July of 2012. These months are characterized by low rainfall and in both years the hydrological regime was similar (Agência Nacional das Águas (ANA), 2009).
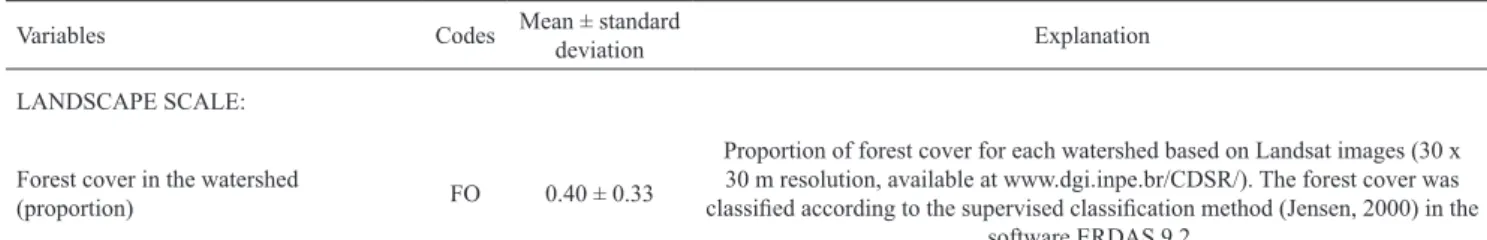
Environmental variables. As environmental variables we considered landscape and local attributes. The landscape variable was represented by the proportion of forests in the watershed, which was obtained for each site (see Table 1 for procedures). The amount of forests in the watershed influences not only habitat characteristics (Krusche et al., 2005; Gonçalves Jr. & Callisto, 2013), but also diversity patterns (Poole & Downing, 2004), and it is a good surrogate for the watershed’s conservation status.
The local variables were obtained during the fieldwork.
In each reach, we measured five local variables associated
to fish habitat (see Table 1 for the details of how each variable was obtained): percentage of grasses in the riparian banks; percentage of submerged roots in the riparian banks; percentage of consolidate substrate; percentage of large wood debris on the stream bottom; and average depth (Table 1).
Table 1. Scales, variables, codes, mean ± standard deviation, and explanation of how each variable was obtained.
Variables Codes Mean ± standard
deviation Explanation
LANDSCAPE SCALE:
Forest cover in the watershed
(proportion) FO 0.40 ± 0.33
Proportion of forest cover for each watershed based on Landsat images (30 x
30 m resolution, available at www.dgi.inpe.br/CDSR/). The forest cover was
classified according to the supervised classification method (Jensen, 2000) in the
software ERDAS 9.2.
Local scale: calculated from (at least 20 m) measurements obtained in each stream reach
Grasses in the stream banks (%) GRA 35.02 ± 38.00
Percentage of the reach bank extension that was covered by marginal grasses
derived from surrounding pasture entering the water. For this calculation, both stream sides were computed.
Submerged roots in the stream banks (%) ROO 3.43 ± 5.87 Percentage of the reach bank extension that presented roots derived from riparian trees entering the water. For this calculation, both stream sides were computed.
Consolidate substrate (%) CSU 2.11 ± 3.68 Percentage of gravel and cobbles (particles with 2-256 mm in size) on the bottom of each stream reach (following the classification of Krumbein & Sloss, 1963).
Large wood debris on the stream bed (%) LWD 11.35 ± 10.77 Percentage of fallen branches and trees, representing large wood debris, on the stream bed of each reach.
Depth (cm) DEP 27.26 ± 14.03 Average value of depth.
Fish data and ecomorphological traits. To collect fish,
firstly we used two blocking nets (2 mm mesh) to isolate the stream reach. Two people collected fish using the most
appropriate technique according to the reach characteristics. A hand seine (2 mm mesh) was used for portions without marginal vegetation with a sandy or clay bottom; a dip net (2 mm mesh) was used for portions with trunks, branches, and
gravel. The sampling effort was standardized in one hour for
each reach. Fish were fixed in 10% formalin and transferred to 70% ethanol. Voucher specimens were deposited at the fish collection of the Departamento de Zoologia e Botânica
(DZSJRP), Universidade Estadual Paulista, São José do Rio Preto, Sao Paulo, Brazil (for voucher numbers, see
We considered ecomorphological traits related to habitat use as functional traits. From the set of 139 species (Appendix) sampled in the 75 streams, we measured 137 species, except for Potamotrygon orbignyi and Synbranchus marmoratus that
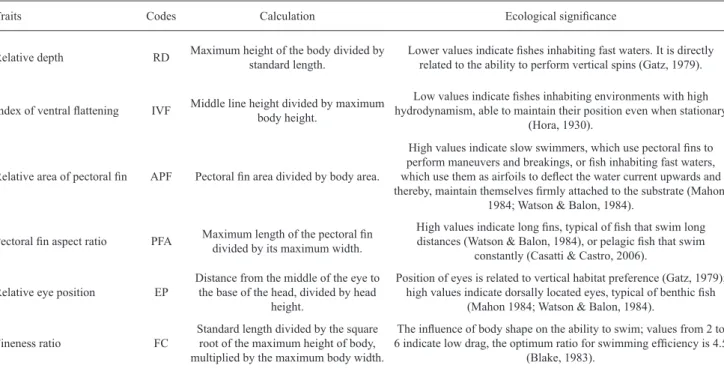
were excluded from this analysis due to the absence of pectoral fins. We took 11 measurements from each specimen, which were used to calculate six ecomorphological traits (Table 2) related to adaptations to water flow, swimming ability, and position in the water column, following Gatz (1979), Mahon (1984), and Watson & Balon (1984). We obtained linear measurements, area, and width with a stereomicroscope (Zeiss Discovery V12 SteREO), coupled with an imaging software (AxioVision Zeiss) and digital caliper to the nearest 0.01 mm. For larger species, we obtained areas of fins and body by drawing their profiles on graph paper (Beaumord & Petrere Jr., 1994).
Functional structure. We calculated the net relatedness index (NRI) and the nearest taxon index (NTI) for each fish assemblage by using the functional dendrogram. To obtain the functional dendrogram we assembled a standardized matrix of ecomorphological traits (with zero mean and unit variance) by species and used the function “dist.ktab” in the software R (R Development Core Team, 2011), based on the distance matrix obtained by the generalization of Gower’s distance. We used the unweighted pair-group method using arithmetic averages (UPGMA) clustering method (Pavoine et al., 2009). NRI and NTI were originally described by Webb (2000) for phylogenetic diversity and are considered relevant to represent the functional structure (Hidasi-Neto et al., 2012). We decided to use these indexes because they are based on presence/absence and, therefore, more sensitive to rare species
that are more vulnerable in the degradation context. Positive values of NRI and NTI indicate functional redundancy and negative values indicate functional complementarity. The NRI and NTI correspond, respectively, to the standardized effect size of functional diversity indexes MPD (mean pairwise distance) and MNTD (mean nearest taxon distance) (Webb, 2000), multiplied by -1 and calculated in relation to 1,000 randomly generated communities using an independent swap algorithm, maintaining the observed species richness and occurrence frequency in the null communities (Gotelli & Entsminger, 2001). For this analysis, we used the functions ‘ses.mpd’ and ‘ses.mntd’ in the R (R Development Core Team, 2011) package ‘picante’ (Kembel et al., 2010).
Data analysis. We used a partial regression analysis to relate the landscape and local variables (explanatory variables) with the NRI and NTI (response variables). Prior to the analysis, we standardized the explanatory variables (with zero mean and unit variance). In order to guarantee spatial independence of data (Legendre & Fortin, 1989; Legendre & Legendre, 1998), we evaluated the spatial autocorrelation in the residuals generated in the partial regressions described previously. New partial regressions were carried out using the regression residuals as response variable and the spatial filters as predictor, taking the effect of environmental variables into account. The spatial filters were generated by eigenvector-based spatial filtering approach (Griffith, 2003)
based on a matrix of fluvial distance among all pairs of
sampled reaches. The spatial filters with significant spatial structure as measured by Moran’s I coefficients, at the first distance class, higher than 0.5) were retained. We performed these analyses in the software SAM (Rangel et al., 2010).
Table 2. Codes, calculations and ecological significance of ecomorphological traits related to habitat use. For details of how measurements were taken see Cochran-Biederman & Winemiller (2010). All measurements were taken in millimeters (mm).
Traits Codes Calculation Ecological significance
Relative depth RD Maximum height of the body divided by standard length.
Lower values indicate fishes inhabiting fast waters. It is directly
related to the ability to perform vertical spins (Gatz, 1979).
Index of ventral flattening IVF Middle line height divided by maximum body height.
Low values indicate fishes inhabiting environments with high
hydrodynamism, able to maintain their position even when stationary (Hora, 1930).
Relative area of pectoral fin APF Pectoral fin area divided by body area.
High values indicate slow swimmers, which use pectoral fins to perform maneuvers and breakings, or fish inhabiting fast waters, which use them as airfoils to deflect the water current upwards and thereby, maintain themselves firmly attached to the substrate (Mahon,
1984; Watson & Balon, 1984).
Pectoral fin aspect ratio PFA Maximum length of the pectoral fin
divided by its maximum width.
High values indicate long fins, typical of fish that swim long distances (Watson & Balon, 1984), or pelagic fish that swim
constantly (Casatti & Castro, 2006).
Relative eye position EP
Distance from the middle of the eye to the base of the head, divided by head
height.
Position of eyes is related to vertical habitat preference (Gatz, 1979);
high values indicate dorsally located eyes, typical of benthic fish (Mahon 1984; Watson & Balon, 1984).
Fineness ratio FC
Standard length divided by the square
root of the maximum height of body, multiplied by the maximum body width.
The influence of body shape on the ability to swim; values from 2 to 6 indicate low drag, the optimum ratio for swimming efficiency is 4.5
In order to identify the set of environmental variables that discriminate streams, we used the distance based Redundancy Analysis (dbRDA, as described by Legendre
& Anderson, 1999). In dbRDA, a Principal Coordinate Analysis (PCoA) is used to extract the principal coordinates of a calculated matrix of distances. These principal
coordinates are Euclidean representations of the distances and are suitable for analysis by linear models. Due to this,
and because significance testing is by permutation, there was
no need for an assumption of normality (Anderson, 2006). We conducted dbRDA in the Primer 6 software (Clarke & Gorley, 2006). In the resulting biplot, we identified a posteriori the stream reaches according to NTI values, and informed the most important variables.
Results
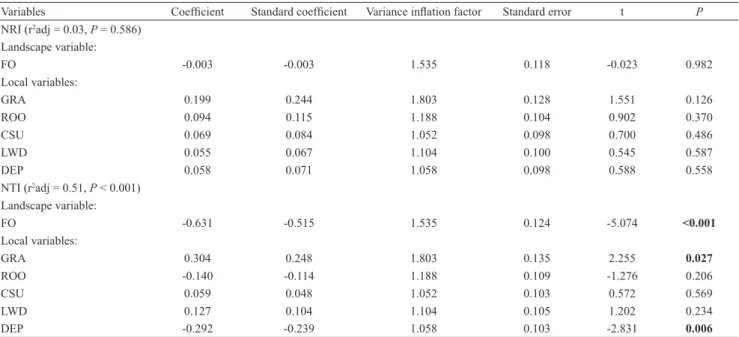
The partial regression with the NRI and NTI showed that explanatory variables only explained the NTI. The variables that significantly explained the NTI were the percentage of forest cover in the watershed, the percentage of grasses in the stream banks, and depth (Table 3), indicating that most of variation in functional diversity can be explained by the combined effects of landscape and local environmental predictors. The residuals from these regressions did not presented spatial structure, since the correlation between spatial filters and regression residuals were non-significant (P > 0.51). This indicates that there was no spatial autocorrelation in our database, which would inflate the type I error.
The first two axes of dbRDA accounted for 51.9% of the explained variation. The coefficients for linear combinations of environmental variables in the formation of dbRDA coordinates indicated that the percentage of forest cover in
the watershed (axis 1 = 1.623, axis 2 = -0.680), the percent of submerged roots in the stream banks (axis 1 = 0.034, axis 2 = -0.008), the percentage of grasses in the stream banks (axis 1 = -0.016, axis 2 = -0.002), and depth (axis 1 = -0.003, axis 2 = 0.056) were the variables that contributed the most
for stream variation.
By pooling the partial regression with the dbRDA results (Fig. 2), it is shown a gradient in which the more complementary communities were located in watersheds with higher proportions of forests. The more redundant communities were located in stream reaches with large amounts of grasses in the stream banks.
Fig. 2. Biplot resulting from the distance based Redundancy Analysis with seven variables (landscape and local). The proportion of forest cover in the watershed, the proportion of grasses in the stream banks, and depth significantly explained the NTI (nearest taxon index) in the studied communities and therefore are represented here. Each community is identified by circles with different sizes according to the NTI values.
Table 3. Results from the partial regression analysis, including NRI and NTI as dependent variables. For variables codes, see Table 1. Bold numbers of P indicate variables that significantly explain the functional indices.
Variables Coefficient Standard coefficient Variance inflation factor Standard error t P
NRI (r2adj = 0.03, P = 0.586)
Landscape variable:
FO -0.003 -0.003 1.535 0.118 -0.023 0.982
Local variables:
GRA 0.199 0.244 1.803 0.128 1.551 0.126
ROO 0.094 0.115 1.188 0.104 0.902 0.370
CSU 0.069 0.084 1.052 0.098 0.700 0.486
LWD 0.055 0.067 1.104 0.100 0.545 0.587
DEP 0.058 0.071 1.058 0.098 0.588 0.558
NTI (r2adj = 0.51, P < 0.001)
Landscape variable:
FO -0.631 -0.515 1.535 0.124 -5.074 <0.001
Local variables:
GRA 0.304 0.248 1.803 0.135 2.255 0.027
ROO -0.140 -0.114 1.188 0.109 -1.276 0.206
CSU 0.059 0.048 1.052 0.103 0.572 0.569
LWD 0.127 0.104 1.104 0.105 1.202 0.234
Discussion
As predicted, stream reaches in the most forested watersheds encompassed the more functionally complementary assemblages regarding fish habitat use. On the contrary, streams with a greater proportion of marginal grasses in stream banks were represented by more redundant assemblages. Therefore, local and landscape features influenced habitat use by stream fish. This relationship was mediated by functional traits, as revealed by the relationship between functional traits and environmental variables, and highlighted the importance of the habitat structure of streams in determining the patterns of functional diversity and composition.
The forest cover, a landscape predictor, was related to the proportion of submerged roots in the stream banks, a local variable. This relationship revealed the hierarchical influence of landscape features on streams habitat structure. In this same vein, the grasses gradient was the opposite of that for forests. Two implications can be inferred from this fact. First, the deforestation in the rio Machado basin has also probably affected the riparian zone. Otherwise, the riparian forests would control the amount of grasses growing in the stream banks (Bunn & Kellaway, 1997), and this variable would be of less importance for stream structure. Second, the deforestation dynamics in the region and the development of pasture for livestock, despite starting in the 1970’s, has been severe enough to promote the functional redundancy of fish communities, as demonstrated here.
The greater complementarity in forested stream reaches can be attributed to the occurrence of species with functionally unique traits, a characteristic of complementary assemblages (Petchey & Gaston, 2002). The occurrence of these species is probably due to the availability of shelter, food resources associated to the riparian vegetation, and litter packs (Carvalho et al., 2013). Accordingly, functionally unique species tend to be lost with the removal of vegetation in the watershed (Devictor et al., 2008). If we assume that functionally unique species perform functions not carried out by other species (Mouillot et al., 2011, 2013), these results suggest that vegetation removal, one of the major threats to biodiversity in the region, could potentially impair ecosystem structure and functioning in streams (Turner, 1996; Laurance et al., 1998).
In our study, the NRI was not explained by the environmental variables, contrary to NTI. To explain such results we must understand the properties of these indexes. NRI is an index more sensitive to species present in deep branches of the dendrogram, i.e., functionally distinct species, whereas the NTI is more sensitive to variations towards the tips of the functional dendrogram (Webb, 2000; Hidasi-Neto et al., 2012). Our results show that communities along the environmental gradient were equally represented by species from different branches of the functional dendrogram (and then NRI did not vary). However, the number of species within each branch varied along the environmental gradient and, thus, they were detected by NTI.
Our results reinforced the need to preserve native forests, not only in the vicinity of streams, but also in the whole watershed because their forest elements can be transported downstream (Ferraz et al., 2005; Galas, 2013). Forest cover in the watershed influences habitat use by fish in streams and, consequently, the overall functional diversity of fish assemblages. The removal of forest can be a severe environmental filter (in the sense of Kraft et al., 2015) because it favors generalist species at the expense of functionally unique species, and therefore increases functional redundancy, at least on a reach scale.
Acknowledgments
ICMBio/SISBIO provided collecting permits (3604-1, 4355-1) and logical support. The “Secretaria de Estado do Desenvolvimento Ambiental” and “Escritório Regional de Gestão Ambiental de Machadinho d’Oeste” allowed us to conduct the surveys in the study areas. Financial funding was provided by “Fundação de Amparo à Pesquisa do Estado de São Paulo” (FAPESP 2010/17494-8). Fellowships were granted to CRB (PIBIC CNPq/UNESP), MAPM (AUIP/PAEDEX/UNESP), GLB (FAPESP 2011/11677-6), FBT (PROBIP/UEG), and LC (CNPq). Fernando R. Carvalho, Francisco Langeani, Bárbara B. Callegari, Fernanda Martins, Ilana Fichberg, Leandro Sousa, Manoela M. F. Marinho; Marcelo Britto, Marcelo Carvalho, and Willian Ohara helped with fish identification. Diogo B. Provete helped with a former revision of the manuscript. Felipe Rossetti de Paula helped with watersheds selection and fieldwork. Fernando R. Carvalho, Mateus Ferrareze, Angelo R. Manzotti, Igor D. Costa, Wesclen Vilar, and Vanessa Bressan helped during fieldwork. We are grateful to Fernando Pelicice, and two anonymous referees for comments and suggestions on the manuscript.
References
Agência Nacional das Águas (ANA). 2009. Inventário das estações fluviométricas. Available from: http://arquivos.ana.gov.br/ infohidrologicas/InventariodasEstacoesFluviometricas.pdf (09/October/2014).
Anderson, M. J. 2006. Distance-based tests for homogeneity of multivariate dispersions. Biometrics, 62: 245-253.
Ballester, M. V. R., D. de C. Victoria, A. V. Krusche, R. Coburn, R. L. Victoria, J. E. Richey, M. G. Logsdon, E. Mayorga & E. Matricardi. 2003. A remote sensing/GIS-based physical template to understand the biogeochemistry of the Ji-Paraná river basin (Western Amazônia). Remote Sensing of Environment, 87: 429-445.
Barragán, F., C. E. Moreno, F. Escobar, G. Halffter & D. Navarrete. 2011. Negative impacts of human land use on dung beetle functional diversity. PLoS ONE, 6: e17976 (p. 1-8). Beaumord, A. C. & M. Petrere Jr. 1994. Comunidades de peces
del rio Manso, Chapada dos Guimarães, MT, Brasil. Acta Biológica Venezuelica, 15: 21-35.
Blake, R. W. 1983. Functional design and burst-and-coast swimming in fishes. Canadian Journal of Zoology, 61: 2491-2494.
Blüthgen, N. & A. M. Klein. 2011. Functional complementarity and specialisation: the role of biodiversity in plant-pollinator interactions. Basic and Applied Ecology, 12: 282-291.
Buckup, P. A., N. A. Menezes & M. S. Ghazzi (Eds.). 2007. Catálogo das espécies de peixes de água doce do Brasil. Rio de Janeiro, Museu Nacional. 195p. (Série Livros, 23). Bunn, S. E., P. M. Davies & D. M. Kellaway. 1997. Contributions
of sugar cane and invasive pasture grass to the aquatic food web of a tropical lowland stream. Marine & Freshwater Research, 48: 173-179.
Calcagnotto, D., S. A. Schaefer & R. DeSalle. 2005. Relationships among characiform fishes inferred from analysis of nuclear and mitochondrial gene sequences. Molecular Phylogenetics and Evolution, 36: 135-153. Carvalho, L. N., L. Fidelis, R. Arruda, A. Galuch & J. Zuanon.
2013. Second f loor, please: the fish fauna of f loating litter banks in Amazonian streams and rivers. Neotropical Ichthyology, 11: 85-94.
Casatti, L. & R. M. C. Castro. 2006. Testing the ecomorphological hypothesis in a headwater riff les fish assemblage of the rio São Francisco, southeastern Brazil. Neotropical Ichthyology, 4: 203-214.
Casatti, L., C. P. Ferreira & F. R. Carvalho. 2009. Grass-dominated stream sites exhibit low fish species diversity and dominance by guppies: an assessment of two tropical pasture river basins. Hydrobiologia, 632: 273-283.
Cianciaruso, M. V., M. A. Batalha & O. L. Petchey. 2013. High loss of plant phylogenetic and functional diversity due to simulated extinctions of pollinators and seed dispersers in a tropical savanna. Natureza & Conservação, 11: 36-42. Clarke, K. R. & R. N. Gorley. 2006. PRIMER v6: User manual/
Tutorial. Plymouth, UK. Plymouth Marine Laboratory. Cochran-Biederman, J. L. & K. O. Winemiller. 2010.
Relationships among habitat, ecomorphology and diets of cichlids in the Bladen River, Belize. Environmental Biology of Fishes, 88: 143-152
Cruz, B. B., L. E. Miranda & M. Cetra. 2013. Links between riparian landcover, instream environment and fish assemblages in headwater streams of south-eastern Brazil. Ecology of Freshwater Fish, 22: 607-616.
Devictor, V., R. Julliard & F. Jiguet. 2008. Distribution of specialist and generalist species along spatial gradients of habitat disturbance and fragmentation. Oikos, 117: 507-514.
Dolédec, S., N. Phillips, M. Scarsbrook, R. H. Riley & C. R. Townsend. 2006. Journal of the North American Benthological Society, 25: 44-60.
Falk, D. A., M. A. Palmer & J. B. Zedler (Eds). 2006. Foundations of restoration ecology. Washington, D.C., Island Press.
Fernandes, L. C. & S. C. P. Guimarães. 2002. Atlas geoambiental de Rondônia. Porto Velho, SEDAM.
Ferraz, S. F. B., C. A. Vettorazzi, D. M. Theobald & M. V. R. Ballester. 2005. Landscape dynamics of Amazonian deforestation between 1984 and 2002 in central Rondônia, Brazil: assessment and future scenarios. Forest Ecology and Management, 204: 67-83.
Flynn, D. F. B., M. Gogol-Prokurat, T. Nogeire, N. Molinari, B. T. Richers, B. B. Lin, N. Simpson, M. M. Mayfield & F. DeClerck. 2009. Loss of functional diversity under land use intensification across multiple taxa. Ecology Letters, 12: 22-33.
Galas, J. 2013. Detritus in small streams of the Tatra mountains - the role of abiotic factors. International Review of Hydrobiology, 98: 199-205.
Gatz, A. J., Jr. 1979. Ecological morphology of freshwater stream fishes. Tulane Studies on Zoology and Botany, 21: 91-124. Goldstein, R. M. & M. R. Meador. 2005. Multilevel assessment of
fish species traits to evaluate habitat degradation in streams of the Upper Midwest. North American Journal of Fisheries Management, 25: 180-194.
Gonçalves Jr., J. F. & M. Callisto. 2013. Organic-matter dynamics in the riparian zone of a tropical headwater stream in Southern Brasil. Aquatic Botany, 109: 8-13.
Gorman, O. T. & J. R. Karr. 1978. Habitat structure and stream fish communities. Ecology, 59: 507-515.
Gotelli, N. J. & G. L. Entsminger. 2001. Swap and fill algorithms in null model analysis: rethinking the Knight’s Tour. Oecologia, 129: 281-291
Griffith, D. A. 2003. Spatial autocorrelation and spatial filtering: gaining understanding through theory and scientific visualization. Springer-Verlag, Berlin Heidelberg.
Hidasi-Neto, J., J. Barlow & M. V. Cianciaruso. 2012. Bird functional diversity and wildfires in the Amazon: the role of forest structure. Animal Conservation, 15: 407-415.
Hora, S. L. 1930. Ecology, bionomics and evolution of the torrential fauna, with special reference to the organs of attachment. Philosophical Transactions of the Royal Society of London, series B, 218: 172-282.
Instituto Nacional de Pesquisas Espaciais (INPE). 2010. Projeto PRODES: Monitoramento da Floresta Amazônica Brasileira por Satélite. Available from: http://www.obt.inpe.br/prodes/ index.html (05 February 2014).
Instituto Nacional de Pesquisas Espaciais (INPE). 2014. Projeto PRODES.Available from: http://www.obt.inpe.br/prodes/ prodes_1988_2013.htm (04 February 2014).
Jensen, J. R. 2000. Introductory digital image processing: a remote sensing perspective. Upper Saddle River, N. J., Prentice Hall. Kembel, S. W., P. D. Cowan, M. R. Helmus, W. K. Cornwell, H. Morlon, D. D. Ackerly, S. P. Blomberg & C. O. Webb. 2010. Picante: R tools for integrating phylogenies and ecology. Bioinformatics, 26: 1463-1464.
Kraft, N. J. B., P. B. Adler, O. Godoy, E. C. James, S. Fuller & J. M. Levine. 2015. Community assembly, coexistence, and the environmental filtering metaphor. Functional Ecology, 29: 592-599.
Krumbein, W. C. & L. L. Sloss. 1963. Stratigraphy and sedimentation. 2nd ed. San Francisco, W. F. Freeman. 660p.
Laurance, W. F., L. V. Ferreira, J. M. Rankin-De Merona & S. G. Laurance. 1998. Rain forest fragmentation and the dynamics of Amazonian tree communities. Ecology, 79: 2032-2040. Legendre, P. & M. J. Anderson. 1999. Distance-based redundancy
analysis: testing multispecies responses in multifactorial ecological experiments. Ecological Monographs, 69: 1-24. Legendre, P. & M. J. Fortin. 1989. Spatial pattern and ecological
analysis. Vegetatio, 80: 107-138.
Legendre, P. & L. Legendre. 1998. Numerical ecology. 2nd ed. Amsterdan, Elsevier. 853p.
Loreau, M. 2004. Does functional redundancy exist? Oikos, 104: 606-611.
Lorion, C. M. & B. P. Kennedy. 2009. Riparian forest buffers mitigate the effects of deforestation on fish assemblages in tropical headwater streams. Ecological Applications, 19: 468-479.
Mahon, R. 1984. Divergent structure in fish taxocenes of north temperate streams. Canadian Journal of Fisheries and Aquatic Sciences, 41: 330-350.
Mouchet, M. A., S. Villéger, N. W. H. Mason & D. Mouillot. 2010. Functional diversity measures: an overview of their redundancy and their ability to discriminate community assembly rules. Functional Ecology, 24: 867-876.
Mouillot, D., D. R. Bellwood, C. Baraloto, J. Chave, R. Galzin, M. Harmelin-Vivien, M. Kulbicki, S. Lavergne, S. Lavorel, N. Mouquet, C. E. T. Paine, J. Renaud & W. Thuiller. 2013. Rare species support vulnerable functions in high-diversity ecosystems. PLoS Biology, 11: e1001569 (p. 1-11).
Mouillot, D., S. Villéger, M. Scherer-Lorenzen & N. W. H. Mason. 2011. Functional structure of biological communities predicts ecosystem multifunctionality. PLoS ONE, 6: e17476 (p. 1-9). Pavoine, S., J. Vallet, A. -B. Dufort, S. Gachet & H. Daniel.
2009. On the challenge of treating various types of variables: application for improving the measurement of functional diversity. Oikos, 118: 391-402.
Petchey, O. L. & K. J. Gaston. 2002. Functional diversity (FD), species richness and community composition. Ecology Letters, 5: 402-411.
Poff, N. L., J. D. Allan, M. B. Bain, J. R. Karr, K. L. Prestegaard, B. D. Richter, R. Sparks & J. C. Stromberg. 1997. The natural flow regime: a paradigm for river conservation and restoration. BioScience, 47: 769-784.
Poole, K. E. & J. A. Downing. 2004. Relationship of declining mussel biodiversity to stream-reach and watershed characteristics in an agricultural landscape. Journal of the North American Benthological Society, 23: 114-125.
R Development Core Team. 2011. R: A language and environment for statistical computing. Viena, Austria, R Foundation for Statistical Computing.
Rangel, T. F., J. A. F. Diniz-Filho & L. M. Bini. 2010. SAM: a comprehensive application for Spatial Analysis in Macroecology. Ecography, 33: 46-50.
Reis, R. E., S. O. Kullander & C. J. Ferraris (Orgs.). 2003. Check list of the freshwater fishes of South and Central America. Porto Alegre, Edipucrs. 729p.
Strahler, A. N. 1957. Quantitative analysis of watershed geomorphology. Transactions of the American Geophysical Union, 38: 913-920.
Teresa, F. B. & L. Casatti. 2012. Influence of forest cover and mesohabitat types on functional and taxonomic diversity of fish communities in Neotropical lowland streams. Ecology of Freshwater Fish, 21: 433-442.
Tilman, D., J. Knops, D. Wedin, P. Reich, M. Ritchie & E. Siemann. 1997. The influence of functional diversity and composition on ecosystem processes. Science, 277: 1300-1302.
Turner, I. M. 1996. Species loss in fragments of tropical rain forest: a review of the evidence. Journal of Applied Ecology, 33: 200-209.
Watson, D. J. & E. K. Balon. 1984. Ecomorphological analysis of fish taxocenes in rainforest streams of northern Borneo. Journal of Fish Biology, 25: 371-384.
Webb, C. O. 2000. Exploring the phylogenetic structure of ecological communities: an example for rain forest trees. The American Naturalist, 156: 145-155.
Appendix. Species registered in the sampled streams, their voucher number and abundances (N). Potamotrygon orbignyi and Synbranchusmarmoratus were not included in the present analysis. Classification follows Reis et al. (2003); except for Serrasalmidae that follows Calcagnotto et al. (2005) and Parauchenipterus porosus that follows Buckup et al. (2007). *Provisionally included in Cheirodon.
Orders and families Species and authors Voucher N
Myliobatiformes
Potamotrygonidae Potamotrygon orbignyi (Castelnau, 1855) DZSJRP 17112 1
Characiformes
Parodontidae Parodon nasus Kner, 1859 DZSJRP 14506 4
Curimatidae Curimatopsis macrolepis (Steindachner, 1876) DZSJRP 16692 6
Cyphocharax plumbeus (Eigenmann & Eigenmann, 1889) DZSJRP 17238 1
Cyphocharax spiluropsis (Eigenmann & Eigenmann, 1889) DZSJRP 16630 40
Steindachnerina cf. dobula (Günther, 1868) DZSJRP 14512 4
Steindachnerina fasciata (Vari & Géry, 1985) DZSJRP 14661 57
Steindachnerina guentheri (Eigenmann & Eigenmann, 1889) DZSJRP 16782 3
Prochilodontidae Prochilodus nigricans Spix & Agassiz, 1829 DZSJRP 16799 1
Anostomidae Anostomus ternetzi Fernández-Yépez, 1949 DZSJRP 14664 5
Leporinus friderici (Block, 1794) DZSJRP 14763 36
Crenuchidae Characidium aff. gomesi Travassos, 1956 DZSJRP 14704 7
Characidium aff. zebra Eigenmann, 1909 DZSJRP 14703 762
Characidium sp. DZSJRP 14335 8
Elachocharax pulcher Myers, 1927 DZSJRP 15057 79
Microcharacidium aff. weitzmani Buckup, 1993 DZSJRP 16653 38
Microcharacidium sp. DZSJRP 14986 50
Melanocharacidium dispilomma Buckup, 1993 DZSJRP 17205 1
Melanocharacidium pectorale Buckup, 1993 DZSJRP 16678 1
Hemiodontidae Hemiodus unimaculatus (Block, 1794) DZSJRP 14672 2
Gasteropelecidae Carnegiella strigata (Günther, 1864) DZSJRP 14886 40
Characidae Amazonspinther dalmata Bührnheim, Carvalho, Malabarba & Weitzman, 2008 DZSJRP 14947 7
Astyanax cf. bimaculatus (Linnaeus, 1758) DZSJRP 14419 108
Astyanax cf. maximus (Steindachner, 1876) DZSJRP 14460 18
Astyanax maculisquamis Garutti & Britski, 1997 DZSJRP 14700 43
Bario steindachneri (Eigenmann, 1893) DZSJRP 15090 3
Brachychalcinus copei (Steindachner, 1822) DZSJRP 14769 147
Bryconella pallidifrons (Fowler, 1946) DZSJRP 14628 695
Bryconops caudomaculatus (Günther, 1864) DZSJRP 17278 912
Bryconops piracolina Wingert & Malabarba, 2011 DZSJRP 16651 23
*Cheirodontroemneri Fowler, 1942 DZSJRP 14668 62
Creagrutus petilus Vari & Harold, 2001 DZSJRP 14733 1021
Hemigrammus aff. ocellifer (Steindachner, 1882) DZSJRP 15009 62
Hemigrammus bellotti (Steindachner, 1882) DZSJRP 14524 152
Hemigrammus melanochrous Fowler, 1913 DZSJRP 15100 1418
Hemigrammus neptunus Zarske & Géry, 2002 DZSJRP 14710 60
Hemigrammus sp. DZSJRP 15101 14
Hyphessobrycon aff. heterorhabdus (Ulrey, 1894) DZSJRP 16929 144
Hyphessobrycon agulha Fowler, 1913 DZSJRP 15103 1131
Orders and families Species and authors Voucher N
Hyphessobrycon copelandi Durbin, 1908 DZSJRP 14673 151
Jupiaba citrina Zanata & Ohara, 2009 DZSJRP 14701 273
Jupiaba poranga Zanata, 1997 DZSJRP 15107 9
Jupiaba zonata (Eigenmann, 1908) DZSJRP 19916 55
Knodus cf. smithi Fowler, 1913 DZSJRP 14715 827
Knodus heteresthes Eigenmann, 1908 DZSJRP 14651 736
Microschemobryconguaporensis Eigenmann, 1915 DZSJRP 14476 166
Moenkhausia aff. gracilima Eigenmann, 1908 DZSJRP 16817 1
Moenkhausia cf. bonita Benine, Castro & Sabino, 2004 DZSJRP 14717 339
Moenkhausiapankilopteryx Bertaco & Lucinda 2006 DZSJRP 14526 60
Moenkhausia collettii (Steindachner, 1882) DZSJRP 14639 1924
Moenkhausia cotinho Eigenmann, 1908 DZSJRP 14478 259
Moenkhausia comma Eigenmann, 1908 DZSJRP 14962 11
Moenkhausia mikia Marinho & Langeani, 2010 DZSJRP 14447 105
Moenkhausia oligolepis (Günther, 1864) DZSJRP 14479 330
Odontostilbe fugitiva Cope, 1870 DZSJRP 14545 307
Phenacogaster retropinnus Lucena & Malabarba, 2010 DZSJRP 14450 386
Serrapinus aff. notomelas (Eigenmann, 1915) DZSJRP 14659 3642
Serrapinnus microdon (Eigenmann, 1915) DZSJRP 14658 1901
Tetragonopterus argenteus Cuvier, 1816 DZSJRP 17040 2
Triportheus angulatus (Spix & Agassiz, 1829) DZSJRP 14456 2
Tyttocharax madeirae Fowler, 1913 DZSJRP 14945 32
Serrasalmidae Myleus sp. DZSJRP 14741 12
Serrasalmusrhombeus (Linnaeus, 1766) DZSJRP 14695 1
Acestrorhynchidae Acestrorhynchusfalcatus (Bloch, 1794) DZSJRP 17072 3
Erythrinidae Erythrinuserythrinus (Bloch & Schneider, 1801) DZSJRP 16650 11
Hoplerythrinusunitaeniatus (Spix & Agassiz, 1829) DZSJRP 16764 3
Hopliasmalabaricus (Bloch, 1794) DZSJRP 14538 88
Lebiasinidae Nannostomustrifasciatus Steindachner, 1876 DZSJRP 14963 1
Pyrrhulina cf. australis Eigenmann & Kennedy, 1903 DZSJRP 14634 193
Pyrrhulina cf. brevis Steindachner, 1876 DZSJRP 15115 65
Pyrrhulina cf. zigzag Zarske & Géry, 1997 DZSJRP 17280 9
Siluriformes
Cetopsidae Denticetopsis seducta (Vari, Ferraris & de Pinna, 2005) DZSJRP 14887 4
Helogenes gouldingi Vari & Ortega, 1986 DZSJRP 15099 22
Aspredinidae Pseudobunocephalus amazonicus (Mees, 1989) DZSJRP 14940 37
Trichomycteridae Ituglanis amazonicus (Steindachner, 1882) DZSJRP 14676 108
Miuroglanis platycephalus Eigenmann & Eigenmann, 1889 DZSJRP 14963 1
Paracanthopoma sp. DZSJRP 14905 19
Callichthyidae Corydorasacutus Cope, 1872 DZSJRP 15023 5
Corydoras aff. ambiacus Cope, 1872 DZSJRP 17229 3
Corydorasbondi Gosline, 1940 DZSJRP 17263 1
Corydoras cf. melanistius Regan, 1912 DZSJRP 15124 55
Corydoras elegans Steindachner, 1876 DZSJRP 14422 7
Corydoras stenocephalus Eigenmann & Allen, 1942 DZSJRP 16757 5
Orders and families Species and authors Voucher N
Hoplosternum littorale (Hancock, 1828) DZSJRP 14423 7
Megalechis picta (Müller & Troschel, 1849) DZSJRP 16753 49
Loricariidae Ancistrus lithurgicus Eigenmann, 1912 DZSJRP 14418 290
Farlowella cf. oxyrryncha (Kner, 1853) DZSJRP 14671 120
Hypostomus pyrineusi (Miranda Ribeiro, 1920) DZSJRP 14424 34
Hypostomus sp. DZSJRP 17290 1
Lasiancistrus schomburgkii (Günther, 1864) DZSJRP 14697 61
Loricaria cataphracta Linnaeus, 1758 DZSJRP 14499 4
Otocinclushoppei Miranda Ribeiro, 1939 DZSJRP 14685 119
Parotocinclus aff. aripuanensis Garavello, 1988 DZSJRP 14895 24
Rineloricariaheteroptera Isbrücker & Nijssen, 1976 DZSJRP 14427 164
Rineloricaria sp. DZSJRP 14635 6
Spatuloricariaevansii (Boulenger, 1892) DZSJRP 14511 4
Squaliforma emarginata (Valenciennes, 1840) DZSJRP 14712 22
Pseudopimelodidae Batrochoglanis cf. raninus (Valenciennes, 1840) DZSJRP 14969 16
Batrochoglanisvillosus (Eigenmann, 1912) DZSJRP 14665 5
Microglanispoecilus Eigenmann, 1912 DZSJRP 16655 1
Heptapteridae Cetopsorhamdia sp. 1 DZSJRP 17295 24
Cetopsorhamdia sp. 2 DZSJRP 17279 8
Cetopsorhamdia sp. 3 DZSJRP 17216 6
Imparfinis cf. hasemani Steindachner, 1917 DZSJRP 14714 124
Imparfinis stictonotus (Fowler, 1940) DZSJRP 14471 49
Phenacorhamdia cf. boliviana (Pearson, 1924) DZSJRP 14688 4
Phenacorhamdia sp. DZSJRP 15019 70
Pimelodella cf. howesi Fowler, 1940 DZSJRP 14656 55
Pimelodella sp. DZSJRP 14527 11
Rhamdia quelen (Quoy & Gaimard, 1824) DZSJRP 14770 6
Doradidae Acanthodoras cataphractus (Linnaeus, 1758) DZSJRP 16687 19
Auchenipteridae Centromochlus cf. perugiae Steindachner, 1882 DZSJRP 17261 1
Parauchenipterus porosus (Eigenmann & Eigenmann, 1888) DZSJRP 17038 5
Tatia aulopygia (Kner, 1858) DZSJRP 14696 2
Gymnotiformes
Gymnotidae Gymnotus aff. arapaima Albert & Crampton, 2001 DZSJRP 14649 26
Gymnotus carapo Linnaeus, 1758 DZSJRP 14648 36
Gymnotus coropinae Hoederman, 1962 DZSJRP 15006 81
Sternopygidae Eigenmannia trilineata López & Castello, 1966 DZSJRP 14406 196
Sternopygus macrurus (Bloch & Schneider, 1801) DZSJRP 14484 97
Rhamphichthyidae Gymnorhamphichthys petiti Géry & Vu-Tân-Tuê, 1964 DZSJRP 14631 287
Hypopomidae Brachyhypopomus sp. 1 DZSJRP 14627 2
Brachyhypopomus sp. 2 DZSJRP 15091 15
Brachyhypopomus sp. 3 DZSJRP 15092 26
Hypopygus lepturus Hoedeman, 1962 DZSJRP 14632 128
Apteronotidae Apteronotus albifrons (Linnaeus, 1766) DZSJRP 14641 6
Platyurosternarchus macrostomus (Günter, 1864) DZSJRP 14690 2
Cyprinodontiformes
Orders and families Species and authors Voucher N
Beloniformes
Belonidae Potamorrhaphis eigenmanni Miranda Ribeiro, 1915 DZSJRP 14949 2
Synbranchiformes
Synbranchidae Synbranchus marmoratus Bloch, 1795 DZSJRP 14485 22
Perciformes
Cichlidae Aequidens tetramerus (Heckel, 1840) DZSJRP 14626 199
Apistogramma cf. resticulosa Kullander, 1980 DZSJRP 14994 563
Cichlasoma amazonarum Kullander, 1983 DZSJRP 14462 46
Crenicichla johanna Heckel, 1840 DZSJRP 14758 2
Crenicichla santosi Ploeg, 1991 DZSJRP 14757 163
Geophagus megasema Heckel, 1840 DZSJRP 15004 1
Satanoperca jurupari (Heckel, 1840) DZSJRP 14636 60