Variation of
Spirulina maxima
biomass production in different depths
of urea-used culture medium
Md-Abu Affan
1,2, Dae-Won Lee
1, Salim Marzoog Al-Harbi
2, Han-Jun Kim
1,
Najah Ibrahim Abdulwassi
3, Soo-Jin Heo
1, Chulhong Oh
1, Heung-Sik Park
1,
Chae Woo Ma
3, Hyeon-Yong Lee
4, Do-Hyung Kang
11
Korea Institute of Ocean Science & Technology, Seoul, Republic of Korea. 2
Department of Marine Biology, King AbdulAziz University, Jeddah, Saudi Arabia. 3
Department of Marine Biotechnology, Soon Chun Hyang University, Asan-si, Republic of Korea. 4
Department of Food Science and Engineering, Seowon University, Cheongju, Chungbuk, Republic of Korea.
Submitted: February 27, 2014; Approved: November 13, 2014.
Abstract
Fewer studies have assessed the outdoor cultivation ofSpirulina maximacompared withS. platensis, although the protein content ofS.maximais higher thanS.platensis.Spirulinagrowth medium re-quires an increased amount of NaHCO3,Na2CO3, and NaNO3, which increases the production cost. Therefore, the current study used a low-cost but high-efficiency biomass production medium (Me-dium M-19) after testing 33 different media. The me(Me-dium depth of 25 cm (group A) was sub-divided into A1 (50% cover with a black curtain (PolyMax, 12 oz ultra-blackout), A2 (25% cover), and A3 (no cover). Similarly the medium depths of 30 and 35 cm were categorized as groups B (B1, B2, and B3) and C (C1, C2, and C3), respectively, and the effects of depth and surface light availability on growth and biomass production were assessed. The highest biomass production was 2.05 g L-1in group A2, which was significantly higher (p < 0.05) than that in all other groups and sub-groups. Spirulina maximadied in B1 and C1 on the fifth day of culture. The biochemical composition of the biomass obtained from A2 cultures, including protein, carbohydrate, lipid, moisture, and ash, was 56.59%, 14.42%, 0.94%, 5.03%, and 23.02%, respectively. Therefore,S.maximacould be grown outdoors with the highest efficiency in urea-enriched medium at a 25-cm medium depth with 25% surface cover or uncovered.
Key words:Spirulina maxima, fertilizer-grade urea, medium depth, surface cover, outdoor mass cul-ture.
Introduction
Spirulina (Arthrospira) includes various species of primitive unicellular blue-green algae, most commonlyS. platensisandS.maxima.Spirulinagrows in shallow and highly alkaline water in tropical areas (Johnston, 1970). The Aztecs have consumedSpirulinain Mexico since the 16thcentury, the first tribe of hunter-collectors used it for food when they found it on margins of lakes, and even to-day, indigenous people consumeSpirulinagrowing in Afri-can lakes. For the last 2-3 decades, millions of people
around the world have enjoyedSpirulinaas a safe food sup-plement.Spirulina is being commercially cultivated as a human food supplement, as an animal feed ingredient, and for pharmaceutical uses because of its ability to produce compounds such as carotene and omega 3 and 6 polyunsat-urated fatty acids (Alonso and Maroto, 2000).Spirulinais also a good source of vitamin B12 with immune-promoting effects and antioxidant activity (Estradaet al., 2001; Xueet al., 2002). There are many advantages of cultivating Spirulinaover traditional agriculture, such as high protein
Brazilian Journal of Microbiology 46, 4, 991-1000 (2015) Copyright © 2015, Sociedade Brasileira de Microbiologia
ISSN 1678-4405 www.sbmicrobiologia.org.br
DOI: http://dx.doi.org/10.1590/S1517-838246420140188
Send correspondence to M.A. Affan. Department of Marine Biology, Faculty of Marine Science, King Abdulaziz University, Jeddah 21589, Saudi Ara-bia. E-mail: [email protected].
biomass, absence of processing by-product discard, suit-ability for arid or semi-arid areas of the world, and the fact thatSpirulinacan be cultured in saline water.
However, there are some disadvantages, mainly due to the mineral costs required to make suitable media for high biomass production. Spirulina is being cultured mostly in Zarrouk’s or modified Zarrouk’s medium or So-ciety of Toxicology (SOT) medium, which are expensive because they require increased amounts of NaHCO3, Na2CO3, NaNO3, and trace metals. Some studies have been conducted using seawater enriched with different minerals (Lamela and Rocha, 2000; Trediciet al., 1986).Spirulina sp. have also been cultured directly in human urine in China and in effluents from pig wastewater treatment plants in Korea (Lun and Cheng, 2006; Hong and Lee, 1993). The Spirulinagrown in saline water is known asS. maximaand has higher protein content than doesS. platensis(Oliveira et al., 1999).There are fewer studies onS. maximathan on S. platensis, especially studies examining outdoor cultiva-tion. In Hawaii,S. pacifica® has been developed from anS. platensisstrain (Cyanotech, Kailua-Kona, HI).
In the present study, anS. maxima scale-up culture was conducted in a medium that was selected after 33 dif-ferent culture media were tested using distilled water, un-derground water (UGW), natural seawater (NSW), and treated natural seawater (TNSW). Thereafter, the highest efficiency biomass production with the lowest cost medium was selected for scale-up mass culture. The best medium among the 33 media was made of urea, soil extract, and other nutrients from SOT medium. Urea appears to be an al-ternative nitrogen source that is less expensive than the conventional nitrogen source nitrate used to growSpirulina sp. The nitrogen of urea is metabolized by cyanobacteria through enzymes such as urease and urea starch lyase (Meekset al., 1983). The two atoms of nitrogen yielded from urea are efficiently assimilated by microalgae (Faintuch and Sato, 1992). Urea levels higher than 300-500 mg L-1 strongly inhibited the growth ofSpirulina in batch culture (Torreet al., 2003). The area with dissolved urea particles becomes a zone of high pH with a higher am-monia concentration, which becomes quite toxic for several hours. At the end of the first step of the study, brokenS. maximatrichomes with fewer coils (3-5 coils) and an am-monia odor were found in some culture jars containing urea-enriched medium. Costaet al. (2001) reported that ammonia or an ammonium complex compound might re-duce the number of trichrome coils.
In addition, the accumulation of ammonia within the cell can occur due to low glutamine synthetase activity at low light intensities because of culture self-shadowing, and the accumulation of ammonia in cells represses urease ac-tivity (Costaet al., 2001). In addition, it is often necessary to shadow the basins to prevent the temperature or light in-tensity becoming too high for the application of outdoor cultures ofSpirulina(Bast, 1986). Therefore, theS.
max-imascale-up culture was performed at different depths and with different surface light availability using the best growth medium to identify the optimum outdoor culture conditions. Finally, the effects of depth and light availabil-ity on specific growth rate, biomass production, biochemi-cal composition, amino acid composition, and mineral content were investigated in culturedS. maxima.
Materials and Methods
Study site and estimate of environmental factors
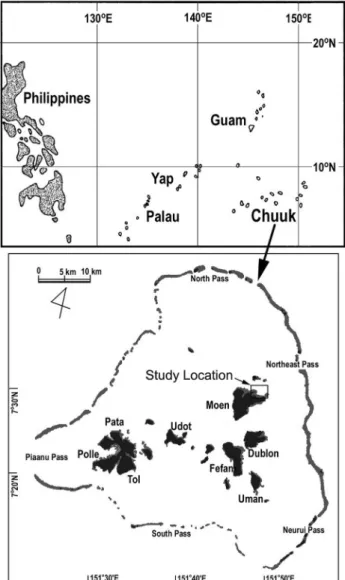
This study was conducted at Chuuk State, which be-longs to the Federated States of Micronesia (7°29’ N, 151°50’ E, Figure 1). The Chuuk climate is warm and tropi-cal, with air temperatures ranging from 26 to 32 °C and wa-ter temperatures of approximately 28 to 30 °C throughout the year. In the first step of the study, 28 of 33 media were made using a soil extract instead of a trace metals solution. A local soil (100 g) was diluted with 1 L of UGW and
heated at 90 °C for 2 h. The soil-diluted turbid water was kept overnight at room temperature, and a 2% supernatant was added with water to create a media with the nutrients described in Table 1. The micronutrient and vitamin solu-tion (Microvitsol) was produced by dilusolu-tion of a solusolu-tion with the following chemical composition: 10.00 mg L-1 H3BO3, 2.00 mg L-1 MnSO4.5H2O, 1.00, mg L-1 ZnSO4.7H2O, 1.00 mg L-1, Co(NO3)2.6H2O, 1.00, mg L-1 Na2MoO4.2H2O, 0.01 mg L-1 CuSO4.5H2O, and 0.0001 mg L-1cyanocobalamin. Then, 1 mL of Microvitsol was added to SOT, M-2, M-4, M-6, and M-20 media, re-spectively. In addition, media from M-21 to M-32 were made using TNSW, which was prepared after pretreating NSW with 8.00 g L-1of NaHCO3. All media were prepared according to the recipes described in Table 1. All of the ma-jor nutrients (NaHCO3, NaNO3, Na2CO3, and K2HPO4) were food grade, and all micronutrients were laboratory grade. Cooking salt (KOOKA iodized cooking salt, Cheetham Salt Ltd, Australia) was used instead of NaCl in M-8 to M-19 media (Table 1).
Spirulina maximawas grown outdoors for 2 weeks in a 10-L transparent plastic jar with two replications (R1 and R2). The biomass, pH, and salinity were measured during inoculation and at the end of the study. Therefore, the sec-ond step of the study was csec-onducted for scale-up based on the highest biomass production with the cheapest medium, which was the M-19 medium. Fiberglass-reinforced plastic tanks (95 x 46 cm) were used with different depths and sur-face covers. The tanks were filled with culture medium at depths of 25, 30, and 35 cm and a black curtain (PolyMax, 12 oz ultra-blackout) was used to cover the surface of the tanks at the rate of 50%, 25%, and 0% or no cover. The tanks with culture medium at a depth of 25 cm (A group) were categorized as A1 (25 cm depth with 50% cover), A2 (25 cm depth with 25% cover), and A3 (25 cm depth with-out cover). Culture tanks with depths of 30 and 35 cm were categorized as groups B (B1, B2, and B3) and C (C1, C2, and C3), respectively. Continuous aeration was supplied to the culture with an aeration pump at a maximum airflow of 3.32 cfm. The light intensity was measured at 0900, 1300, and 1700 with a light meter (Lux/Fc light meter 205, Tenmars Electronics, Taipei, Taiwan). The lux data were converted tommol photons m-2s-1according to the formula described by Clayton (Pierre et al., 2008). Temperature, pH, and salinity were measured with a YSI probe (MPS556, YSI, Inc., Yellow Springs, OH, USA) every other day when samples were collected for estimating bio-mass.
Determination of specific growth and biomass production
The culture medium pH was maintained for 12 h after adjusting the initial pH to 7.5 by adding NaOH or HCl. Ap-proximately 0.015 g L-1(dry weight)S. maximawas inocu-lated and grown for 16 days. A 20-mL sample was collected
from each culture tank every other day to estimate the bio-mass. The sample was filtered through preweighed GF/F Whatman filter paper. A preweighed filter paper that was soaked in distilled water and dried at the same time was used as a blank. The biomass filter paper was kept at 55 °C in an oven, dried and weighed, and the dry weight biomass was calculated as g L-1, which was plotted as a growth curve. The specific growth rate (m) was defined as the in-crease in biomass per unit time and calculated using the fol-lowing formula (Pirt, 1975).
m( )
ln
day- = æ è çç öø÷÷
-1 1 0 1 0 X X t t
whereX0andX1are the biomass at the beginning (t0) and the end (t1) of a selected time interval between inoculation and maximum biomass production.
Microscopic observation
Contamination with other plankton (phytoplankton or zooplankton) and the number of coils in an S. maxima trichome were observed under an inverted light microscope (Olympus, CKX41, Tokyo, Japan). A 10-mL sample was collected at the end of the study; 4 to 6 drops of live sample were gently put on a glass slide and mixed properly, and 2 to 3 drops were covered with a cover slip. The presence of contaminants was then assessed at 400x magnification. Broken and lysed trichomes with fewer coils were found in some cultures in urea-enriched media in the first step of the study. Therefore, the number of coils in trichomes was counted in outdoor cultures to assess the variation among the culture conditions. For counting the number of coils, 1 mL of sample was placed on a Sedgwick-Rafter counter chamber, and the number of coils was counted for 50 ran-domly selected trichomes in each culture. Finally, the entire biomass was collected after filtering through a 20-mm mesh plankton net and was freeze dried for further study.
Biochemical composition
The biomass from the best growth condition was se-lected for biochemical composition analysis, and carbohy-drate, protein, lipid, moisture, and ash contents were determined following the methods of the Association of Official Analytical Chemists AOAC (1995). Crude lipid was determined by Soxhlet extraction; crude protein, by the Kjeldahl method; ash, by calcinations in a furnace at 550 °C; and moisture by heating to 105 °C for 20 h.
Amino acid composition was determined following the AOAC method. Briefly, a 10-g sample was dehydrated with acetone and dried on filter paper at 60 °C in a drying oven. The dried materials were hydrolyzed in 6 N HCl for 24 h at 110 °C. After cooling, the samples were washed with 0.01 N HCl, and 2 N NaOH was added for neutraliza-tion. Supernatants were collected by centrifugation at 5,000 rpm for 30 min. The supernatants were evaporated
Affan
et
al.
the 1 step of experiment.
No. NaHCO3 Na2CO3 K2HPO4 K2SO4 MgSO4.7H2O FeSO4.7H2O Na2-EDTA NaNO3 Urea NaCl Cooking salt CaCl2.2H2O Microvit sol SE Water Biomass
SOT 13.61 4.03 0.50 1.00 0.20 0.01 0.08 2.50 NA 1.00 NA 0.04 * NA DW 2.35±0.04
M-1 13.61 4.03 0.50 1.00 0.20 0.01 0.08 2.50 NA 1.00 NA NA NA * DW 2.32±0.06
M-2 13.61 4.03 0.50 1.00 0.20 0.01 0.08 2.50 NA 1.00 NA 0.04 * NA UG 2.29±0.02
M-3 13.61 4.03 0.50 1.00 0.20 0.01 0.08 2.50 NA 1.00 NA NA NA * UG 2.31±0.02
M-4 13.61 4.03 0.50 1.00 0.20 0.01 0.08 NA 2.50 1.00 NA 0.04 * NA DW 2.250.13
M-5 13.61 4.03 0.50 1.00 0.20 0.01 0.08 NA 2.50 1.00 NA NA NA * DW 2.27±0.04
M-6 13.61 4.03 0.50 1.00 0.20 0.01 0.08 NA 2.50 1.00 NA 0.04 * NA UG 2.28±0.02
M-7 13.61 4.03 0.50 1.00 0.20 0.01 0.08 NA 2.50 1.00 NA NA NA * UG 2.24±0.03
M-8 5.00 3.00 0.50 1.00 0.20 0.01 0.08 2.50 NA NA 1.50 NA NA * UG 1.81±0.09
M-9 5.00 2.00 0.50 1.00 0.20 0.01 0.08 2.50 NA NA 1.50 NA NA * UG 1.79±0.03
M-10 5.00 1.00 0.50 1.00 0.20 0.01 0.08 2.50 NA NA 1.50 NA NA * UG 1.76±0.02
M-11 5.00 3.00 0.50 1.00 0.20 0.01 0.08 NA 2.50 NA 1.50 NA NA * UG 1.95±0.04
M-12 5.00 2.00 0.50 1.00 0.20 0.01 0.08 NA 2.50 NA 1.50 NA NA * UG 1.68±0.07
M-13 5.00 1.00 0.50 1.00 0.20 0.01 0.08 NA 2.50 NA 1.50 NA NA * UG 1.74±0.08
M-14 6.00 3.00 0.50 1.00 0.20 0.01 0.08 2.50 NA NA 1.50 NA NA * UG 1.89±0.03
M-15 6.00 2.00 0.50 1.00 0.20 0.01 0.08 2.50 NA NA 1.50 Na NA * UG 1.79±0.11
M-16 6.00 1.00 0.50 1.00 0.20 0.01 0.08 2.50 NA NA 1.50 NA NA * UG 1.74±0.08
M-17 6.00 3.00 0.50 1.00 0.20 0.01 0.08 NA 2.50 NA 1.50 NA NA * UG 1.98±0.01
M-18 6.00 2.00 0.50 1.00 0.20 0.01 0.08 NA 2.50 NA 1.50 NA NA * UG 2.01±0.03
M-19 6.00 1.00 0.50 1.00 0.20 0.01 0.08 NA 2.50 NA 1.50 NA NA * UG 2.03±0.02
M-20 13.61 4.03 0.50 1.00 0.20 0.01 0.08 2.50 NA NA NA NA * NA TNS X
M-21 5.00 3.00 0.50 1.00 0.20 0.01 0.08 2.50 NA NA NA NA NA * UG:TNS (1:1) 0.95±0.03
M-22 5.00 2.00 0.50 1.00 0.20 0.01 0.08 2.50 NA NA NA NA NA * UG:TNS (1:1) 1.02±0.07
M-23 5.00 1.00 0.50 1.00 0.20 0.01 0.08 2.50 NA NA NA NA NA * UG:TNS (1:1) 0.98±0.19
M-24 5.00 3.00 0.50 1.00 0.20 0.01 0.08 NA 2.50 NA NA NA NA * UG:TNS (1:1) 0.86±0.03
M-25 5.00 2.00 0.50 1.00 0.20 0.01 0.08 NA 2.50 NA NA NA NA * UG:TNS (1:1) 0.90±0.08
M-26 5.00 1.00 0.50 1.00 0.20 0.01 0.08 NA 2.50 NA NA NA NA * UG:TNS (1:1) 0.89±0.02
M-27 6.00 3.00 0.50 1.00 0.20 0.01 0.08 2.50 NA NA NA NA NA * UG:TNS (1:1) 0.82±0.03
M-28 6.00 2.00 0.50 1.00 0.20 0.01 0.08 2.50 NA NA NA NA NA * UG:TNS (1:1) 0.89±0.02
M-29 6.00 1.00 0.50 1.00 0.20 0.01 0.08 2.50 NA NA NA NA NA * UG:TNS (1:1) 0.85±0.01
M-30 6.00 3.00 0.50 1.00 0.20 0.01 0.08 NA 2.50 NA NA NA NA * UG:TNS (1:1) 0.68±0.02
M-31 6.00 2.00 0.50 1.00 0.20 0.01 0.08 NA 2.50 NA NA NA NA * UG:TNS (1:1) 0.75±0.05
M-32 6.00 1.00 0.50 1.00 0.20 0.01 0.08 NA 2.50 NA NA NA NA * UG:TNS (1:1) 0.72±0.09
with nitrogen gas at 60 °C and dissolved with 0.02 N HCl. The samples were filtered with a 0.45-mm filter and ana-lyzed on a Beckman 6300 automated amino acid analyzer (Beckman Coulter, Fullerton, CA, USA). Areas of amino acid standards were used to calculate the quantity of each amino acid in the samples. Mineral content was also deter-mined by AOAC methods using an inductively coupled spectrometer (Perkin Elmer Instruments, Shelton, CT, USA).Spirulina maximawas ashed at 550 °C for 6 h. The ash was dissolved in HNO3, filtered, and diluted with dis-tilled water. Thereafter, the absorbance of the sample was read directly on the spectrometer.
Statistical analysis
The mean values of each treatment for temperature, pH, salinity, light intensity, specific growth, and biomass production were compared using one-way analysis of vari-ance (ANOVA) followed by Tukey’s test. A P-value of < 0.05 was considered to be significant. All statistical anal-yses were performed using SPSS Statistical Software, ver-sion 12.0, 12.0.1 (Edinburgh, Scotland).
Results
Dynamics of environmental factors
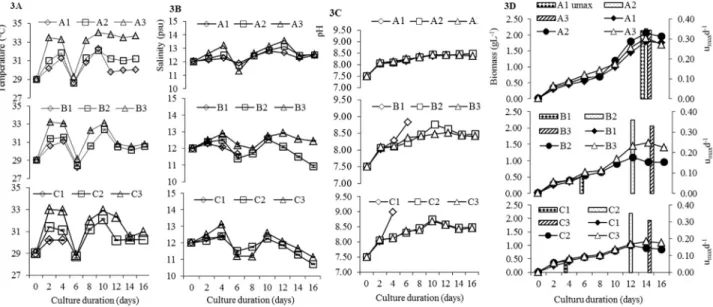
During the study, the sunlight intensity varied from 479 to 2,492, 429 to 3,300, and 182 to 660mmol photon m-2s-1at 0900, 1,300, and 1,700, respectively, with the peak at 1,300 on the sixth and eighth days of the study (Figure 2). The temperature ranged from 28.20 to 34.00 °C, with an av-erage of 30.62 °C. The highest temperature was in tank A3, and the lowest was in C1 tank (Figures 3A). The tempera-ture was highest in the uncovered tanks, followed by the 25% and 50% covered tanks. Salinity fluctuated from 10.72 to 13.56 psu, and the highest salinity was in tank A3 (Figure
3B). The pH varied from 7.50 to 8.49 in the A group tanks, with the highest pH in A2, followed by A1 and A3; in the B and C group tanks, the pH values were 8.76 and 8.74 in B2 and C2, respectively, although B1 and C1 had the highest pHs of 8.98 and 8.83, respectively, during culture die-off (Figures 3C).
Specific growth rate and biomass production
The maximum specific growth rate (mmaxd-1) was es-timated as an informative way to ascertain microbial ac-tivity, which can increase at exponential rates. Significant biological information onSpirulinamass culture can be obtained by determining growth characteristics under controlled conditions, and this information can then be ap-plied to create a high-density mass-culture system. The mmax d-1of S. maximavaried from 0.34 to 0.35, 0.33 to 0.36, and 0.31 to 0.35 d-1among the A, B, and C culture groups, respectively; the highestmmaxd-1was in B2 (Fig-ure 3D).Spirulina maximagrew well in the entire A group tanks; biomass production varied from 1.80 to 2.05 g L-1 and was highest in A2, followed by A3 and A1 (Figure 3D). In the B group tanks, the biomass production ranged from 0.55 to 1.55 g L-1, with the highest value in B3, fol-lowed by B2 (Figure 3D). In the C group tanks, the highest biomass was 1.15 g L-1in C3 (Figure 3D). Among all nine culture conditions, A2 had the highestS. maximabiomass production.
Microscopic observation
Microscopic observations were performed to confirm the presence of other plankton in the culture and to count the numbers of trichomes coils ofS. maxima. Microscopic observation of anS. maximalive sample revealed that the culture was a monostrain at the end of the study. The coil numbers in trichomes varied from 5 to 14 in the A culture
S. maximaculture in urea medium 995
group, with the maximum number in A2, and average coil
numbers of 8.15±1.60, 8.70±2.30, and 7.75±1.52 in A1, A2, and A3, respectively. Four to six coils were observed in the B group tanks, with the maximum number found in B3
(6.42±0.15), followed by average values of 5.18±1.1 in B2. In the C group tanks, there were 4 to 5 coils with aver-ages of 4.29±0.93 and 4.48±1.53 in C2 and C3, respec-tively (Figure 4).
Biochemical and amino acid composition and mineral content
In the present study, theS. maximabiochemical com-position was as follows: protein 56.59%, carbohydrate 14.42%, lipid 0.94%, moisture 5.03%, and ash 23.02% on a dry weight basis in the biomass of the A2 culture tank. Ten essential amino acids (threonine, valine, methionine, iso-leucine, tyrosine, phenylalanine, lysine, histidine, trypto-phan, and arginine) made up 5.26, 6.63, 1.37, 5.94, 4.57,
Figure 3- (3A) Variation of temperature (°C) at depths of 25, 30, and 35 cm with 50, 25, and 0% surface shadow in theS. maximaculture FRP tanks. Cul-ture tank conditions: A1 (25-cm depth with 50% surface shadow), A2 (25-cm depth with 25% surface shadow), and A3 (25-cm depth with 0% surface shadow). The covers of B (30-cm depth) and C (35-cm depth) were identical to those of A. (3B) Variation in salinity, (3C) variation in pH during different
S. maximaculture conditions, and (3D) variation in maximum specific growth rate (mmax, indicated in bars) and growth curve with biomass production (g
L-1, indicated in lines) ofS. maximaat different depths and surface shadow cover. Values are mean±SE.
5.03, 5.26, 1.6, 0.07, and 6.86% of theS. maximabiomass, respectively, while eight nonessential amino acids (aspartic acid, serine, glutamic acid, proline, glycine, alanine, cystine, and leucine) made up 9.83, 5.03, 15.08, 3.43, 5.48, 8.23, 0.27, and 9.83%, respectively (Figure 5). Analysis of mineral content revealed that the Na, K, Fe, Mg, Ca, Mn, Zn, and P contents were 65.80, 24.26, 5.34, 3.52 2.38, 0.03, 0.01, and 13.31 mg 100 g-1, respectively (Figure 6).
Discussion
Effects of environmental factors
Spirulina maxima grew well in all tanks of the A group with different biomasses. Meteorological factors had a large influence on the growth ofS. maxima, especially cloudy sky and rainfall in the outdoor mass culture in urea nitrogen medium. On the fourth and fifth days of the study, the sky was cloudy and there was heavy rain. During rainy days, the sunlight intensity decreased to the same intensity as that at 1,700 on a sunny day. The water depth in all of the tanks increased 3-5 cm due to rain, and the salinity and tem-perature of each tank decreased approximately 1.00 psu and 3 °C, respectively. The 35-cm deep tanks increased to 38 to 41 cm. On rainy days, a strong ammonia odor came from the 30- to 35-cm-deep tanks with 50% surface covers, and higher pH values (8.98 and 8.83 in B1 and C1) were ob-served in those tanks. A weak ammonia odor came from the tanks with depths greater than 30 cm with a 25% surface cover or uncovered. TheS. maximaculture died in the tanks in which the ammonia odor was very strong. Urea was partly hydrolyzed to ammonia under alkaline conditions and lost by off gassing (Costaet al., 2001). Total ammonia in aqueous solution consists of two principal forms, the am-monium ion (NH4+) and un-ionized ammonia (NH3). The
form depends on the pH, with ammonium (NH4+) predominating when the pH is below 8.75 and ammonia (NH3) predominating above pH 9.75 (Hydrolab, a Hatch Company). In addition, optimum activity of urease proba-bly occurs in the pH range of 7 to 9, with little activity above a pH of 9.5 (Bast, 1986). Accumulation of ammonia within the cell can occur due to low glutamine synthetase activity at low light intensity because of self-shadowing of cultures, and accumulation of ammonia in cells represses urease activity (Costaet al., 2001). NH3is quite toxic to seeds or plantlets because it is uncharged and lipid-soluble (AOAC, 1995), and thus traverses biological membranes more readily than the charged and hydrated NH4+ ions (Swigert, 1984; Wuhrmann and Woker, 1948). Therefore, it was assumed that theS. maximadied as a result of the am-monia derived from urea because of less light availability due to a cloudy sky, less surface area exposed to light due to the covers, or less light penetration due to greater depths. Additionally, the ammonia concentration increased due to weak mixing at increased depths during rainy days.
Specific growth rate and biomass production
Except for theSpirulina die-off tanks, the specific growth rate ofS. maximashowed no significant (p < 0.05) differences among tanks of the A group. Biomass produc-tion was significantly higher (p < 0.05) in the A2 among group as well as in all culture group tanks. Themmaxd-1and biomass production ofS. maximain this study were low in comparison with that in the SOT medium in whichmmaxwas 0.40 d-1and 2.70 g L-1maximum biomass production ofS. maxima(Trediciet al., 1986; Oliveiraet al., 1999). Oliveira et al.(1999) reported thatS. maximagrowth rate and bio-mass production were 0.45 d-1and 2.40 g L-1at 35 °C, re-spectively, under a continuous light condition in a Paoletti
S. maximaculture in urea medium 997
medium (Downing and Merkens, 1955). The biomass pro-duction was significantly (p > 0.05) higher in B3 than C3 in tanks from groups B and C, respectively. However, theS. maximaproduction differed with variation in the surface cover in M-19 culture medium at the same depth. Biomass production from the A2 tanks was higher than the biomass production ofS. platensisin urea using Zarrouk’s medium, in which the biomass was 0.91 g L-1in a microenvironment culture condition (Costaet al., 2001) or urea-fed batch cul-tured biomass (Costaet al., 2001). In most published stud-ies, urea was used in culture media having a pH of 9.0 or above which is the alkaline condition triggering NH3 for-mation rather than NH4+and decreasing or stopping urease activity, as discussed above (Costaet al., 2001; Sánchez-Lunaet al., 2006; Sánchez-Lunaet al., 2004; Abeliovich and Azov, 1976). In the A culture group, pH did not exceed 8.5, which might be the optimum condition in which to use urea forS. maximagrowth.
Biomass production ofS. maximain M-19 medium is economically more viable, as the price of the chemicals is lower than that of Zarrouk’s, SOT, or Paolett medium. Moreover, the culture system will also be effective to grow S. maximaunder natural light conditions, as urea uptake by microalgae is greater in the light than in the dark (Stanca and Popovici, 1996). Therefore, a 25-cm culture medium depth with a surface cover of 50%, 25%, or 0% in regular sunlight will be a suitable condition forS. maximagrowth in M-19 culture medium.
Microscopic observation
The presence of other plankton in the culture can cre-ate competition for nutrients or can be toxic if the contami-nant species is toxic, like toxic cyanobacteria. In this study, the culture was contaminant-free. A culture medium
pre-pared with 1.5% table salt using UGW protects the Spirulinafrom contamination with other plankton (Hodson and Thompson, 1968). Microscopic observation of a S. maximalive sample revealed that the culture was a mono-strain at the end of the experiment. The number of coils in the trichomes varied among the A, B and C culture groups. There were more coils in the A group tanks than in the B and C group tanks, and the number of coils in the C tanks was almost half that in the A tanks. Short and brokenS. maximatrichomes were found in tanks with a higher pH and an ammonia odor. The occurrence of ammonia in asso-ciation with higher pH might have an adverse effect on the coils formation in trichomes. Similarly, Costaet al.(2001) found broken trichomes and lysedS. platensiscells in a cul-ture medium composed of 0.01 M ammonium acid phos-phate.
Biochemical and amino acid composition and mineral content
Information on the biochemical composition of Spirulinasp. grown under specific culture conditions is im-portant for profitable commercial production, as the chemi-cal composition may differ with variations in the physico-chemical conditions of the culture system. For ex-ample,S. maximaprotein content was 70.24, 68.01, 68.67, 64.58, and 62.81% at temperatures of 20, 25, 30, 35, and 40 °C, respectively (Oliveiraet al., 1999). Low protein syn-thesis and high carbohydrate content were found inS. max-imagrown in seawater due to physiological stress (Lamela and Rocha, 2000). In our study, the protein and carbohy-drate content of S. maxima also showed similar results, which might have been related to the use of cooking salt containing 50 mg g-1potassium iodate as well as other un-specified contents rather than NaCl alone.
Protein content and amino acid composition also var-ied inS. platensis(Kimet al.,2007).The amino acid analy-sis revealed that leucine was proportionally the highest (9.83%), followed by arginine, valine, and isoleucine. Leucine is very important for health, as it is used for growth and repair of muscle tissue. It also helps to prevent muscle protein breakdown. Additionally, leucine is directly linked to the maintenance of glucose homeostasis by enhancing glucose recycling via the glucose-alanine cycle and is di-rectly linked to the translational regulation of muscle pro-tein synthesis through the insulin signaling cascade (Volkmannet al., 2008). Similarly, the non-amino acidS. maximaanalysis showed that glutamic acid was 15.08%, followed by aspartic acid and alanine. Glutamic acid is a precursor of gamma-aminobutyric acid, which functions as an inhibitory neurotransmitter. It is one of the few nutrients that crosses the blood-brain barrier, and it is the only means by which ammonia in the brain can be detoxified. It is con-sidered nature’s “brain food” due to its association with im-proved mental capacity. Therefore, more leucine and glutamic acid can be obtained fromS. maximausing this culture methodology. Among theS. maximaminerals, the amount of potassium was second highest in ranking. High potassium diets are beneficial for protecting against cardio-vascular disease partly because of their blood-pressure-lowering effect. Low blood pressure, decreased renal tubu-lointerstitial injury, and suppressed renal inflammation were observed in male Sprague-Dawley rats after 8 weeks of feeding a potassium-supplemented diet (2.1% potas-sium) (Layman, 2003). Thus, abundant potassium can be obtained fromS. maximaas a dietary source.
Conclusions
Spirulina maximagrew well at a depth of 25 cm in M-19 medium consisting of urea, soil extracts, and other chemicals. The highest biomass production was 2.05 g L-1 at a depth of 25 cm in a tank with 25% surface cover. In terms of quality, the protein content and amino acid compo-sition were remarkable as regards to reported study else-where. Moreover, cost-wise calculations suggest that the preparation of 1,000 L of SOT medium would cost KRW 164205 ($147 USD), compared with KRW 61093 ($55 USD) for M-19 medium. In addition to this low cost, M-19 medium also yields highS. maximaproduction. In contrast, less light availability due to medium depth (> 30 cm) or me-teorological conditions might have stimulated the forma-tion of unionized ammonia (NH3), which might have been responsible for breaking, whitening trichomes and the death ofS. maxima. Therefore, outdoor mass culture ofS. maximaat a 25-cm depth in M-19 medium is suitable and profitable for home consumption and/or industrial-scale production, as most of the major ingredients were low-cost and locally available.
Acknowledgments
We are particularly grateful to the staff of the Depart-ment of Marine Resources in Chuuk State, Federated States of Micronesia (FSM), for allowing us to perform mass cul-tures in FSM. This work was supported by grants from the Korea Institute of Ocean Science and Technology (PE99213 and PE99234) and the Marine Biotechnology Program Funded by Ministry of Oceans and Fisheries, Ko-rea (PM57770). In addition, this study was supported in part by King Abdulaziz University for writing research arti-cles.
References
Abeliovich A, Azov Y (1976) Toxicity of ammonia to algae in sewage oxidation pounds. Appl Environ Microbiol 31:801-806.
Alonso D, Maroto F (2000) Plants as `chemical factories’ for the production of polyunsaturated fatty acids. Biotechnol Ad-vances 18:481-497.
AOAC (1995) Official Methods of Analysis. 17th ed. Association of Official Analytical Chemists International, Arlington, Virginia, chapter 4, pp. 1-30.
Bast E (1986) Urease formation in purple sulfur bacteria (Chro-matiaceae) grown on various nitrogen sources. Arch Microbiol 146:199-203.
Clayton RK (1970) Light and living matter, vol. 1: The physical part. McGraw-Hill Book Co., New York.
Costa JAV, Cozza KL, Oliveira Let al.(2001) Different nitrogen source and growth responses ofSpirulina platensisin micro-environments. World J Microbiol Biotechnol 17:439-442. Costa JAV, Cozza KL, Oliveira Let al.(2001) Different nitrogen
source and growth responses ofSpirulina platensisin micro-environments. World J Microbiol Biotechnol 17:439-442. Downing KM, Merkens JC (1955) The influence of dissolved
ox-ygen concentrations on the toxicity of un-ionised ammonia to rainbow trout (Salmo gairdneriiRichardson). Ann Appl Biol 43:243-246.
Estrada JEP, Bescós PB, Fresno AMV (2001) Antioxidant activ-ity of different fractions ofSpirulina platensisprotein ex-tract. II Farmaco 56:497-500.
Faintuch BL, Sato S (1992) Aquarone E, Emprego de Algumas Fortes Nitrogenadas na Obtengcao de Biomassa de
Oscillatoria limnetica. Revista de Microbologia 23:32-36. Ferraz CAM, Aquarone E, Krauter M (1985) Efeito da luz e do pH
no crescimento de Spirulina maxima. Rev Microbiol 16:132-137.
Hodson RC, Thompson JF (1968) Metabolism of urea by
Chlorella vulgaris. Plant Physiol 44:691-696.
Hong SS, Lee NH (1993) Growth of Spirulina platensis in effluents from wastewater treatment plant of pig farm. J Microbiol Biotechnol 3:19-23.
Johnston HW (1970) The biological and economic importance of algae, Part 3. Edible algae of fresh and brackish waters. Tuatara 18:19-34.
Kim CJ, Jung YH, Ko SRet al.(2007) Raceway cultivation of
Spirulina platensisusing underground water. J Microbiol Biotechnol 17:853-857.
Lamela T, Rocha MJF (2000) Phycocyanin production in seawa-ter culture of Arthospira maxima. Ciencias marinas 26:607-619.
Layman DK (2003) The role of leucine in weight loss diets and glucose homeostasis. JN 133:261-267.
Lun FD, Cheng WZ (2006) Culture ofSpirulina platensisin hu-man urine for biomass production and O2evolution. J ZUS B
7:34-37.
Meeks JC, Wycoff KL, Chapman JSet al.(1983) Regulation of expression of nitrate and dinitrogen assimilation by
Anabaenaspecies. App Environmental Microbiol
45:1351-1359.
Oliveira ACLD, Monteiro MPC, Robbs PGet al.(1999) Growth and chemical composition of Spirulina maxima and
Spirulina platensis biomass at different temperatures.
Aquacul Int 7:261-275.
Pirt SJ (1975) Principles of microbe and cell cultivation. Blackwell Scientific Publications, Oxford, 244 pp. Sánchez-Luna LD, Bezerra RP, Matsudo MCet al.(2006)
Influ-ence of pH, temperature, and urea molar flowrate on
Arthrospira platensis fed-batch cultivation: a kinetic and thermodynamic approach. Biotch Bioeng 96:702-711. Sánchez-Luna LD, Converti A, Tonini GCet al.(2004)
Continu-ous and pulse feedings of urea as a nitrogen source in fed-batch cultivation of Spirulina platensis. Aquacultural Eng 31:237-245.
Stanca D, Popovici E (1996) Urea as nitrogen source in modified Zarrouk medium. Rev Roum Biol 41:25-31.
Swigert JP (1984) The influence of NH3, NH4+ and pH gradients on accumulation of ammonia in blood of channel catfish
Ictalurus punctatus. Doctoral dissertation, Purdu Univer-sity, West Lafaette, Indiana, USA.
Torre P, Sassano CEN, Sato Set al.(2003) Fed-batch addition of urea forSpirulina platensiscultivation-thermodynamics and material and energy balances. Enzyme Microb Technol 33:698-707.
Tredici MR, Papuzzo T, Tomaselli L (1986) Ourdoor mass culture
of Spirulina maxima in seawater. Appl Microbiol
Biotechnol 24:47-50.
Volkmann H, Imianovsky U, Oliveira JLBet al.(2008) Culture of
Arthrospira(Spirulina)platensisin desalinator wastewater and salinated synthetic medium: protein content and amino-acid profile. Braz J Microbiol 39:98-101.
Wang W, Soltero L, Zhang Pet al.(2007) Renal inflammation is modulated by potassium in chronic kidney disease: possible role of Smad7. Am J Physiol Renal Physiol 293:1123-1130. Wuhrmann K, Woker H (1948) Beiträge zur Toxikologie der
Fische. II. Experimentelle Untersuchungen über die Ammoniak- und Blausäure vergiftung. Schweiz. Z Hydrol 11:210-244.
Xue C, Hu Y, Saito Het al.(2002) Molecular species composition of glycolipids from Sprirulina platensis. Food Chem 77:9-13.
Associate Editor: Lara Durães Sette