481
Vol.53, n. 2: pp. 481-486, March-April 2010
ISSN 1516-8913 Printed in Brazil BRAZILIAN ARCHIVES OF
BIOLOGY AND TECHNOLOGY
A N I N T E R N A T I O N A L J O U R N A L
Catechol
Biodegradation
kinetics
Using
Candida
parapsilopsis
Maurício Rigo
1*,
Ranulfo Monte Alegre
2, José Raniere Mazile Vidal Bezerra
1, Narjara
Coelho
1and Reinaldo Gaspar Bastos
11Departamento de Engenharia de Alimentos;Universidade Estadual do Centro-Oeste; Rua Simeão Camargo Varela
de Sá, 03; 85040-080; Guarapuava - PR - Brasil. 2Faculdade de Engenharia de Alimentos;Universidade Estadual de Campinas; C. P.: 6121; 13083-970; Campinas - SP - Brasil
ABSTRACT
This study evaluated the biodegradation of catechol by a yeast strain of Candida parapsilopsis in standard medium in Erlenmeyer flasks. Results shown that the highest concentration of catechol caused the longer lag period, demonstrating that acclimatized cultures could completely degrade an initial catechol concentration of 910 mg/L within 48 h. Haldane’s model validated the experimental data adequately for growth kinetics over the studied catechol concentration ranges of 36 to 910 mg/L. The constants obtained for this model were µmax = 0.246 h-1, Ks =
16.95 mg/L and Ki = 604.85 mg/L.
Key words: Candida parapsilopsis; Biodegradation; Catechol; Growth kinetics; Equation of Haldane; Substrate
inhibition
*Author for correspondence:[email protected]
INTRODUCTION
Wastewater from coal conversion processes, petroleum refineries, manufacture of pharmaceuticals, fertilizer and dyes contain phenolics compounds, which represent a serious ecological problem due to their widespread use, toxicity and occurrence throughout the environment (Godjevargova et al., 2000; Marek et al., 2001; Jindrová et al., 2002). Biological treatment process is generally used to degrade these substances and have usually been carried out through aerobic process. However, phenol has high inhibitory and antibacterial activity influence on cells. It acts as a membrane-actived agent, which increases the permeability of the
cytoplasmac membrane and causes a leakage of cytoplasmic material. Little information about the use of yeast cultures grown on phenolic compounds is found in the literature (Páca et al.,
2002; Ruiz-Ordaz et al., 1998; Komarkova et al.,
degradation and treatment operation processes. There are several studies related to phenolics compounds degradation as summarized in Table 1. The main aim of this work was to select a strain
that degraded catechol under high concentrations in order to generate kinetics experimental data describing the growth of this culture on catechol in batch experiments.
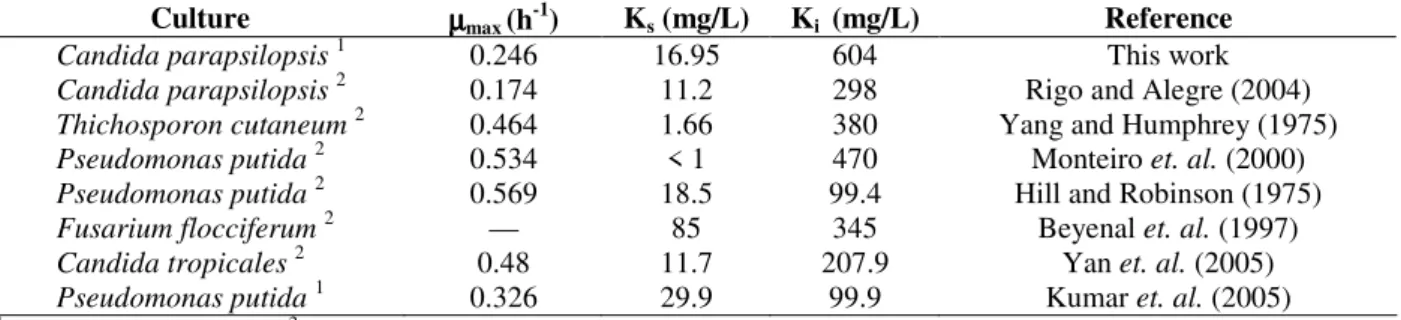
Table 1 - Kinetic constants for phenol or catechol biodegradation (the parameters were obtained from the Haldane’s
model).
Culture µµµµmax (h-1) Ks (mg/L) Ki (mg/L) Reference
Candida parapsilopsis1 0.246 16.95 604 This work
Candida parapsilopsis2 0.174 11.2 298 Rigo and Alegre (2004)
Thichosporon cutaneum2 0.464 1.66 380 Yang and Humphrey (1975)
Pseudomonas putida2 0.534 < 1 470 Monteiro et. al. (2000)
Pseudomonas putida2 0.569 18.5 99.4 Hill and Robinson (1975)
Fusarium flocciferum2 — 85 345 Beyenal et. al. (1997)
Candida tropicales2 0.48 11.7 207.9 Yan et. al. (2005)
Pseudomonas putida1 0.326 29.9 99.9 Kumar et. al. (2005)
1
Catechol biodegradation. 2Phenol biodegradation.
MATERIALS AND METHODS
Microorganisms
Samples from an industrial chemistry effluent contaminated with phenolic compounds were collected. The microorganisms in the samples were isolated by procedure described by Rigo and Alegre (2004). Each species of microorganism was
tested as a pure culture for the ability to grow on phenol (50 to 1000 mg/L). The standard medium (SM; Table 2) was prepared in two solutions, A and B, which were steam-sterilized separately. After cooling to room temperature, the solutions were mixed aseptically. The final SM was prepared by adding catechol (modified according to Yang and Humphrey, 1975).
Table 2 - Standard medium.
Component g/liter
Solution A Solution B
KH2PO4 1.6
KI 0.001
(NH4)2SO4 3.0
CaCl2 · 2 H2O 0.3
MgSO4 · 7 H2O 0.5
Trace elements a 1 mL
Vitamins b 16 mL
Catechol Variable
a
Trace elements solution (in g/L): H3BO3 0.1; ZnSO4 · 7H2O 0.04; (NH4)Mo7O24 · 4H2O 0.02; MnSO4 · 7H2O 0.04; CuSO4 5H2O 0.045; FeSO4 · 7H2O 0.025.
b
Vitamin solution (in mg/L): Ca-pantothenate 200; thiamine-HCl 40; pyridoxin-HCl 40.
The selected species were inoculated in SM containing 50 mg/L of catechol in 250 mL conical flasks with 50 ml of medium, and incubated at 30 °C and 2.5 Hz. When growth was detected, samples were inoculated into new flasks with SM containing 150 mg/L of catechol. This procedure was repeated increasing the catechol concentration to 450 mg/L and finally to 900 mg/L. Controls were made by following the same procedure without any addition of inoculum.
Catechol Biodegradation kinetics Using Candida parapsilopsis 483
prepared with standard medium containing 150 mg/L catechol was added to the flasks and the absorbance and catechol concentration was measured during the fermentation course. For all the assays, the initial pH value was 7.0 and incubation at 30 °C under agitation.
A number of substrate-inhibition models have been proposed for use with inhibitory substrates (Sokol and Howell, 1981; Yang and Humphrey, 1975). The simplest and most commonly used model, which is the Haldane’s model, is given as:
+ + =
i s
K S S
K
1
max
µ
µ
Where Ki is an inhibition constant, equivalent to the highest substrate concentration at which the specific grown rate (µ) is equal to a half part of the maximum specific growth rate (µmax) in the absence of inhibition.
Catechol assay
Catechol was measured by a colorimetric method based on its rapid condensation with 4-aminoantipyrine (4-amino-2,3-dimethyl-1-phenyl-3-pyrazolin-5-one), followed by oxidation with tripotassium hexacyanoferrate under alkaline conditions to give a red product. The culture sample was filtered through a 1.2-µm filter
(Whatman), and the filtrate was used to determine the catechol concentration APHA, (1989).
Microorganisms growth determination were done by measuring of the optical density at 600 nm using a Hach DR/4000 V spectrophotometer.
RESULTS AND DISCUSSION
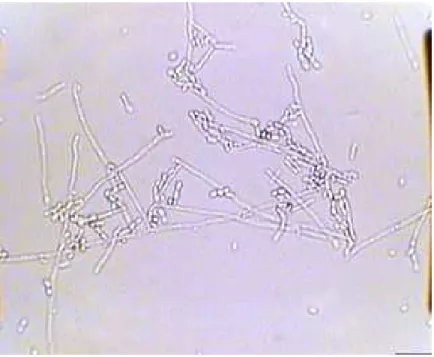
The 22 microorganisms isolated were capable to grow on phenol as sole carbon and energy sources, in prior work (Rigo and Alegre, 2004). In this work, microorganisms were also cultured in pure culture with catechol as the only carbon source in SM medium. There was only one species capable to grow with catechol concentration up to 900 mg/L: a mycelial yeast identified as Candida
parapsilopsis, based on its morphology,
physiological and biochemical characteristics. This species was also capable of degrading phenol in high concentration (Rigo and Alegre, 2004). Although C. tropicalis has been referred as a phenol degrader (Ruiz-Ordaz et al., 2001; Yan et al., 2005), there was no report on C. parapsilopsis
to have catechol degrading activity. Figure 1 shows the micrography of C. parapsilopsis
growing in a catechol concentration of 1.0 g/L. The other species of bacteria could possibly grow in SM at low concentration of catechol, 50 mg/L (data not shown).
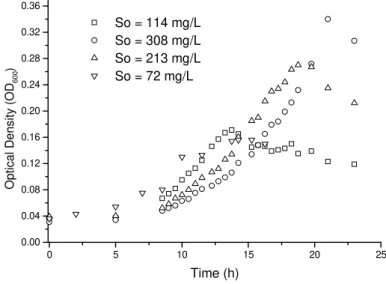
Batch cultures of C. parapsilopsis were carried out in a standard medium containing initial catechol concentrations ranging from 36 to 910 mg/L. For each flask with a certain initial catechol concentration, the specific growth rate of biomass was calculated. Figure 2 shows typical curves for
C. parapsilopsis where density optical was plotted
against time, for some experiments using different initial catechol concentration. The maximum growth rate was 0.19 h-1 at an initial catechol concentration of 72 mg/L. That means that there was a small lag phase. As the initial catechol concentration increased to 213 and 308 mg/L the lag phase raised to 5 and 7 h, respectively.
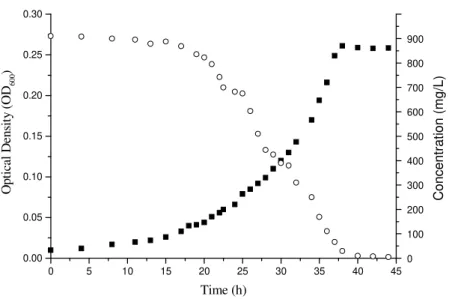
Figure 3 shows a typical growth curve of C.
parapsilopsis with the effective degradation of
catechol. The equation of Haldane was adopted for assessing the dynamic behavior of C.
parapsilopsis grown on catechol since the high
catechol concentration caused the inhibition on the cell grown. Then, this equation was used to fit the experimental data of a specific growth rate of biomass for each batch culture with initial different catechol concentration. By using nonlinear least squares-regression analysis of the software Statistic, the value of the chi square coefficient was a small value (0.00004), indicating that the regression curve and the experimental data had an excellent agreement. Kinetic parameters for
C. parapsilopsis grown on catechol were µmax =
0.246 h-1, Ks = 16.95 mg/L and Ki = 604.85 mg/L.
The comparison between the calculated and experimental specific growth rates of biomass at different initial catechol concentration is shown in Figure 4. As expected, the maximum specific grown rate occurred at low catechol concentration, and with further increase of initial catechol concentration, lower values of the specific grown rates were obtained, due to intense substrate inhibition at high catechol concentration. In addition to the ability of catechol degradation and high-level resistance to this compound, the best yeast strain chosen had low nutritional requirements. It could grow and degrade catechol in a medium containing 30 mg/L glucose and 3 mg/L of casein. These characteristics suggested its possible application for the removal of phenolic substances from wastewaters containing other carbons compounds beside phenolic compounds as suspended cells or in an immobilized form.
Values of the kinetic constants obtained in this work confirmed the same magnitude found in literature data. The value of the maximum specific growth rate was very low (Table 1). However, the medium used in this work had also a very low vitamin content.
The newly isolated C. parapsilopsis capable of using catechol as the only carbon and energy sources could be important in bioremediation and wastewater treatments, nevertheless the kinetic parameters were less suitable for practical use.
0 5 10 15 20 25
0.00 0.04 0.08 0.12 0.16 0.20 0.24 0.28 0.32 0.36
So = 114 mg/L So = 308 mg/L So = 213 mg/L So = 72 mg/L
O
p
ti
c
a
l
D
e
n
s
it
y
(
O
D6
0
0
)
Time (h)
Figure 2 - Optical density at 600 nm as a function of time of catechol degradation by C.
Catechol Biodegradation kinetics Using Candida parapsilopsis 485
0 5 10 15 20 25 30 35 40 45
0.00 0.05 0.10 0.15 0.20 0.25 0.30
Time (h)
O
p
ti
ca
l
D
en
si
ty
(
O
D6
0
0
)
0 100 200 300 400 500 600 700 800 900
C
o
n
c
e
n
tr
a
ti
o
n
(
m
g
/L
)
Figure 3 - Catechol degradation by C. parapsilopsis in standard medium into the Erlenmeyer flask
(So = 910 mg/L), (○) represented catechol concentration, (■) represented optical density.
0 100 200 300 400 500 600 700 800 900 1000
0.08 0.10 0.12 0.14 0.16 0.18 0.20
Model of Haldane:
µ = µmax / ((Ks/S) + 1 + (S/Ki))
µmax =0.24637 ± 0.0168 h-1
Ks = 16.95427 ± 4.88981 g/L Ki = 604.85042 ± 93.97573 g/L Chi^2 = 0.00004
µ
(
h
-1 )
So (mg / L)
Figure 4 - Specific growth rate (µ) as a function of the initial catechol concentration (So).
(■)Experimental data.
ACKNOWLEDGEMENTS
We are grateful to Universidade Estadual do Centro – Oeste (UNICENTRO), Universidade Estadual de Campinas (UNICAMP) and Fundação Tropical de Pesquisas e Tecnologia André Tosello for identification of Candida parapsilopsis.
RESUMO
Neste trabalho foi estudada a biodegradação de catecol em frascos de Erlenmeyers em água residuária sintética pela levedura Candida
parapsilopsis. As respostas dos ensaios cinéticos
ocasionaram uma fase lag longa para a levedura. Portanto, a aclimatização da cultura de levedura empregada para biodegradação de catecol é de fundamental importância, sendo possível reduzir toda a concentração inicial de catecol da água residuária sintética de 910 mg/L em 48 horas. Os dados experimentais da cinética de biodegradação do catecol foram ajustados pelo modelo de Haldane adequadamente, sobre a faixa de concentração de catecol investigada de 36 a 910 mg/L. Os parâmetros cinéticos obtidos do modelo de Haldane foram: µmax = 0,246 h
-1
, Ks = 16,95 mg/L e Ki = 604,85 mg/L.
ABREVIATIONS
Ki = inhibition constant for catechol (mg/L) Ks = half-saturation constant for catechol (mg/L) S = catechol concentration (mg/L)
So = initial catechol concentration (mg/L) µ = specific growth rate of biomass (h-1
)
µmax = maximum specific growth rate of biomass (h-1)
REFERENCES
APHA, (1989), Standard Methods for the Examination of Water and Wastewater. 17th ed., American Public Health Association, Washington, DC.
Beyenal, H.; Seker, S.; Tanyolac, A.; Salih, B. (1997), Diffusion coefficients of phenol and oxigen in a biofilm of Pseudomonas putida. AIChE J., 43, 243-250.
Doran, P. M. (2000), Bioprocess Engineering Principles. 5th ed. Academic Press. San Diego, pp. 36-37.
Gerrard, A. M.; Júnior, J. P.; Kosteèková, A.; Páca, J.; Stiborová, M.; Soccol, C. R. (2006), Simple models for the continuous aerobic biodegradation of phenol in a packed bed reactor. Brazilian Archives of Biology and Technology, 49, 669-676.
Godjevargova, T.; Aleksieva, Z.; Ivanova, D. (2000), Cell immobilization of Trichosporon cutaneum strain with phenol degradation ability on new modified polymer carriers. Process Biochemistry,35, 699-704. Hill, G. A.; Robinson, C. W. (1975), Substrate
inhibition kinetics phenol degradation by
Pseudomonas putida. Biotechnol. Bioeng., 17, 1599-1615.
Jindrová, E.; Chocová, M.; Demnerová, K.; Brenner, V. (2002), Bacterial aerobic degradation of benzene, toluene, ethylbenzene and xylene. Folia Microbiol., 47,83-94.
Komarkova, E.; Paca, J.; Klapkova, E.; Stiborova, M.; Soccol, C. R.; Sobotka, M. (2003), Physiological changes of Candida tropicalis population degrading phenol in fed batch reactor. Brazilian Archives of Biology and Technology, 46, 537-542.
Kumar, A.; Kumar, S. (2005), Biodegradation kinetics of phenol and catechol using Pseudomonas putida
MTCC 1194. Biochem. Eng. J., 22, 151-159.
Marek, J.; Páca, J.; Halecký, M.; Koutský, B., Sobotka, M.; Keshavarz, T. (2001), Effect of pH and loading manner on the start-up period of peat biofilter degrading xylene and toluene mixture, Folia Microbiol., 46,205-210.
Monteiro, A. A. M. G; Boaventura, R. A R,;.Rodrigues, A E. (2000), Phenol biodegradation by Pseudomonas putida DMS 548 in a batch reactor. Biochem. Eng. J., 6, 45-49.
Páca, J.; Komárkova, E.; Prell, A.; Stiborová M.; Soborová, M. (2002), Kinetics of phenol oxidation by
Candida tropicalis: effects of oxygen supply rate and nutrients on phenol inhibition. Folia Microbiol., 47, 701-708.
Rigo, M.; Alegre, R. M. (2004), Isolation and selection of phenol-degrading microorganisms from industrial wastewater and kinetics of the biodegradation. Folia Microbiol., 49, 41-45.
Ruiz-Ordaz, N.; Ruiz-lagunez, J. C.; Gonzalez, J. U. C.; Manzano, E. H.; Urbina, E. C; Mayer, J. G. (2001), Phenol biodegradation using a repeated batch culture of Candida tropicalis in a multistage bubble column.
Revista Latinoamericana de Microbiologia, 43, 19-25.
Ruiz-Ordaz, N.; Manzano, W. H; Lagúnez, J. C. R.; Urbina, E. C.; Mayer J. G. (1998), Growth kinetic model that describes the inhibitory and lytic effects of phenol on Candida Tropicalis yeast.. Biotechnol. progress., 14, 966-969.
Sokol, W.; Howell, H. W. (1981), Kinetics of phenol oxidation by washed cells. Biotechnol. and Bioeng., 23, 2039-2049.
Yan, J.; Jianping, W.; Hongmei, L.; Suliang, Y.; Zongding H. (2005), The biodegradation of phenol at high initial concentration by the yeast Candida tropicalis. Biochem. Eng. J., 24, 243-247.
Yang, R. D.; Humphrey, A E. (1975), Dynamic and steady state studies of phenol biodegradation in pure and mixed cutures. Biotechnol. Bioeng., 17, 1211-1235.