282 Brazilian Journal of Physics, vol. 36, no. 2A, June, 2006
XAS of High Pressure Xe Clusters in Amorphous Carbon and Computational
Simulation for the fcc and hcp Xenon Crystalline Phases
Myriano H. Oliveira Jr and Francisco C. Marques
Instituto de F´ısica Gleb Wataghin, Universidade Estadual de Campinas, Caixa Postal 6165, 13083-970 Campinas-SP, Brazil
Received on 4 April, 2005
We report the investigation of Xe clusters in amorphous carbon by x-ray absorption spectroscopy (XAS) to understand the properties of solid xenon. Measurements have been performed on xenonL3absorption edge at
room temperature (300K). Using computational XANES calculation for fcc and hcp structures it was possible to study the XANES fine structure origin and a relation between the x-ray absorption near edge structure and the lattice constant. Comparing those results with our experimental data we determined that the XAS fine near edge structure has a specific behavior for solid xenon and does not have this behavior for gas Xe end Xe diluted in others chemical elements matrices.
Keywords: Xe clusters; Amorphous carbon; X-ray absorption spectroscopy
I. INTRODUCTION
Studies on Xe trapped in diamond anvil cells have showed that this element crystallizes in fcc and hcp structures depend-ing on the pressure exerted on it [1,2]. Furthermore, it has been found that solid xenon is an electrical isolating up to 140GPa [3-5].
There are many works on the study of xenon incorporation in solid crystalline metals or semiconductors by ion implanta-tion [6-10]. It has been observed that when xenon is implanted at room temperature with energies in the range of about 200 to 400KeV it agglomerates in form of solid crystalline clusters when a concentration of about 4% xenon is reached. The crys-talline cluster phase depends on the host matrix phase, being fcc for fcc and bcc [11-13] matrices and hcp for hcp [14] ones. The xenon lattice constant depends on the chemical nature of the host matrix, once different elements can exerts different pressures on the implanted elements. It has been observed a variation of stress form about few tenths of GPa to∼6 GPa [7-10].
Until the work of R. G. Lacerda et al. [15] about noble gases (NG) solid cluster precipitation in amorphous carbon matrices, nothing was reported on solid NG within amorphous materials using x-ray absorption spectroscopy (XAS) which is one of the most used techniques applied to characterize those clusters in crystalline matrices. From the deposition technique used it is possible to incorporate Xe atoms in amorphous ma-terials during the film growth using an ion gun with energies 100 times smaller than that used for conventional implantation in crystalline materials, obtaining the same Xe concentration (about 5%) [15].
The appearance of a peak in XANES region after the white line of xenon L3 absorption edge, that has been always
at-tributed to xenon in solid phase, remains unexplained. In this work we use some computational calculations on solid crys-talline XeL3XAS spectra and compare them with results from
this element implanted in a-C trying to understand the origin of this fine structure and its relation to solid state xenon.
II. EXPERIMENTAL
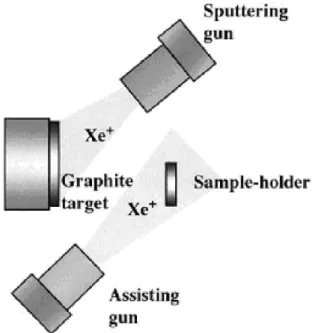
Thin a-C films were deposited by the IBAD (Ion-Beam As-sisted Deposition) technique. The apparatus is composed of two Kaufman ion sources, see Fig. 1. One xenon ion beam generated by the gun was used in order to sputter a graphite target with a fixed energy of 1500eV, and a current of 90mA. The other ion gun (usually called assisting ion gun or assisting ion beam) was used to simultaneously bombard the film dur-ing the deposition. The assistdur-ing beam energy can be varied from 0 to some hundreds eV depending on the film structural properties of interest. However, in this work we are inter-ested in studying the sample prepared with a xenon assisting ionic beam with energy of 300eV. This choice is due to the fact that under this condition the films contain xenon clus-ters in solid phase, as reported elsewhere [15,16]. The base pressure in the vacuum chamber was<10−5Pa, and the total
pressure during growth was kept at 6x10⁻²Pa. The thickness
of the film is 70nm and was deposited onto silicon wafers at 150oC. With an assisting ion energy of 300eV it was obtained
a film with intrinsic stress of 10GPa. The intrinsic stress value was obtained using the bending beam method by determin-ing the radius of curvature of the film/substrate, and calculat-ing the stress with the Stoney’s equation described in more details elsewhere [17]. The concentration of Xe into the car-bon matrix is of about 4%, and was determined by Rutherford Backscattering Spectrometry (RBS).
The x-ray absorption spectroscopy measurements were car-ried through at SXS (Soft X-ray Spectroscopy) beam line at LNLS (Laborat´orio Nacional de Luz S´ıncrotron, Brazil). The measurements were made in the energy range of 4700 eV to 5100 eV. The spectra were collected at room temperature (300K) and 100K.
III. COMPUTATIONAL
In this work we performed computational calculations of the x-ray absorption spectrum aboutL3 Xe absorption edge
Myriano H. Oliveira Jr and Francisco C. Marques 283
FIG. 1: Ion-Beam assisted deposition system sketch. The assisting beam energy of 300eV gives a-C films with a xenon concentration of 4% distributed as solid cluster within the host matrix.
in which this element crystallizes under high pressure, as it has been observed in many works based on x-ray diffraction on xenon trapped in diamond anvil cells [1,2]. Furthermore, there is the observation of fcc and hcp Xe clusters inside crys-talline metals and semiconductor matrices when this element is implanted in determined conditions.
Those calculations were done using the FEFF8 code [18,19]. The parameters used are basically the defaults ones for FMS, Interstitial and Exchange cards. For SCF card only the convergence factorcawas not the default one (used 0.1). The temperature effects were calculated using the Equation of Motion method in the Debye card. The choice for those conditions is supported by the fact that they reproduce solid krypton and xenon experimental spectra, except for the Fermi level.
IV. RESULTS AND DISCUSSION
The experimental absorption spectrum obtained for Xe in amorphous carbon is showed in Fig. 2(a). This spectrum has the same fine structure observed for experimental and simu-lated (Fig. 2(b)) XANES spectra of solid xenon matrix and solid xenon clusters [10]. This result indicates that the xenon atoms are not randomly distributed inside the carbon matrix but, in the form of clusters in such a way that the interaction Xe-Xe within each cluster is stronger then the Xe-C interac-tion. This result is also similar to the results obtained by G. Faraci for Xe implanted in crystalline silicon [10].
The XANES simulation for fcc and hcp solid xenon showed the same fine structure, as can be observed in Fig. 3. Even though this fine structure is assumed to be related to solid xenon, since it is not observed in the gas phase or in Xe diluted
FIG. 2: L3absorption edge XANES spectra for trapped Xe clusters
in a-C matrix (a), and simulation for fcc crystalline Xe (b). The difference between those spectra in the region of about 4.795KeV is due to some geometrical factors and the experimental resolution compared to the simulation.
in others matrices, its origin is not known yet. It is known that XeL3edge is the electronic transition of a 2p3/2electron
to the nd levels (and nsalso, but with less contribution) with n=5,6. . . (=6,7. . . for ns)[20]. However, as for xenon gas, it was also observed a resonance about 15eV above the Fermi level, which some authors refers to that fine structure in solid phase to this same effect. This resonance occurs due to dou-ble electron monopole excitation in atomic Xe from 5pto 6p, i.e., a transition [2p,5p]→[nd, 6p] [20,21]. Due to the small cross section compared to the single electron excitation, it is difficult to observe those resonances since its intensity is very small compared to the white line [20]. As a result, the fine structure in XANES region for solid Xe may be not a conse-quence of multielectron excitation.
When a multi-excitation occurs the electron excited from 2p3/2has less energy then those excited in a single electron
process. Consequently, this electron stays out of phase with the others, resulting in a reduction of the XAS fine structure amplitude. This effect is considered in FEFF8 calculations in the factor S20which is called amplitude reduction factor. Thus, the entire XANES region calculation is performed considering single electron excitations with the same reduction factor. Be-sides the XAS spectra, FEFF8 also allows the calculation of the local projected electronic density of states (l-DOS).
284 Brazilian Journal of Physics, vol. 36, no. 2A, June, 2006
FIG. 3: Simulated XANES spectrum andd−symmetryl-DOS above Fermi level.
is shown a comparison between the simulated XAS curve and thel-DOS with d symmetry that lies just above the Fermi level EF. In XAS structure we named the maximum energy point
of the resonance after the white line, in relation toEF, asE2.
The XAS andl-DOS structures have some similarities, such as the white line and E2position.
Figure 4 shows the fine structures of XAS andl-DOS struc-tures, as in Fig. 3, in which the atomic contribution was sub-tracted out and than normalized for graphic purpose. Those curves show the same fine structure which can be explained by their relation [22]:
µ(E) =µ0(E)[1+χ′(E)] ρ(E) =ρ0(E)[1+χ(E)]
Whereµ0(ρ0)is the atomic absorption coefficient (density
of states) and the functionχthe fine structure of those signals. The only difference betweenχandχ’ is thatχ’ is equal to
χmultiplied by the same amplitude reduction factors due to many bodies effects and an excited state time of life.
Thus, the XANES second peak at the XeL3edge is due to
a single 2p3/2electron transition to ad l-DOS contribution
to the conduction band, i.e. this transition is closely related to the solid xenon band structure or solid xenon clusters. That is why the peakE2does not appear in xenon gas or when one
xenon atom interacts only with atoms of another lighter chem-ical element [10,15,16]. However, for elements with atomic
FIG. 4: Simulated XANES spectrum andd−symmetryl-DOS fine structures.
masses near to that of Xe as Ce, this peak may appear due to its similar electronic structure, but this hypothesis was not tested yet.
Another interesting result is that theE2 position with
re-spect to the Fermi level (EF) is independent of the crystalline phase chosen for the calculations for a fixed first neighbour distancesR, and for simulations performed for the same R value∆E=E2−EF is the same for the experimental data and
fcc and hcp simulation. The noble gas cluster geometry in a-C is still unknown since we are working with an amorphous terial and the cluster geometry depends highly on the host ma-trix structure as it has been showed [11-14]. However, as those films are graphite-like it is reasonable to think that the noble gas clusters are trapped between graphitic planes [15]. Con-sequently, in this case the clusters would be bi-dimensional and have hexagonal geometry. Thus,∆Eseems to be indepen-dent of the geometry, what would be a possible new method for measuring the interatomic distance for solid xenon without the necessity of knowing the system geometry [23].
V. CONCLUSION
With some computational simulations it was possible to explain the origin of the second peak in solid xenonL3
ex-Myriano H. Oliveira Jr and Francisco C. Marques 285
plained why this structure does not appear in the Xe gas phase or in Xe diluted, without forming clusters, in solid matrices.
Acknowledgement
This work was supported by FAPESP, CAPES and CNPq.
We would like to thank the LNLS where the XAS mea-surements and computational calculations were performed. Thanks are due also to G. Azevedo for fruitful discussions and to LAMFI (Laborat´orio de An´alises de Materiais por Feixes Iˆonicos - USP) where the RBS measurements were performed.
[1] A. P. Jephcoat, H.-k. Mao, L. W. Finger, D. E. Cox, R. J. Hem-ley, and C.-s. Zha, Phys. Rev. Lett.59, 2670 (1987).
[2] H. Cynn, C. S. Yoo, B. Baer, V. Iota-Herbei, A. K. McMahan, M. Nicol, and S. Carlson, Phys. Rev. Lett.86, 4552 (2001). [3] R. Reichlin, K. E. Brister, A. K. McMahan, M. Ross, S. Martin,
Y. K. Vohra, and A. L. Ruoff, Phys. Rev. Lett.62, 669 (1989). [4] K. A. Goettel, J. H. Eggert, I. F. Silvera, and W. C. Moss, Phys.
Rev. Lett.62, 665 (1989).
[5] M. I. Eremets, E. A. Gregoryanz, V. V. Struzhkin, H.-k. Mao, R. J. Hemley, N. Mulders, and N. M. Zimmerman, Phys. Rev. Lett.85, 2797 (2000).
[6] D. I. Potter and C. J. Rossouw, J. Nucl. Mater. Science161, 124-131 (1989).
[7] A. Vom Felde, J. Fink, Th. M¨uller-Heinzerling, J. Pfl¨uger, B. Scheerer, G. Linker, and D. Kaletta, Phys. Rev. Lett. 53, 922 (1984).
[8] C. Templer, H. Garem, J. P. Riviere, and J. Delafond, Nucl. Instrum. Meth. In Phys. Research B18, 24-33 (1986). [9] C. Templer, H. Garem, and J. P. Riviere, Philos. Mag. A53,
667-675 (1986).
[10] G. Faraci, A. R. Pennisi, and A. Terrasi, Phys. Rev. B38, 13468 (1988).
[11] H. H. Andersen, J. Bohr, A. Johansen, E. Johnson, L.
Sarholt-Kristensen, and V. Surganov, Phys. Rev Lett.59, 1589 (1987). [12] J. H. Evans and D. J. Mazey, J. Phys. F15, L1 (1985). [13] R .C. Birtcher and J¨ager, Nucl. Instrum. Methods B15, 435
(1986).
[14] J. H. Evans and D. J. Mazey, J. Nucl. Mater.138, 176 (1986). [15] R. G. Lacerda, M. C. dos Santos, L. R. Tessler, P. Hammer, F.
Alvarez, and F. C. Marques, Phys. Rev. B68, 054104 (2003). [16] M. H. Oliveira Jr., P. F. Barbiere, R. G. Lacerda, and F. C.
Mar-ques, Thin Sol. Films469-470, 112 (2004).
[17] M. M. de Lima, Jr., R. G. Lacerda, J. Vilcarromero, and F. C. Marques, J. Appl. Phys.86, 4936 (1999).
[18] A. L. Ankudinov, B. Ravel, J. J. Rehr, and S. D. Conradson, Phys. Rev. B58,7565 (1998).
[19] A. L. Ankudinov, and J. J. Rehr, Phys. Rev. B62, 2437 (2000). [20] I. Arcon, A. Kodre, M. Stuhec, and D. Glavic-Cindro, Phys.
Rev. A51, 147 (1995).
[21] K. Zhang, E. A. Stern, J. J. Rehr, and F. Ellis, Phys. Rev. B44, 2030 (1991).
[22] A. L. Ankudinov, B. Ravel, J. J. Rehr, and S. D. Conradson, Phys. Rev. B58, 7565 (1998).