Article
J. Braz. Chem. Soc., Vol. 23, No. 11, 2027-2034, 2012. Printed in Brazil - ©2012 Sociedade Brasileira de Química 0103 - 5053 $6.00+0.00
A
*e-mail: [email protected]
Regional Assessment of Sewage Contamination in Sediments of the Iguaçu and
the Barigui Rivers (Curitiba City, Paraná, Southern Brazil) using Fecal Steroids
Lucas Puerari,a Renato S. Carreira,*,b Artur C. B. Neto,a Lilian C. Albarelloa and
Fabiana D. C. Gallottac
aInstituto de Geociências, Universidade Federal do Rio Grande do Sul,
Av. Bento Gonçalves, 9500, CP 15001, 91501-970 Porto Alegre-RS, Brazil
bDepartamento de Química, Pontifícia Universidade Católica do Rio de Janeiro,
Rua Marquês de São Vicente, 225, 22453-900 Rio de Janeiro-RJ, Brazil
cCentro de Pesquisas da Petrobras (CENPES),
Av. Horácio Macedo, 950, 21941-15 Rio de Janeiro-RJ, Brazil
Esteroides derivados de fontes fecal (coprostanol, epicoprostanol e coprostanona) e mista (colesterol, colestanol e colestanona) foram analisados em 19 amostras de sedimentos superficiais, coletados em duas amostragens, por cromatografia gasosa com detector de ionização de chama (GC/FID) para prover uma avaliação regional da contaminação por esgotos nos Rios Iguaçu e Barigui, no Sul do Brasil. As concentrações médias de coprostanol na coleta de verão (109 ± 122 µg g-1) e na de inverno (130 ± 116 µg g-1) em 2007, com máximo de ca. 330 µg g-1, caracterizam os sedimentos como altamente contaminados por material fecal. Razões diagnósticas usando compostos selecionados sugeriram que os efluentes domésticos são a principal fonte de contaminação, embora o esterco produzido em áreas rurais possa ter importância localizada. Os resultados mostraram que o lançamento de esgotos não tratados pode representar um risco para a saúde ambiental do sistema fluvial quando a capacidade do sistema para dispersar e diluir efluentes é reduzida em períodos de baixo fluxo de água.
Steroids derived from fecal (coprostanol, epicoprostanol and coprostanone) and mixed (cholesterol, cholestanol and cholestanone) sources were analyzed in 19 surface sediments collected in two samplings by gas chromatography with flame ionization detection (GC/FID) in order to provide a regional assessment of the sewage contamination in the Iguaçu and Barigui Rivers, Southern Brazil. The mean concentrations of coprostanol in the Summer (109 ± 122 µg g-1) and Winter (130 ± 116 µg g-1) seasons in 2007, with maximum value of approximately 330 µg g-1, situate the studied sediments as heavily contaminated by sewage. Diagnostic ratios among selected compounds suggested that domestic effluents were the main source of contamination, although the contribution of manure from livestock might also be locally important. The results show that the release of raw sewage may pose a relevant threat to the environmental health of river systems when the capacity to disperse and dilute the effluents is reduced during periods of small river water flow.
Keywords: sewage contamination, river sediments, molecular marker, coprostanol
Introduction
The input of domestic sewage, both treated and untreated, is a major concern regarding the contamination of aquatic environments. One reason for that is the large and increasing volume of sewage produced daily which is
usually not followed by the necessary infrastructure of collection, treatment and adequate disposal of the effluents, particularly in developing and undeveloped countries. Moreover, in addition to solid and dissolved material (both organic and inorganic), which in turn may cause nutrient over-enrichment, oxygen depletion and decrease water transparency, sewage contains a complex mixture
contaminants present in sewage has distinct persistency, bioaccumulation potential and toxicity, including endocrine disrupting properties, all of which may pose a threat to
biodiversity and ecosystem balance.1 Finally, the presence
of sewage in aquatic systems is usually associated with high levels of pathogens and, thus, represents a risk to public health when the contaminated water is used for
consumption, recreation or to the production of food.2,3
Bacteria of the coliform group, as well as fecal Streptococci, are indicators of fecal contamination
commonly used to certify the condition of water bodies.4
However, to monitor the spatial dispersion and accumulation of sewage, it is necessary to select an indicator that has greater persistence in the environment than that presented by biological indicators. In this sense, specific molecules, known generically as anthropogenic molecular markers, are widely used as indicators of fecal contamination. Among several
options, coprostanol (5β-cholestan-3β-ol) has been used
as marker of sewage contamination since the 1960s. This is a result of its specific source assignment, as coprostanol is a fecal sterol produced in the gut of warm blooded animals from the reduction of cholesterol, and because it is a relatively abundant compound, representing 60% of
the total fecal sterols in humans.5 Epicoprostanol (a minor
constituent of human feces but may be produced during sewage treatment) and coprostanone (present in human feces) are other steroids commonly quantified in studies of sewage
contamination.5 Other compounds also considered in such
studies are cholesterol, produced by planktonic organisms but
also found in human feces, and cholestanol, a phytosterol.5
Chemical structures of compounds considered in the present work are presented in Figure 1.
Most of the studies conducted in Brazilian aquatic systems have focused on the distribution of sterols in
estuaries and/or coastal bays,6-9 estuarine lagoons10 and
lagoon systems,11,12 but rarely on exclusively fluvial
systems.13
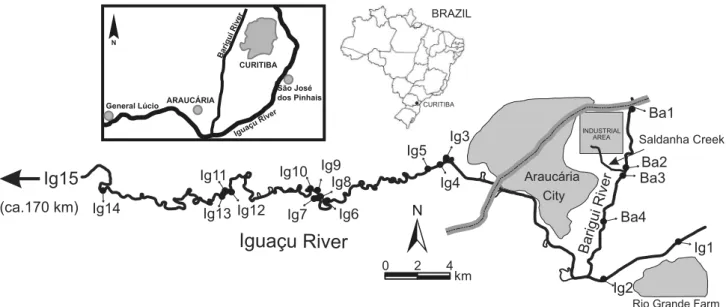
In this study, it was investigated the regional distribution of steroids in sediments from the Iguaçu River and its tributary, the Barigui River. This investigation was conducted 10 km downstream of Curitiba, the Capital City of the Paraná State, up to a distance of approximately 70 km from this city. These rivers receive sewage loads from human settlements presenting different anthropogenic activities (urban, industrial and rural) along this distance. The sediments were collected in two periods (Summer and Winter in 2007), at stations in the main channels of the Iguaçu and the Barigui Rivers and some secondary channels of the Iguaçu River, and in a control station distant 200 km downstream.
Experimental
Study area, sampling strategy and in situ measurements
The Iguaçu is the main river in the Paraná State, Southern Brazil. This river is about 1,300 km long, from its headwaters in the Serra do Mar in the East to its confluence with the Paraná River in the West, covering a drainage basin
of around 62,000 km2, with a mean annual water flow of
1,800 m3 s-1.14 The climate in the region is sub-tropical,
with humid conditions all over the year and with average precipitation ranging from 92 to 144 mm, in the Winter and Summer, respectively.
At the study area (Figure 2), the river can be divided into two sections. On the upstream side, much of the river length has been channeled, with a width of around 40 m and depths ranging between 1.5 to 2.0 m. From the point Ig3 onward,
the river flows on its natural bed, highly sinuous, with a broad flood plain, many secondary channels and abandoned meanders. The main channel of this section presents widths varying from 40 to 60 m and depths ranging from 1.4 to 3.0 m. The Barigui River (Figure 2) is a tributary of the Iguaçu, with a length of 60 km. In the study region, the channel width ranges from 15 to 20 m, with depths from 0.20 to 0.50 m, receiving contributions from the Saldanha Creek (Figure 2), which drains an important industrial area (e.g., oil refinery).
Sediments were sampled at 19 stations (Figure 2) and in two periods (January/2007 and July/2007). A Van Veen type dredge was used for sampling, and the surface layer (0-2 cm) of the sediment was carefully sub-sampled and stored in aluminum containers (previously decontaminated with dichloromethane). Samples were kept refrigerated in the field and stored frozen at –20 ºC in the laboratory until analysis. Most of the sampling stations were positioned in the main channel of the Iguaçu and the Barigui Rivers, but stations Ig8, Ig10, Ig12 and Ig13 were located in secondary channels (Figure 2). Station Ig15, used as a control station, was located near the União da Vitória City, around 200 km downstream the Araucária City. It is a region with agricultural activities (grain production) with no major urban settlement.
As the sampling may be considered limited (only two periods) and no replicate samples were collected. Because the sampling device mixes a sediment layer that may represent several years depending on local sedimentation rates, the results obtained in the present work represent two snapshots of the environmental condition in the fluvial system and no evaluation of seasonal trends in steroids distribution can be done.
Determination of total organic carbon (TOC)
TOC analysis was performed by oxidation with sodium
persulfate at high temperature. The CO2 generated from the
oxidation was absorbed in sodium hydroxide solution and
determined by volumetry.15 Precision was higher than 15%
based on 4 replicate analyses of a sediment sample.
Determination of coprostanol and other steroids
Detailed analytical conditions for the steroids analyses
have been described elsewhere.6 Briefly, 10-20 g (precision
of 0.001 g) of wet sediment were mixed with sodium sulfate (solvent extracted and dried at 105 °C) and Soxhlet extracted with 200 mL of a mixture of dichloromethane and methanol (2:1 v/v; pesticide grade; J. T. Baker) for 24 h.
Before extraction, 5.6 µg androstanol (5α-androstan-3β-ol;
> 95% purity; Sigma) were added to the samples as a surrogate standard. The bulk organic extract was reduced by rotary evaporation, and elemental S and water traces were removed using activated copper and anhydrous sodium sulfate, respectively.
The fraction containing the sterols was separated from the bulk organic extract by column chromatography on silica gel (5 g, 230-400 mesh, 5% water deactivated; Merck) by elution with 24 mL of 10% methanol in dichloromethane. This fraction was concentrated by rotary
evaporation and by a gentle stream of purified N2 and was
then stored at –20 °C until analysis by gas chromatography
with flame ionization detection (GC/FID).
Quantitative analyses of 1 µL sample aliquots were performed in a GC/FID equipment (Hewlett-Packard model 6890). An HP-5 (5% phenyl methyl siloxane)
capillary column with 30 m length, 0.32 mm i.d. and
0.25 µm film thickness was used with He as the carrier
gas (maintained at a constant flow rate of 1 mL min-1).
The column temperature was programmed from an initial
1 min hold at 60 to 250 °C at 15 °C min-1 and then from
250 to 300 °C at 1 °C min-1, with a final hold of 5 min.
The injector and detector temperatures were set at 270 and 300 ºC, respectively. Prior to injection, the extracts were dried and the sterols were derivatized with 100 µL of bis(trimethylsilyl)trifluoroacetamide (BSTFA; Sigma) at
80 °C for 1 h. Cholestane (5.0 µg; > 95% purity; Sigma)
was added to the final extract, as an internal standard for quantification.
Authentic standards of androstanol (surrogate standard), coprostanol, epi-coprostanol, cholesterol, cholestanol, coprostanone and cholestanone were obtained from Sigma-Aldrich, Poole, UK. All standards were 95% pure or higher. Quantification was based on the response factors of each compound to the internal standard (cholestane). Calibration
curves with five points in the range of 500 to 10,000 ng mL-1
were constructed to check for linearity (r > 0.999) of the instrumental response. Two of the standards from the calibration curve were also analyzed daily to check response factors and chromatographic parameters
(retention times, peak shape and resolution). As certified reference materials for fecal sterols are not commercially available, quality control procedures involved the analysis of laboratory blanks (no contamination was observed), spiked samples (n = 3; recovery higher than 80% for each compound) and check of surrogate standard recoveries (which varied between 70-85% with standard-deviations below 15%). Precision was higher than 20% for all fecal steroids, based on 4 replicate analyses of one sediment sample. The limit of quantification (LOQ) was estimated as
0.010 µg g-1, based on the instrument signal/noise ratio and
by consideration of the mean mass of sediment extracted.
Results and Discussion
Distribution of TOC and coprostanol
In general, the TOC contents in the sediment were very similar in both samplings, with the same mean of 2.38% and ranging from 0.10 to 4.80% (Summer sampling) and 0.30 to 4.40% (Winter sampling) (Table 1). However, a considerable variation in TOC concentrations was observed at stations Ba3, Ig4, Ig7 and Ig8 in both samplings. Since it was conducted only two samplings without sample
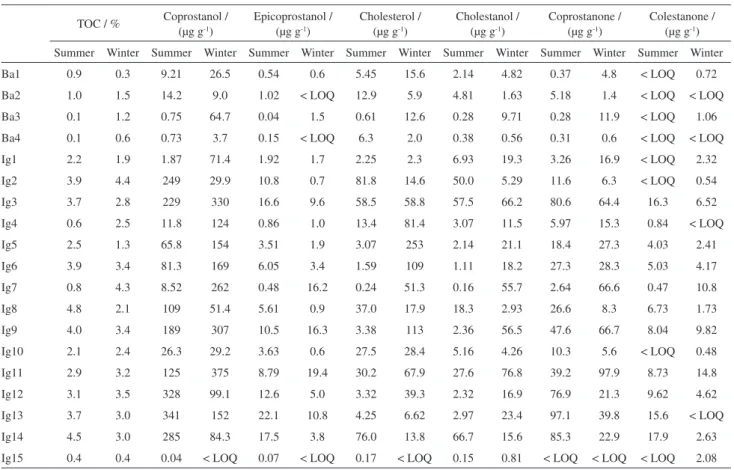
Table 1. Distribution of total organic carbon (TOC) and fecal steroids in sediments collected twice (Summer and Winter 2007) in the Iguaçu and the Barigui River systems (< LOQ: less than the limit of quantification or 0.010 µg g-1)
TOC / % Coprostanol / (µg g-1)
Epicoprostanol / (µg g-1)
Cholesterol / (µg g-1)
Cholestanol / (µg g-1)
Coprostanone / (µg g-1)
Colestanone / (µg g-1)
Summer Winter Summer Winter Summer Winter Summer Winter Summer Winter Summer Winter Summer Winter
Ba1 0.9 0.3 9.21 26.5 0.54 0.6 5.45 15.6 2.14 4.82 0.37 4.8 < LOQ 0.72
Ba2 1.0 1.5 14.2 9.0 1.02 < LOQ 12.9 5.9 4.81 1.63 5.18 1.4 < LOQ < LOQ
Ba3 0.1 1.2 0.75 64.7 0.04 1.5 0.61 12.6 0.28 9.71 0.28 11.9 < LOQ 1.06
Ba4 0.1 0.6 0.73 3.7 0.15 < LOQ 6.3 2.0 0.38 0.56 0.31 0.6 < LOQ < LOQ
Ig1 2.2 1.9 1.87 71.4 1.92 1.7 2.25 2.3 6.93 19.3 3.26 16.9 < LOQ 2.32
Ig2 3.9 4.4 249 29.9 10.8 0.7 81.8 14.6 50.0 5.29 11.6 6.3 < LOQ 0.54
Ig3 3.7 2.8 229 330 16.6 9.6 58.5 58.8 57.5 66.2 80.6 64.4 16.3 6.52
Ig4 0.6 2.5 11.8 124 0.86 1.0 13.4 81.4 3.07 11.5 5.97 15.3 0.84 < LOQ
Ig5 2.5 1.3 65.8 154 3.51 1.9 3.07 253 2.14 21.1 18.4 27.3 4.03 2.41
Ig6 3.9 3.4 81.3 169 6.05 3.4 1.59 109 1.11 18.2 27.3 28.3 5.03 4.17
Ig7 0.8 4.3 8.52 262 0.48 16.2 0.24 51.3 0.16 55.7 2.64 66.6 0.47 10.8
Ig8 4.8 2.1 109 51.4 5.61 0.9 37.0 17.9 18.3 2.93 26.6 8.3 6.73 1.73
Ig9 4.0 3.4 189 307 10.5 16.3 3.38 113 2.36 56.5 47.6 66.7 8.04 9.82
Ig10 2.1 2.4 26.3 29.2 3.63 0.6 27.5 28.4 5.16 4.26 10.3 5.6 < LOQ 0.48
Ig11 2.9 3.2 125 375 8.79 19.4 30.2 67.9 27.6 76.8 39.2 97.9 8.73 14.8
Ig12 3.1 3.5 328 99.1 12.6 5.0 3.32 39.3 2.32 16.9 76.9 21.3 9.62 4.62
Ig13 3.7 3.0 341 152 22.1 10.8 4.25 6.62 2.97 23.4 97.1 39.8 15.6 < LOQ
Ig14 4.5 3.0 285 84.3 17.5 3.8 76.0 13.8 66.7 15.6 85.3 22.9 17.9 2.63
replication, it is not possible to attribute such differences to a seasonal trend, induced by hydrological parameters (i.e., river flow). But these results might be ascribed to a high sediment heterogeneity which, in turn, was probably derived from the presence of sandy sediments at these stations (visual observation of granulometry).
The mean concentrations of coprostanol were very
similar in both samplings: 109 ± 122 µg g-1 in the Summer
sampling and 130 ± 116 µg g-1 in the Winter sampling
(Table 1). However, as also observed for TOC, the distribution of coprostanol among the stations differed considerably in many cases. At station Ig1, located further upstream at the Iguaçu River, the concentration of
coprostanol was 1.87 µg g-1 in the Summer sampling and
increased to 71.4 µg g-1 in the Winter sampling. This trend of
higher coprostanol concentrations in the Summer sampling was observed in most stations, as will be discussed below. On the other hand, in opposite, it was observed in the
next station (Ig2), with 249 µg g-1 of coprostanol in the
Summer and 29.9 µg g-1 in the Winter samplings. Station Ig2
is influenced by the Rio Grande Farm, a rural-urban area, therefore the increasing concentration of coprostanol in the Summer, which is usually a rainy season, might be related to soil flushing by rainwater.
Station Ig3 showed high concentrations of coprostanol
in both samplings (229 and 330 µg g-1, Summer and
Winter samplings, respectively), indicating a high level of contamination of the Iguaçu River sediments by sewage input from the Araucária City. The other stations at the Iguaçu River downstream the Araucária City (Ig4 to Ig14) are also characterized by very high concentrations of
coprostanol (65.8 to 375 µg g-1, excluding stations Ig4 and
Ig7 in the Winter sampling), with a general trend for higher values in the Summer sampling (Table 1). At the Barigui River, the distribution of coprostanol concentrations between the samplings was similar, characterized by lower concentrations during the first sampling in the Summer
(mean of 6.22 µg g-1) in contrast to an average of 26.0 µg g-1
in the second sampling, in the Winter. Also noteworthy, it is
the high concentration of coprostanol (64.7 µg g-1) at station
Ba3, located immediately downstream of the input from an industrial area. Only at station Ig15, the concentration of coprostanol was low (< LOD, limit of detection,
0.04 µg g-1) in both samplings, which indicates, therefore,
no contamination at this site. This was expected as station Ig15 is located 200 km downstream of the Araucária City and was considered as a reference site in our study.
A relationship was observed between coprostanol and TOC contents in the sediment (Figure 3), with a stronger positive correlation in the Summer sampling (r = 0.75,
p < 0.01) when compared to the Winter sampling (r = 0.47,
p < 0.05). In both samplings, however, concentrations of
coprostanol above 300 µg g-1, observed at stations Ig12 and
Ig13 in the Summer and at stations Ig3, Ig9 and Ig11 in the Winter, were not accompanied by enhanced TOC levels. These results might reflect the influence of local processes upon the amount and distribution of coprostanol in the studied sediments, including distinct transport and sedimentation of organic materials in the rivers and/or different composition of local sources of organic matter. For example, the higher concentration of coprostanol in the Summer sampling at stations Ig12 and Ig13 (Table 1), located in the secondary channels of the Iguaçu River, suggests that these channels are contaminated by sewage only during the periods of high river flow.
Evaluation of the level of sewage contamination
The use of sterols to evaluate the contamination of river systems by sewage is relatively scarce in Brazil. However, the comparison of the data available with those obtained in the present study (Table 2) suggests a high degree of sewage contamination, at least in the region where the highest concentrations of coprostanol were measured, i.e., in the main channel of the Iguaçu River (means of
101 and 246 µg g-1 in the Summer and Winter samplings,
respectively). For example, rivers receiving high sewage loads located in highly urbanized regions of the Brazilian coastal zone have shown lower concentrations of coprostanol than those measured in the present study. This is the case of the Capibaribe River Estuary (Recife City, Pernambuco State, Brazil, 0.52 to 7.31 µg g-1)9 and the fluvial-estuarine
zone of the Northwestern Guanabara Bay (Rio de Janeiro
City, Rio de Janeiro State, Brazil, 20 to 175 µg g-1).7
Specifically regarding the Barigui River, the present
set of data for coprostanol (mean of 16.1 ± 19.9 µg g-1,
Figure 3. Relationship between coprostanol (µg g-1) and TOC (%) in from
considering both samplings) are relatively lower than values observed in the same river but at stations closer to the highly urbanized metropolitan region of the
Curitiba City (44.2 ± 75.9 µg g-1).13 The high degree of
contamination in our study region is also evident when comparing the data from rivers worldwide exhibiting problems of sewage contamination, as reported in Malaysia (0.04-15.5 µg g-1) and Vietnam (0.01-4.5 µg g-1).16 In fact,
our data is comparable to some of the highest levels of coprostanol found in the literature, such as in the Barcelona
coastal region (1.00-390 µg g-1)17 and the Bilbao Estuary,
in Spain (2.20-293 µg g-1).18
As seen above, a wide range of coprostanol concentrations in aquatic systems can be found, and thus the establishment of a reference value to characterize sewage contamination is not straightforward. Therefore, besides the absolute concentration of coprostanol, another approach to evaluate the level of sewage contamination is the consideration of ratios among selected sterols. The three ratios usually found in the literature, alongside the threshold values suggested to indicate contamination, are shown in Table 3. The ratio coprostanol/cholesterol (Figure 4a) was well above the threshold value of 1.0
proposed for highly sewage contaminated sediments21
in all samples except station Ig15. Regarding the ratios
proposed by Grimalt et al.17 with the 5β and 5α isomers
of sterols and stanones, if the stations Ig1 (wet season) and Ig15 (both seasons) are excluded, the calculated values for these ratios were above the threshold of 0.7, indicative of sewage contamination (Figure 4b).
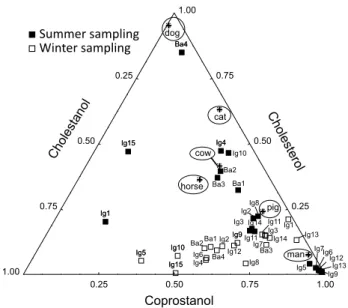
Considering the high level of sewage contamination in the studied sediments based on the concentration of coprostanol and diagnostic ratios, as discussed above, it is interesting to track the potential sources of sewage. This is because, in addition to domestic effluents, fecal steroids can be derived from the manure of livestock farming activities in the drainage basin or even from pets, like dogs and
cats, as observed by some authors.3 The comparison of
the relative proportions of C27 sterols, i.e., coprostanol,
cholesterol and cholestanol, in the samples and those found
in the fecal material of humans and other mammals,3 allows
the identification of the sewage sources.
In Figure 5, it is shown that in most samples from the Iguaçu River the sewage source was domestic effluents (i.e., humans), particularly in the samples collected in the Summer sampling. In the Winter samples, although higher concentrations of coprostanol were observed compared to the Summer sampling (Table 1), most samples are located on the bottom of the ternary diagram, demonstrating a relative increase in the proportion of cholestanol in
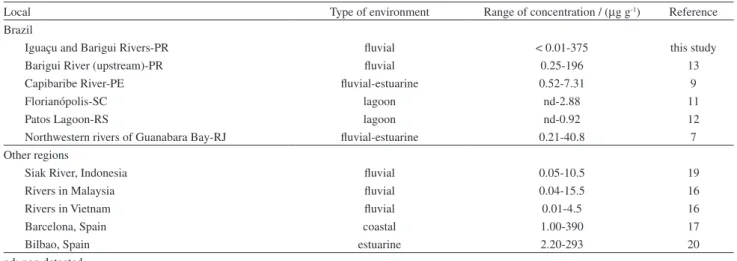
Table 2. Coprostanol concentration in sediments from several aquatic systems worldwide
Local Type of environment Range of concentration / (µg g-1) Reference
Brazil
Iguaçu and Barigui Rivers-PR fluvial < 0.01-375 this study
Barigui River (upstream)-PR fluvial 0.25-196 13
Capibaribe River-PE fluvial-estuarine 0.52-7.31 9
Florianópolis-SC lagoon nd-2.88 11
Patos Lagoon-RS lagoon nd-0.92 12
Northwestern rivers of Guanabara Bay-RJ fluvial-estuarine 0.21-40.8 7
Other regions
Siak River, Indonesia fluvial 0.05-10.5 19
Rivers in Malaysia fluvial 0.04-15.5 16
Rivers in Vietnam fluvial 0.01-4.5 16
Barcelona, Spain coastal 1.00-390 17
Bilbao, Spain estuarine 2.20-293 20
nd: non detected.
Table 3. Diagnostic ratios among selected sterols and stanones
Sterol ratio Abbreviation Threshold level Reference
(i) Coprostanol/cholesterol cop/cholesterol > 0.2: contaminated > 1.0: highly contaminated
21
(ii) Coprostanol/(coprostanol + cholestanol) 5β/(5α+5β)sterol < 0.3: not contaminated > 0.7: contaminated
17
(iii) Coprostanone/(coprostanone/cholestanone) 5β/(5α+5β)stanone < 0.3: not contaminated > 0.7: contaminated
comparison to cholesterol. This suggests that in the Winter, which is usually a dry season, the sewage presented an enhanced level of degradation, as the increased contribution of cholestanol might be derived from the bacterial reduction
of cholesterol and/or from autochthonous production.22 It is
noteworthy that the relative contribution of the C27 sterols
also suggested contamination by pig feces,23 which is an
important livestock in the studied region, in some stations of the Iguaçu River in both samplings (e.g., Ig3, Ig11, Ig14). In the other hand, in other stations (e.g., Ig2 and Ig8), the ratios were not similar between the two samplings, leading to inconclusive results. Moreover, Figure 5 also shows that in the Summer sampling (a wet period), the sterols in most samples from the Barigui River and stations Ig4 and Ig10
indicated the contribution of horse and cow feces.23 This
can be derived from the enhanced washout from areas of livestock farming activities in the local drainage basin during periods of increased rain. Station Ba4 is located near the indication of feces from dogs. However, the concentration of steroids in this sample is low and thus
the diagnostic for Ba4 is not relevant. Finally, stations Ig1 and Ig15 from the Summer sampling are distant from any potential sewage source, which resulted from their low concentration of coprostanol.
Conclusions
Steroids were used to identify the level and sources of sewage contamination on a regional scale in a fluvial system, information that is still scarce in Brazil. When compared to other river systems around the world, coprostanol concentrations in most samples obtained from two samplings at the Iguaçu and the Barigui Rivers were extremely high, indicating an elevated degree of sewage accumulation in the sediments. Besides the input of domestic effluents, the contamination may also arise from the washout of manure produced by livestock during the rainy season, in the Summer, in some sites. The higher level of sewage contamination in the Winter sampling, a dry period, suggested a small river ability to disperse and dilute the effluents in periods of reduced water flow. In this sense, the environmental health of river systems may be more affected by the input of sewage than coastal systems, where water renewal can be more effective.
Acknowledgements
The authors thank Petrobras (Petróleo Brasileiro S.A.) through the Presidente Getúlio Vargas Refinery for funding this research through a contract with Fundação de Apoio da Universidade Federal do Rio Grande do Sul. L. Puerari and
Figure 4. Diagnostic ratios of sewage contamination based on selected steroids: (a) coprostanol/cholesterol; (b) 5β/(5β+5α)stanol = coprostanol/coprostanol + cholestanol and 5β/(5β+5α)stanone (excluding sample Ig15). Bar: mean, box: standard-deviation and whisker: minimum and maximum. Dashed line in (b) represents the lower threshold value (0.7) suggesting contamination by sewage
Figure 5. Ternary plot of selected sterols from sediments collected in the two samplings. Values obtained by Leeming and Nichols23 for feces from
L. Albarello were supported by a Master fellowship from CAPES. A. Bastos Neto and R. Carreira are research fellows from CNPq. We also thank the constructive comments from an anonymous reviewer.
References
1. Huang, Q.; Yu, Y.; Tang, C.; Zhang, K.; Cui, J.; Peng, X.; J. Environ. Monitor.2011, 13, 855; Nakada, N.; Kiri, K.;
Shinohara, H.; Harada, A.; Kuroda, K.; Takizawa, S.; Takada, H.; Environ. Sci. Technol.2009, 42, 6347; Pratt, C.; Warnken, J.;
Leeming, R.; Arthur, J. M.; Grice, D. I.; Environ. Sci. Technol. 2007, 41, 792; Mudge, S. M.; Duce, C. E.; Environ. Pollut. 2005, 136, 209.
2. Isobe, K. O.; Tarao, M.; Chiem, N. H.; Min, L. Y.; Takada, H.; Appl. Environ. Microbiol.2004, 70, 814.
3. Leeming, R.; Ball, A.; Ashbolt, N.; Nichols, P.; Water Res.1996, 30, 2893.
4. Takada, H.; Eganhouse, R. P. In Encyclopedia of Environmental Analysis and Remediation; Meyers, R. A., eds.; John Wiley and
Sons, Inc.: New York, NY, USA, 1998; Vivian, C. M. G.; Sci. Total Environ.1986, 53, 5.
5. Bianchi, T. S.; Canuel, E. A.; Chemical Biomarkers in Aquatic Ecosystems; Princeton University Press: Princeton, NJ, USA,
2011; Eganhouse, R. P.; Molecular Markers in Environmental Geochemistry; American Chemical Society: Washington, USA,
1997.
6. Carreira, R. S.; Wagener, A. L. R.; Readman, J. W.; Estuarine Coastal Shelf Sci.2004, 60, 587.
7. Cordeiro, L. G.; Carreira, R. S.; Wagener, A. L. R.; Org. Geochem.2008, 39, 1097.
8. Martins, C. C.; Ferreira, J. A.; Taniguchi, S.; Mahiques, M. M.; Bícego, M. C.; Montone, R. C.; Mar. Pollut. Bull.2008, 56, 1359; Martins, C. C.; Braun, J. A. F.; Seyffert, B. H.; Machado, E. C.; Fillmann, G.; Mar. Pollut. Bull.2010, 60, 2137; Carreira, R. S.; Ribeiro, P. V.; Silva, C. E. M.; Farias, C. O.; Quim. Nova 2009, 32, 1805; Campos, V.; Fracácio, R.; Fraceto, L. F.; Rosa,
A. H.; Aquat. Geochem. 2012, 12, 234; Martins, C. C.; Bícego, M. C.; Figueira, R. C. L.; Angelli, J. L. F.; Combi, T.; Gallice, W. C.; Mansur, A. V.; Nardes, E.; Rocha, M. L.; Wisnieski, E.; Ceschim, L. M. M.; Ribeiro, A. P.; Sci. Total Environ.2012, 417-418, 158; Martins, C. C.; Seyffert, B. H.; Braun, J. A. F.;
Fillmann, G.; J. Braz. Chem. Soc.2011, 22, 1585.
9. Fernandes, M. B.; Sicre, M.-A.; Cardoso, J. N.; Macedo, S. J.; Sci. Total Environ.1999, 231, 1.
10. Araujo, M. P.; Costa, T. L. F.; Carreira, R. S.; Quim. Nova2011, 34, 64.
11. Mater, L.; Alexandre, M. R.; Hansel, F. A.; Madureira, L. A. S.; J. Braz. Chem. Soc.2004, 15, 725.
12. Martins, C. C.; Fillmann, G.; Montone, R. C.; J. Braz. Chem. Soc.2007, 18, 106.
13. Froehner, S.; Maceno, M.; Martins, R.; Environ. Monit. Assess. 2010, 170, 261.
14. Pasquini, A. I.; Depetris, P. J.; J. Hydrol.2007, 333, 385. 15. Clesceri, L. S.; Greenberg, A. E.; Eaton, A. D.; Standard
Methods for the Examination of Water and Wastewater, 20th ed; American Public Health Association: Washington, USA, 1999. 16. Isobe, K. O.; Tarao, M.; Zakaria, M. P.; Chiem, N.; Minh, L. Y.;
Takada, H.; Environ. Sci. Technol.2002, 36, 4497.
17. Grimalt, J. O.; Fernandez, P.; Bayona, J. M.; Albaiges, J.; Environ. Sci. Technol.1990, 24, 357.
18. González-Oreja, J. A.; Saiz-Salinas, J.; Mar. Pollut. Bull.1998, 36, 868.
19. Liebezeit, G.; Wöstmann, R.; Bull. Environ. Contam. Toxicol. 2010, 85, 585.
20. Gonzalez-Oreja, J. A.; Saiz-Salinas, J. I.; Estuarine Coastal Shelf Sci.1999, 48, 391.
21. Takada, H.; Farrington, J. W.; Botner, M. H.; Johnson, C. G.; Tripp, B. W.; Environ. Sci. Technol.1994, 28, 1062.
22. Nishimura, M.; Geochim. Cosmochim. Acta1982, 46, 423. 23. Leeming, R.; Nichols, P. D.; Water Res.1996, 30, 2997.
Submitted: August 21, 2012