832 Brazilian Journal of Physics, vol. 36, no. 3B, September, 2006
Surface Phonons Modes: A Tool to Determine the Quantum Dot Morphology
Augusto M. Alcalde, Alessandra A. Ribeiro, No´elio O. Dantas,
Instituto de F´ısica, Universidade Federal de Uberlˆandia, 38400-902, Uberlˆandia, MG, Brazil
Djalma R. Mendes Jr.,
Instituto de F´ısica, Universidade de S˜ao Paulo, 05315-970, S˜ao Paulo, SP, Brazil
Gilmar E. Marques,
Departamento de F´ısica, Universidade Federal de S˜ao Carlos, 13565-905, S˜ao Carlos, SP, Brazil
and Carlos Trallero-Giner
Departamento de F´ısica Te´orica, Universidad de la Habana, Vedado 104000, Havana, Cuba
Received on 8 December, 2005
We report here theoretical and experimental studies on the spatial confinement of phonons in ternary CdSxSe1−xnanocrystals embedded in a glass matrix formed by the composites SiO2-Na2CO3-B2O3-Al2O3
doped with CdO, S and Se. We determined the morphologic characteristics of the nanocrystals by analyzing the dependence of surface phonon modes on the geometrical parameters. The calculated frequencies are compared with values from Raman spectra of CdSxSe1−xnanocrystals grown under different thermal treatments. A good
correlation between experimental and calculated CdS-like and CdSe-like surface optical modes is observed. Raman selection rules and their connection with the nature of the surface optical phonons is discussed. Keywords: Quantum dots; Raman scattering
The quantum confinement effects on the optical prop-erties of nanocrystallites or quantum dots (QD’s) grown over semiconductor-doped glasses are subject of current re-searches. The interest in these materials arises from their great potential for use in device applications due to their nonlinear optical properties. Experimental and theoretical studies show-ing the confinement effects on the QD electronic states and their energy levels are now well established. Nonetheless, the size effects on their phonon modes and on the electron-phonon interaction are still somewhat controversial. In this theoretical scenario, one aspect has not yet been sufficiently addressed: how the geometrical shape effects can modify the electronic structure and other physical properties in small QD’s. In II-VI QD’s, the morphological effects can modify the energies, symmetry properties of the wave functions and, thus, their op-tical transitions.
In this work, we explore theoretically and experimen-tally the connection between the surface optical (SO) phonon modes and the geometrical shape of a semiconductor QD. By analyzing the behavior of SO modes in ternary alloy based QD’s, we may determine the alloy composition fluctuation and the geometrical parameterr, that measures the degree of deviation from sphericity. To do this, we have extended the Comaset al. [1] model for binary spheroidal dots to study ternary alloys ofA11−xA2xBQD type. Thus, we calculated the dependence of theA1B-like andA2B-like SO-modes as a func-tion ofxandr. Our extended theory recovers the binary com-pound limits x→0 and x→1 of Ref. [1] and verifies the conditionsωTO<ωSO<ωLO.
Samples were prepared over the glass matrix SiO2-Na2CO3-B2O3-Al2O3doped with CdO, S and Se. The mix-ture was melted in an aluminum crucible at 1200◦C, for 2h. Then, it was quickly cooled down to room temperature. In
or-der to enhance the diffusion of the Cd2+, S2−, and Se2−ions,
we have performed 600◦C thermal treatments on each sam-ples using different annealing times ofta=3, 5, 6, 10, 12, 14, 16, 18, 20, and 22 h, respectively. As a result of these ther-mal treatments, the QD’s of CdSxSe1−x are formed over the glass matrix. The QD Raman spectra were recorded at room temperature. An argon-ion laser operating at 100 mW with the lineλ=514 nm was used for the Raman scattering. Fi-nally, the scattered light was collected in the back scattering geometry, using a Jobin-Yvon triple spectrometer.
Owing to the small size in QD’s, the surface-to-volume ra-tio contribura-tion to the Raman spectrum is much higher than in bulk crystals. Therefore, in spheroidal nanocrystals sur-rounded by a glass matrix with a real frequency-independent dielectric constant(ε(ω)), one might expect Raman obser-vation of the SO-phonon modes with frequencies between the corresponding LO and TO bulk phonons frequencies. The main macroscopic quantities involved in the descrip-tion of polar-optical phonons are derived from the equadescrip-tion
ε(ω)∇2ϕ=0, whereϕis the electrostatic phonon potential.
For ternary alloys,ε(ω)can be calculated as [2]
ε(ω) =ε∞+
X1 ω2
T1−ω2
+ X2 ω2
T2−ω2
. (1)
Here, the subscript 1 (2) refers to the CdSe-like (CdS-like) modes. The polarizability parameters for the two TO-modes can be written as
X1= (1−x)ε1∞(ω2L1,B−ω2T1,B), X2=xε2∞(ω2L2,B−ω2T2,B),
(2) where the subscriptB indicates that the phonon frequencies are those for binary compounds withε1∞andε2∞. The
Augusto M. Alcalde et al. 833
gives the LO frequencies of the CdS-like and CdSe-like modes as the roots of a quadratic function in ω2
LO(1,2) Note that these frequency-modes are size-independent since the dielec-tric function only contains information of the constituent ma-terials.
For the SO-phonons we need to solve the Laplace equa-tion ∇2ϕ=0, where the solutions satisfy the usual electro-static boundary conditions between two different media. The main results of the formalism developed for spheroidal QD’s, in Ref. [1], can be summarized in the following equation
ε(ω) εD
=
µd
dξlnQ m
l |ξ0
¶ µd
dξlnR m
l |ξ0
¶−1
(3) Note that this is the formal expression for the electrosta-tic boundary conditions of prolate spheroidal QD’s with co-ordinatesξ≥1,−1≤η≤1, and 0≤ϕ≤2π. The condition ξ=constant, defines an ellipsoid of revolution with thez-axis pointing along the ellipsoid’s major axis. For 1≤ξ≤ξ0, we have a CdSxSe1−xQD with a dielectric constant,ε(ω), in the interior of the spheroid. The regionξ≥ξ0defines the glass matrix with dielectric constant εD. The set of functionsQml andRml, in Eq. (3), are related with the solutions of the Laplace equation for theξ≥ξ0andξ≤ξ0regions, respectively. The vibrational quantum numbers are given byl=1,2,3, . . .and
|m| ≤l(see Ref. [1] for further details). In addition, the limit 1/ξ0→0 represents the purely spherical situation expressed asε(ω) =−εD(l+1)/l. Note that the right side of Eq. (3) de-pends on the QD geometrical shape through the spatial para-meterξ0. The information about the nature of the constituent material is entirely contained in the dielectric functions.
We calculate the SO frequencies by solving Eq. (3) for a ternary compound dielectric function as defined in Eq. (1). In perfectly spherical QD’s the SO frequencies are independent of the dot-size. However, for spheroidal QD’s the SO-modes show appreciable variation with the size and the geometrical shape. In both cases, these modes depend strongly on the con-centrationx.
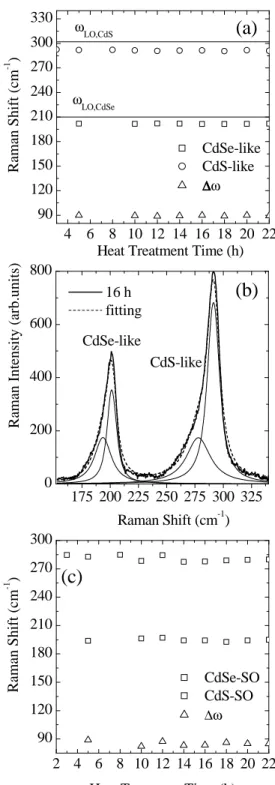
In Fig. 1(a) we show the measured peak positions or Raman shift corresponding to the CdS-like and CdSe-like LO modes for different heating treatment times of the QD’s. Experimen-tal evidence confirm a clear tendency of increasing dot-size distribution when the heating time is increased (for a general review of growth processes see Ref. [3]). Fig. 1(b) shows the Raman profile for ternaryCdSSeQD with heating time of 16 h. The presence of the expected SO-modes is clearly revealed by the asymmetry of Raman band with a tail towards lower energies and by the small red-shift of the peaks energies. On the other hand, the clear presence of surface phonons reveals, without ambiguity, the formation of QD’s in the glass matrix, as these modes only appear as consequence of the strong spa-tial confinement.
We also show on Fig. 1(a) the difference∆ω between the CdS- and CdSe-like frequency modes. It is noted that these modes show an negligible dependence with the dot-size. The small frequency variation on∆ω corresponding to±2 cm−1 can be attributed to strain or small spatial confinement effects on the phonon modes [4]. The positions of the peaks corre-sponding to the SO-modes, as a function of the heating times,
4 6 8 10 12 14 16 18 20 22
90 120 150 180 210 240 270 300 330
175 200 225 250 275 300 325 0
200 400 600 800
2 4 6 8 10 12 14 16 18 20 22 90
120 150 180 210 240 270 300
(a)
ωLO,CdSe
R
am
an
S
h
if
t
(c
m
-1 )
Heat Treatment Time (h) CdSe-like CdS-like
∆∆∆∆ω ωLO,CdS
CdS-like
R
am
an
I
n
te
n
si
ty
(
ar
b
.u
n
it
s)
Raman Shift (cm-1) 16 h
fitting
CdSe-like
(b)
R
am
an
S
h
if
t
(c
m
-1 )
Heat Treatment Time (h) CdSe-SO CdS-SO
∆ω
(c)
FIG. 1: (a) Experimental Raman shift for CdS- and CdSe-like LO-modes after different heating times. Solid lines show LO and TO bulk frequencies. (b) Raman profile for a ternary CdSSe QD with annealing timeta=16 h. (c) Same as in (a) for CdS and
CdSe-like SO-modes. The triangles, in (a) and (c), show∆ω=ωCdS LO,SO− ωCdSe
834 Brazilian Journal of Physics, vol. 36, no. 3B, September, 2006
0.2 0.4 0.6 0.8 50
100 150 200 250 300
R
am
an
S
h
if
t
(c
m
-1 )
x concentration
CdSe-like CdS-like
∆ω
Ref. [6]
FIG. 2: CdS- and CdSe-like phonon modes calculated fromε(ω) =0. The frequency difference∆ωis displayed in dashed-dotted lines. The dotted lines represent the phenomenological relation, x=0.020∆ω -1.29, taken from Ref. [6]. The arrow indicates the approximate value of the concentrationx.
are presented in Fig. 1(c). The set of data points labeled as ∆ω represents the difference between the CdS and SO-CdSe modes. It is noted that the SO modes are sensitive to dot-size change. Considering that purely spherical QD’s do not have size dependent phonon frequencies, we can conclude that the shape of the nanocrystals are deviating from spherical to ellipsoidal-like.
Next, we compare the experimental data with our theoret-ical results in order to determine the mean value of the con-centrationxand the degree of deviation from a pure spherical shape. To estimate the LO and SO frequencies of the ternary CdSxSe1−xnanocrystals we analyze the frequency TO-modes of CdSe-like and CdS-like phonons, that vary nearly linearly with concentration x, from ωT O,1=168+17x cm−1, and ωT O,2=266−28xcm−1. The LO and TO frequencies for binary CdSe and CdS compounds are ωLO,1=210 cm−1, ωLO,2=302 cm−1, ωT O,1=168 cm−1, and ωT O,2 =238 cm−1[5]. The dielectric constants areε∞,1=1.61,ε∞,2=5.32 while for the host material, we are takingεD=2.25 [4]. Fig-ure 2 shows the calculated frequencies for CdSe-like and CdS-like TO modes as a functions of the concentrationx. The line labeled∆ωrepresents the difference between these modes. A simple quadratic fit shows that the relation between∆ωand x, is given by∆ω=57.64+98.6x−40.31x2. For comparison purposes we are showing, in dotted line, the best fit obtained by Miyoshi et al.[6] from their analysis of Raman scatter-ing data for several concentrationsx. By comparing the ex-perimental data presented in Fig. 1(b) with the theoretical re-sults of Fig. 2 we obtain the difference∆ω, as approximately 89.0±2.0 cm−1. This value corresponds to a concentration x=0.39±0.02. Moreover, a large systematic error exists when using only one single mode to determine the compo-sition, since strain and phonon confinement effects displaces the CdS-like and CdSe-like modes in the same direction. In
182 184 186 188 190
1
0 2
1
0
CdSe-SO, x=0.39
S
u
rf
ac
e
m
o
d
es
f
re
q
u
en
cy
(
cm
-1 )
l=1 l=2 l=3
(a)
0.0 0.2 0.4 0.6 0.8 1.0
262 264 266 268 270 272
274
(b)
2
0 0
S
u
rf
ac
e
m
o
d
es
f
re
q
u
en
cy
(
cm
-1 )
1/ξ0
l=1 l=2 l=3
CdS-SO, x=0.39
1 1
FIG. 3: (a) CdSe-SO frequencies as a function ofξ−01forl=1,2,3 for all possible values of quantum numbermof a prolate ellipsoidal QD. (b) Same for CdS-SO modes. The calculations were performed withx=0.39.
contrast, the compositional change causes them to shift in op-posite directions. In order to reduce the systematic error we are using the difference between the two modes (CdS-like and CdSe-like) to determined the concentration x. These argu-ments can also be applied to the SO-mode case to determine the geometric characteristics of the QD’s.
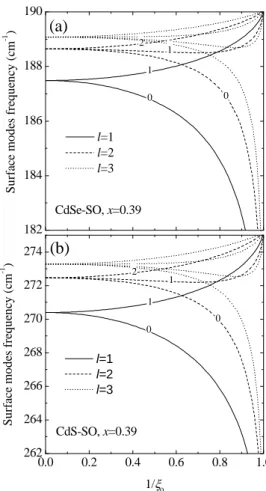
The dependence with the spatial parameterξ0for the CdS and CdSe SO frequencies of QD’s,calculated forx=0.39, is shown on Figs. 3(a) and 3(b). We consider the modes with l =1,2,3. The numbers over the lines indicate the corre-sponding quantum numberm. The limitξ−1
par-Augusto M. Alcalde et al. 835
0.0 0.2 0.4 0.6 0.8 1.0
80.5 81.0 81.5 82.0 82.5 83.0 83.5 84.0 84.5
∆ω
(
cm
-1 )
1/ξ
0
l=2,m=0 l=4.m=0
SO modes, x=0.39
FIG. 4: Frequency difference for CdS and CdSe SO as a function of the spatial parameterξ−1
0 , forl=2,m=0- andl=4,m=0-modes.
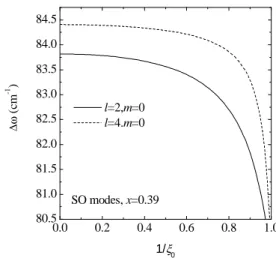
ticipation ofl=1-modes. In order to analyze the geometric properties of the QD, we will restrict our attention only to the selection rulel=even,m=0. Fig. 4 shows the dependence between the difference of the CdS and CdSe SO frequencies with the spatial parameter ξ0, for thel =2,m=0 and for l=4,m=0 cases.
Let us compare our theoretical results for the samples in Fig. 1(c), with heating times: 16 h (∆ωSO=83.56 cm−1), 14 h(∆ωSO=83.20 cm−1)and 10 h(∆ωSO=82.14 cm−1). The corresponding parametersξ0and ellipsoid’s semiaxis ra-tior=ξ0(ξ2
0−1)−1/2for thel=2,m=0 SO-modes are: (i) for the sample with 16 h of heating treatment, we obtained ξ0=2.04 andr=1.14; (ii) for the one withta=14 h we have
ξ0=1.49 andr=1.34; (iii) for 10 h of heat treatment we have gottenξ0=1.14 andr=2.08. Important points can be de-rived from these results: a) for thel=2 SO-modes, when the deviation of the spherical shape increases the difference be-tween the SO frequencies(∆ωSO) diminishes. b) These QD’s present strong deviations from the spherical shape. For in-stance, forl=2,m=0 we obtain semi-axis ratio in the inter-val: 1.14≤r≤2.18. c) The large size QD’s (large heating time treatments) present shapes closer to spherical geometry, onceris decreasing with increasing heating time. The sam-ples with(∆ωSO=84.50cm−1)have not been considered; this large energy difference would suggest that SO modesl=1 are excited in the Raman process. Although these modes are for-bidden for the Raman selection rules in non-spherical shapes, they can be excited by the presence of impurities or defects created during the nucleation process. In general, modes with l>2 present small contribution to the Raman response and have not been thoroughly considered in the present analysis.
In conclusion, we have performed Raman spectra measure-ments where the presence of surface modes associated to CdS-like and CdSe-CdS-like phonon branches is observed. The frequen-cies of these modes are dependent on the concentrationxand on the time of thermal treatment; these results suggest that the quantum dots are not perfectly spherical in shape. We com-pared our theoretical results with experimental Raman spectra and determined the molar concentration of our samples to be x=0.39. In addition, the shape of the QD’s exhibits a very strong deviation from the spherical geometry with a range of 1.14≤r≤2.18 for the selected set of samples.
Authors acknowledge financial support from the agencies: Conselho Nacional de Desenvolvimento Cientfico e Tecnol-gico (CNPq) and Fundac¸ ˜ao de Amparo `a Pesquisa do Estado de Minas Gerais (FAPEMIG).
[1] F. Comas, C. Trallero-Giner, N. Studart, and G. E. Marques, Phys. Rev. B65073303 (2002).
[2] K. J. Nash, M. S. Skolnick, and S. J. Bass, Semicond. Sci. Tech-nol.2329 (1987).
[3] U. Woggon,Optical Properties of Semiconductor Quantum Dots, Springer, Berlin, 1997.
[4] A. V. Gamonnai, Yu. M. Azhniuk, V. O. Yukhymchuck, M.
Kran-jcec, and V. V. Lopushansky, Phys Stat. Sol (b)239490 (2003). [5] A. Ingale and K. C. Rustagi, Phys. Rev. B587197 (1998). [6] T. Miyoshi, T. Nakatsuka, and N. Matsuo, Japn. J. Appl. Phys.
341835 (1995).