MICROCLIMATIC CHANGES CAUSED BY DIFFERENT PLASTIC COVERINGS IN
GREENHOUSES CULTIVATED WITH CHERRY TOMATO IN SOUTHERN BRAZIL
ESTER HOLCMAN
1, PAULO C. SENTELHAS
1, SIMONE DA C. MELLO
21
University of São Paulo, Agricultural College “Luiz de Queiroz” (USP/ESALQ), Department of
Biosystems Engineering, Piracicaba/SP, Brazil
2USP/ESALQ, Department of Crop Science, Piracicaba, SP, Brazil
esterholcman@yahoo.com.br, pcsentel.esalq@usp.br, cmello@usp.br
Received July 2014 - Accepted October 2014
ABSTRACT
In regions with intense solar radiation it is common the use of aluminated covers in greenhouses, with the aim of reducing the inside temperature. However, the use of these covers reduces photosynthetic active radiation (PAR) transmitted into the greenhouse. The objective of the present study was to evaluate the inluence of different covers on microclimate in greenhouses cultivated with cherry tomato during three growing seasons. The environment I was covered with plastic ilm anti-UV and with thermo-relective screen (40%) disposed internally. The environment II was covered with diffusive plastic ilm (55%). The transmitted solar radiation to the interior of covered environments was, on average, 5.5 MJ m-2 day-1 in the environment I and 8.2 MJ m-2 day-1 in environment II. The air temperature in environment II was, on average, 1°C higher than external conditions. The highest difference for the relative humidity (RH) was also observed between environment II and the outside conditions, with 10.7% for the minimum RH during the irst growing period. Considering all growing periods, the diffusive plastic ilm provided higher solar energy availability inside the greenhouse than the plastic ilm with thermo-relective screen, without causing major changes in air temperature and relative humidity, and promoting greater productivity of tomato grown under this environment for the three periods evaluated. Keywords: greenhouses; plastic covers; microclimate.
RESUMO:ALTERAÇÕES MICROCLIMÁTICAS PROVOCADAS POR DIFERENTES COBERTURAS PLÁSTICAS EM AMBIENTE PROTEGIDO CULTIVADO COM TOMATE TIPO CEREJA NO SUDESTE DO BRASIL
1. INTRODUCTION
The type of material used as covering in greenhouses has important role in deining the microclimate of them by changing the solar radiation lux density inside greenhouse, in accordance with the change of its transmissivity (Steidle Neto et al., 2006; Finch et al., 2004). Incoming solar radiation within greenhouses is always lower than that in an open sky surface, due to the processes of relection and absorption by the plastic coverings (Galvani, 2001; Guiselini, 2002). According to Sentelhas et al. (1999) and Serrano et al. (2001), the solar radiation transmissivity in greenhouses depends on the type, thickness, dust deposition, water condensation and level of degradation of the plastic used, as well as the orientation and shape of the coverage, the time of year and other structures, like bows, fence posts, irrigation canals, screens, etc. The reduction of solar radiation transmissivity due to the cover ranges from 5 to 40% (Serrano et al., 2001).
The characterization of greenhouse covers transmissivity is important since it affects other components of the energy balance, as the sensible and latent heat luxes, as well as the photosynthetic process (Pezzopane et al., 2004). Reduction of solar radiation, as a way to avoid high temperatures, implies directly in reducing photosynthetic active radiation (PAR) transmitted into the greenhouse. Therefore, it is important to have appropriate levels of shading, in order to avoid negative effects on plants (Faria Junior et al., 2000; Guiselini et al., 2007). So, the choice of the cover material of greenhouses is essential for optimizing crop production.
According to Buriol et al. (2000), air temperature is mainly inluenced by solar radiation lux density and wind speed, which depend on the area, location and management of the greenhouse (wall cover). While inside solar radiation affects the air temperature, wind speed determines the rate of sensible heat exchange between inside and outside of the greenhouse. The reduction of greenhouse air temperature is one of the main objectives in tropical regions, where high temperatures are commonly observed. To this end, shading screens are most used option (Serrano et al., 2001; Pandori, 2006).
Currently, new cover materials have been developed with the aim of promoting greater dispersion of solar radiation transmitted into the greenhouse. A plastic ilm is called as a diffusive when has such ability. A ilm is considered diffusive when its turbidity is equal to or greater than 30% for thicknesses between 70 and 150 μm and 35% for thicknesses equal to or greater than 150 μm. Depending on the composition of the diffusive plastic, the proportion of PAR that is transmitted into the greenhouse can be equal or even greater than those of a transparent ilm with the same characteristics (Serrano et al., 2001). Diffusive ilms are composed by microscopic particles that spread the light in all directions. During sunny
days, greenhouses covered with diffusive plastic ilm can have three to four times more diffuse radiation than outside (Baille et al., 2003). Thus, inside greenhouses, the shadow projection becomes less sharp than outside (Castilla, 2005).
Considering that the greenhouse cover has a major inluence on the microclimate for the crops, the objective of this study was to evaluate and compare the effects of different types of covers, diffusive plastic ilm and plastic ilm anti-UV associated with thermo-relective screen on temperature, relative humidity and solar radiation, and, consequently, on cherry tomato productivity.
2. MATERIALS AND METHODS
The ield experiments were carried out in the experimental area of the Department of Crop Science, at the Agricultural College “Luiz de Queiroz”, University of São Paulo (ESALQ/ USP), in Piracicaba, State of São Paulo, Brazil, located in the following geographic coordinates: latitude of 22º 42’ 40”S, longitude of 47º 37’ 30”W and altitude of 546 m.a.s.l. In accordance with the Köppen classiication, the climate of the region is Cwa, which means tropical humid with dry winter. Table 1 presents the climatic data of Piracicaba, for the period between 1997 – 2013.
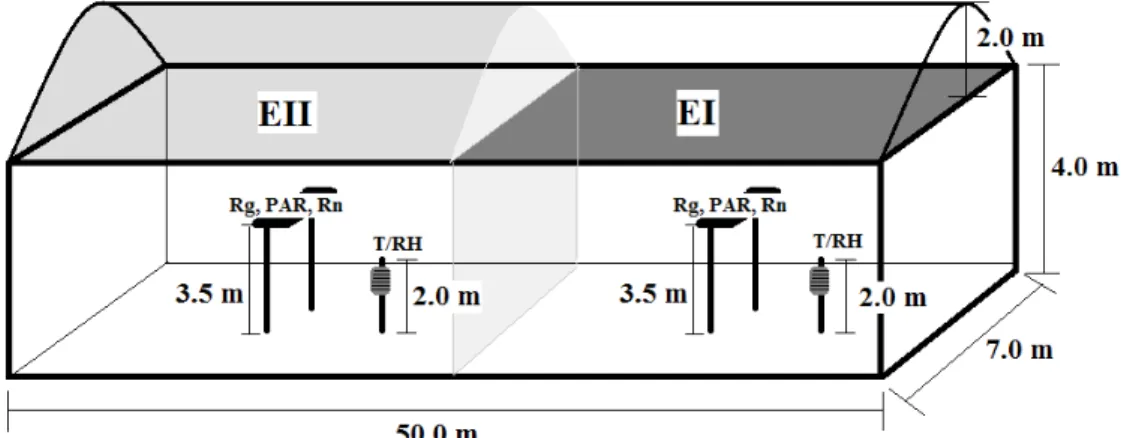
The experiments were conducted in a greenhouse with the following dimensions: 50-m length, 7-m width, 4-m height and oriented from NE to SW. This environment was subdivided in two equal parts, isolated by a transparent polyethylene of low density (LDPE) plastic ilm, of 0.15 mm of thickness. These two environments were covered with different materials: one was covered with an anti-UV plastic ilm associated with the thermo-relective screen (with 40% of shading mesh), installed internally at the ceiling height (environment I = EI); and another environment (environment II = EII) with a diffusive plastic ilm with 55% of diffusive capacity (Figure 1). The greenhouse’s walls were covered with black screens (with 50% of shading mesh), allowing lateral ventilation in both environments. Both the environments were cultivated with cherry tomato (Solanum lycopersicum var. cerasiforme).
Table 1 - Monthly climatic data for Piracicaba, SP, Brazil, for the period between 1997 and 2013.
T avg T max T min RH avg RH max RH min WS WS max R SR
mm MJ m-2
Jan 23.6 29.7 19.6 89.1 99.7 62.2 1.1 8.5 256.5 224.4
Feb 24.2 30.8 19.6 87.0 99.8 56.7 1.0 8.2 148.6 207.9
Mar 23.7 30.3 18.9 85.5 99.5 56.3 1.1 8.0 137.4 215.5
Apr 22.1 28.9 16.7 84.3 99.7 53.4 1.0 7.0 65.8 166.1
May 18.7 25.7 12.9 84.8 99.8 52.8 1.0 6.8 58.7 134.3
Jun 17.8 25.3 11.6 84.8 99.8 52.2 1.0 6.2 48.9 113.5
Jul 17.8 25.6 11.2 81.1 99.3 47.9 1.1 6.7 36.8 126.5
Aug 19.4 27.5 12.0 73.8 98.7 39.9 1.3 7.4 22.7 149.1
Sep 21.1 28.6 14.5 74.8 97.7 44.8 1.5 8.6 53.9 157.4
Oct 22.7 29.7 16.9 79.2 98.6 49.5 1.6 8.9 101.7 189.5
Nov 23.1 29.8 17.7 81.2 98.9 52.0 1.6 9.2 127.4 195.1
Dec 23.9 30.3 19.2 85.3 99.4 57.1 1.3 8.9 183.8 200.3
Total - - - 1242,2
-Average 21.5 28.5 15.9 82.6 99.2 52.1 1.2 7.9 - 173.3
Maximum 24.2 30.8 19.6 89.1 99.8 62.2 1.6 9.2 256.5 224.4
Minimum 17.8 25.3 11.2 73.8 97.7 39.9 1,0 6.2 22.7 113.5
°C % m s-1
Tavg = average air temperature; Tmax = maximum air temperature; Tmin = minimum air temperature; RHavg = average relative humidity; RHmax = maximum relative humidity; RHmin = minimum relative humidity; WS = average wind speed; WSmax = maximum wind speed; R = rainfall; SR = incoming solar radiation.
and adapted for measurements under plastic covers. The data were recorded every second and averages were computed every 15 minutes. Micrometeorological data were collected during the following growing seasons: from 28/08 to 30/09/08 (1st period); from 24/06 to 20/09/09 (2nd period); and from 12/09 to 06/12/10 (3rd period). These data were compared with the outside conditions, obtained from an automatic weather station located at 300 m from the experimental area. For each period separately, the meteorological averages were compared by Kruskal Wallis test (Assistat Software) and the results of tomato productivity were submitted to analysis of variance and comparison of averages (Tukey - 5%), with the GLM procedures of SAS (Statistical Analysis Software).
3. RESULTS AND DISCUSSION
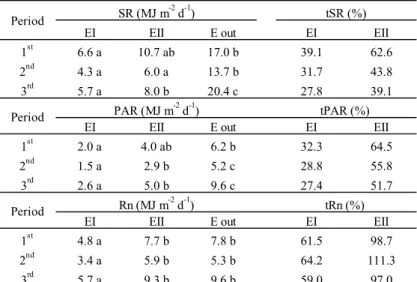
Table 2 presents the values of solar radiation measured in each studied environment. It was observed that, in the EII (diffusive plastic), SR, PAR and Rn were greater than those obtained in the EI (plastic anti-UV + thermo-relective screen). This fact occurred in all periods, due to plastic anti-UV to be associated with the shading screen, resulting in a signiicant reduction of the incoming solar radiation in EI. The diffusive plastic (EII) allowed greater incidence of solar radiation inside the greenhouse or transmitted SR (tSR).
According to the Table 2, a reduction in the solar radiation transmissivity by the coverings occurred over the three Figure 1 - Schematic representation of greenhouse with the following environments: Environment I (EI) = polyethylene anti-UV + thermo-relective
EI EII E out EI EII
1st 6.6 a 10.7 ab 17.0 b 39.1 62.6
2nd 4.3 a 6.0 a 13.7 b 31.7 43.8
3rd 5.7 a 8.0 b 20.4 c 27.8 39.1
EI EII E out EI EII
1st 2.0 a 4.0 ab 6.2 b 32.3 64.5
2nd 1.5 a 2.9 b 5.2 c 28.8 55.8
3rd 2.6 a 5.0 b 9.6 c 27.4 51.7
EI EII E out EI EII
1st 4.8 a 7.7 b 7.8 b 61.5 98.7
2nd 3.4 a 5.9 b 5.3 b 64.2 111.3
3rd 5.7 a 9.3 b 9.6 b 59.0 97.0
SR (MJ m-2 d-1) Period
Rn (MJ m-2 d-1) Period
Period
tSR (%)
PAR (MJ m-2 d-1) tPAR (%)
tRn (%)
Table 2 - Incoming solar radiation (SR), photosynthetically active radiation (PAR) and net radiation (Rn), and their respective transmissivity (tSR,
tPAR and tRn) in each studied environment: Environment I (EI) = polyethylene anti-UV + thermo-relective screen; Environment II (EII) = diffusive
plastic screen; and Outside conditions (E out) = meteorological station.
* For each period separately, averages followed by different letters in the same line differ statistically from each other (P < 0.05).
periods. This effect was observed from 1st to 2nd period (18.9% and 30.0% for EI and EII, respectively). From 1st to 3rd period this reduction was even higher, about 28.9% for EI and 37.5% for EII. This process occurred as a result of several factors. In the irst instance, the 1st period was conducted during the spring and early summer, while the 2nd period was conducted in the period of the autumn and winter and the 3rd period, during winter and spring. Therefore, the season of the year inluenced the transmissivity of the covers, which was also reported by Galvani (2001), who observed transmission of 70.8% in the winter and 75.0% in the summer for a transparent plastic ilm. The other factors to be considered are the age of the plastic ilms and the deposition of dust on them, which also causes reduction in their transmittance. Frisina and Escobedo (1999) observed a reduction of 20.4% in the transmittance of a low density polyethylene plastic ilm after six months of use. Pandori (2006) also noted a reduction of the plastic transmittance in greenhouses between two growing seasons, of about 4% in the greenhouse with the thermo-relective screen installed internally.
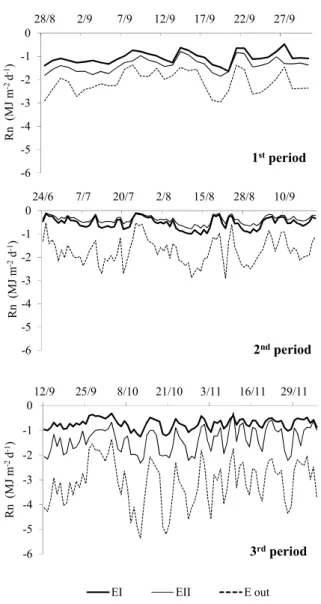
In relation to the outside environment, the Rn inside EII (diffusive plastic) was close to that observed externally (Table 2). This effect was due to the ability of the diffusive plastic to partially block the long wave radiation emitted by the surface and it was more pronounced along the 2nd period, when the internal Rn, on average, was higher than external Rn. During the day, the Rn in EI and EII was always similar, but smaller than the values observed outside. However, at night (Figure 2), the external Rn was more negative than under the two covers assessed, showing that the “greenhouse effect” was effective.
Therefore, when evaluating the daily averages of Rn, the outside values became smaller, because the higher magnitudes of the nighttime balance (more negative). Agreeing with the values observed in this experiment, Galvani (2001) reported that on days with low solar radiation (overcast), solar radiation balance are normally higher inside the greenhouses, because the effective long-wave emission is reduced, resulting in less negative Rn. Thus the daily radiation balance is, in general, greater inside greenhouses. However, in the present study, this effect was observed not only in the cloudy sky days, but also in the partly cloudy and clear sky days.
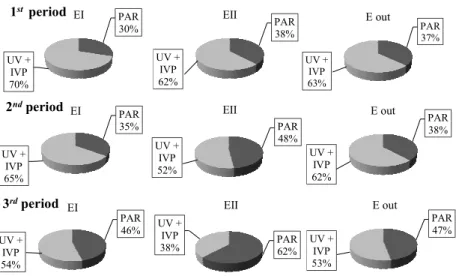
The solar energy availability in EII (diffusive plastic) was higher than in EI (plastic anti-UV + thermo-relective screen). Observing Figure 3, it is possible to see that, in the 1st period PAR was about 27% higher in EII than in EI. The PAR/SR in EII was very similar to outside greenhouse, in the irst period. In the 2nd and 3rd periods the conditions were different, having an increase of PAR inside greenhouse environments in relation to the outside.
-4 -3 -3 -2 -2 -1 -1 0
24/6 7/7 20/7 2/8 15/8 28/8 10/9
R n no tur n o ( M J m -2 d -1) 2° ciclo
EI EII E out
-6 -5 -4 -3 -2 -1 0
28/8 2/9 7/9 12/9 17/9 22/9 27/9
R n (M J m -2 d -1) -6 -5 -4 -3 -2 -1 0
24/6 7/7 20/7 2/8 15/8 28/8 10/9
R n (M J m -2 d -1)
2ndperiod
-6 -5 -4 -3 -2 -1 0
12/9 25/9 8/10 21/10 3/11 16/11 29/11
R n (M J m -2 d -1)
1stperiod
3rdperiod
Figure 2 - Nocturnal net radiation (Rn) over the three evaluated
periods in the Environment I (EI) = polyethylene anti-UV + thermo-relective screen, Environment II (EII) = diffusive plastic screen, and
outside (E out).
Table 3 presents the relationship between the daily values of weather variables SR, PAR and Rn measured inside the greenhouses and outside during the three evaluated periods. The determination coeficients were very high in both environments in the majority of the cases (r² > 0.97), except for EI during the 2nd period for SR and PAR.
The angular coeficients observed in Table 3 are very similar to the average transmissivity shown in Table 2, with the EII presenting a solar radiation transmissivity higher than EI. These coeficients also showed that there was a reduction of transmissivity from one period to another, as mentioned previously.
Typically, inside the greenhouses the air temperature is higher than outside (Galvani, 2001; Guiselini, 2002; Guiselini and Sentelhas, 2004; Guiselini et al., 2007). This
was also observed in the present study (Table 4); however the temperature differences, for maximum, minimum and averages values, were very small which is probably associated to the ceiling height and use of screens in the walls, favoring the air circulation, resulting in less accumulation of sensible heat nearby the sensors. Caliman et al. (2005) also reported similar results in terms of daily minimum and average temperatures between plastic greenhouses and outside conditions. In the present study, the EII (diffusive plastic) presented the highest average value, since it allowed the greatest transmissivity of solar radiation into the greenhouse. So, in this environment, more solar energy was converted into sensible heat flux, resulting in higher average temperatures, about 1.0°, 0.4° and 1.5°C higher than outside respectively for the 1st, 2nd and 3rd periods evaluated. Only in the 3rd period the EI presented a bit more pronounced difference in temperature, which was a function of the plastic age and deposition of dust on it. It means that the plastic absorbed a larger portion of intercepted solar radiation, transferring the captured energy into the greenhouse as long wave and heat.
The largest differences between greenhouses and outside occurred for maximum temperature (Table 4). This usually occurs due to the plastic covers act as a physical barrier to the Table 3 - Relationship between incoming solar radiation (SR), photosynthetically active radiation (PAR), net radiation (Rn) observed
inside Environment I (EI) = polyethylene anti-UV + thermo-relective
screen; Environment II (EII) = diffusive plastic screen; and outside (E out) the greenhouses.
b R²
EI x E out 0.4216 0.9902
EII x E out 0.6714 0.9760
EI x E out 0.3331 0.7458
EII x E out 0.4356 0.9753
EI x E out 0.2764 0.9961
EII x E out 0.3976 0.9701
EI x E out 0.2173 0.9799
EII x E out 0.3466 0.9719
EI x E out 0.2857 0.6912
EII x E out 0.5514 0.9479
EI x E out 0.2721 0.9710
EII x E out 0.5100 0.9386
EI x E out 0.5874 0.9334
EII x E out 10.110 0.9634
EI x E out 0.6075 0.9226
EII x E out 10.585 0.9416
EI x E out 0.5632 0.9885
EII x E out 0.9224 0.9844
PAR 30% UV + IVP 70% EI PAR 38% UV + IVP 62% EII PAR 37% UV + IVP 63% E out PAR 35% UV + IVP 65% EI
2ndperiod
PAR 48% UV + IVP 52% EII PAR 38% UV + IVP 62% E out PAR 46% UV + IVP 54% EI
3rdperiod
PAR 62% UV + IVP 38% EII PAR 47% UV + IVP 53% E out
1st period
Figure 3 - Partition of global solar radiation (SR) in photosynthetic active radiation (PAR), ultraviolet radiation and near-infrared (UV + IVP) in
the Environment I (EI) = polyethylene anti-UV + thermo-relective screen, Environment II (EII) = diffusive plastic screen, and outside conditions
(E out) for the three periods.
0 5 10 15 20
28/8 4/9 11/9 18/9 25/9
P A R ( M J m -2 d -1)
EI EII E out
0 5 10 15 20
24/6 8/7 22/7 5/8 19/8 2/9 16/9
P A R ( M J m -2 d -1)
EI EII E out
0 5 10 15 20
12/9 26/9 10/10 24/10 7/11 21/11 5/12
P A R ( M J m -2 d -1)
EI EII E out
0 7 14 21 28 35
28/8 4/9 11/9 18/9 25/9
S R ( MJ m -2 d -1)
1stperiod
0 7 14 21 28 35
24/6 8/7 22/7 5/8 19/8 2/9 16/9
S R ( M J m -2 d -1)
2ndperiod
0 7 14 21 28 35
12/9 26/9 10/10 24/10 7/11 21/11 5/12
SR ( M J m -2 d -1)
3rdperiod
Figure 4 - Availability of global solar radiation (SR) and photosynthetic active radiation (PAR) during the three evaluated periods in: Environment
I (EI) = polyethylene anti-UV + thermo-relective screen, Environment II (EII) = diffusive plastic screen, and outside conditions (E out).
air convection, “imprison” the sensible heat lux inside. Note that the largest differences in relation to outside condition occurred for the maximum temperature in the EII (diffusive plastic), with 1.5°, 1.2° and 1.8°C above external temperature, respectively, in the 1st, 2nd and 3rd period. This increase, as mentioned before, depends on several factors, which combined can result in very extreme conditions, as observed in the study of Shirahigi (2009) where inside average temperature was 8.5°C higher than outside.
The average values of RH in both greenhouses were slightly lower than those found outside, on average, 1.9% and 4.4% in EI and EII, respectively. Similar results were observed by Pandori (2006), who registered RH differences of 2.5%
to 3.6% between greenhouses and external conditions, while Rocha (2007) observed differences of 7.5%. Comparing the two greenhouse environments, the diffusive plastic (EII) promoted the lower RH values over the evaluated periods for having higher air temperature.
EI EII E out EI EII E out EI EII E out Average T 19.3 a 20.2 a 19.2 a 19.2 a 19.5 a 19.1 a 23.2 ab 24.0 b 22.5 a Maximum T 29.7 ab 31.1 b 29.6 a 26.4 a 27.1 a 25.9 a 29.6 a 31.1 b 29.3 a Minimum T 17.7 a 18.6 a 17.7 a 13.7 a 14.0 a 13.7 a 17.4 a 18.3 a 17.0 a Average RH 75.6 ab 72.2 a 77.1 b 87.2 a 85.8 a 88.2 a 74.4 a 73.4 a 76.5 a Maximum RH 99.1 a 98.7 a 99.6 a 100.0 a 100.0 a 100.0 a 97.5 a 97.4 a 97.7 a Minimum RH 41.7 b 37.3 a 48.0 c 60.7 a 58.6 a 65.7 b 44.3 a 43.2 a 49.4 b
Variable
Periods
1st 2nd 3rd
Table 4 - Air temperature (T, ºC) and relative humidity (RH, %) observed inside Environment I (EI) = polyethylene anti-UV + thermo-relective
screen; Environment II (EII) = diffusive plastic screen; and outside (E out) the greenhouses.
* For each period separately, averages followed by different letters in the same line differ statistically from each other (P < 0.05)
conditions in relation to minimum RH, which was due to the increase in the inside maximum temperatures. Guiselini and Sentelhas (2004) observed that the minimum RH during the daytime period was inluenced by the plastic covers, because during the day the saturation water vapor pressure (es) inside the greenhouses reached values above those observed outside, which resulted in a lower RH, even with an increase of actual vapor pressure (ea) caused by the retention of water vapor by the plastic cover (Buriol et al., 2000; Furlan, 2001; Viana, 2000).
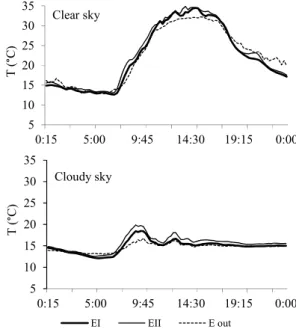
The daily variation of average air temperature (°C) over the three tomato growing seasons showed very similar results, except for days from 9/19/08 to 9/23/08 in the 1st period, in which the outside average temperatures were far below to those observed inside the greenhouses. From this atypical period, two days were selected for evaluating hourly air temperature (Figure 5). It was observed that from 8:00 am to 4:00 pm occurred the largest differences between the outside and inside temperatures, reaching a maximum of 3.0°C in EI (plastic anti-UV + thermo-relective screen) and 5.7°C in EII (diffusive plastic). In a cloudy sky day, the difference between the outside and inside temperatures decreased with a maximum of 2.7°C in EI (plastic anti-UV + thermo-relective screen) and 4.2°C in EII (diffusive plastic) at 9:00 am. During overcast days, when the solar radiation is lower, differences between inside and outside temperatures is also lower, which is consistent with the results presented by Pandori (2006), which showed that under this condition air temperature inside greenhouses remain close to the outside.
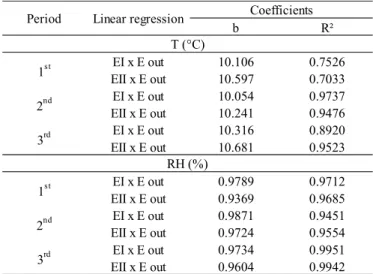
Table 5 presents the relationship between outside and inside temperatures of each studied environment. The angular coeficients of the equations are always very close to one, which leads to the conclusion that air temperature inside the greenhouses were very similar to outside during all periods, with a maximum difference of around 7%. Pandori (2006) analyzing the angular coeficients of the relationship between outside
and inside temperatures with thermo-relective screen installed internally found increases of about 7%. Table 5 also presents the relationship between outside and inside RH. According to the magnitude of the angular coeficients of the linear equations for each environment and period, the RH inside greenhouses were always lower than outside, with the largest differences occurring in EII (diffusive plastic), due to its higher temperatures.
It is possible to observe that the tomato productivity (Table 6) were signiicantly different between the environments. In the environment II, tomato plants were more productive than those grown under environment I. The excessive shading in the environment I, caused by the plastic anti-UV associated to Figure 5 - Hourly average air temperature every 15 minutes during
days of clear sky (9/19/08) and cloudy sky (9/21/08) conditions in the 1st period, being: Environment I (EI) = polyethylene anti-UV +
thermo-relective screen; Environment II (EII) = diffusive plastic screen and
outside conditions (E out).
T
d
o ar
(
°
C)
EI EII E out
5 10 15 20 25 30 35
0:15 5:00 9:45 14:30 19:15 0:00
T (
°
C
)
Cloudy sky 5
10 15 20 25 30 35
0:15 5:00 9:45 14:30 19:15 0:00
T (
°
C)
4. CONCLUSION
The available solar energy in the greenhouse covered with diffusive plastic was greater than those obtained under the anti-UV ilm with thermo-relective screen. The same pattern was observed for PAR and Rn in all of the evaluated periods. Despite this fact, the values of temperature and relative humidity inside the greenhouse covered with diffusive plastic were very similar to outside conditions, reaching small differences, on average, 1.8°C above the outside temperature and 4.4% lower than external RH. The diffusive plastic promoted a higher cherry tomato productivity, for the three periods evaluated when compared to the anti-UV ilm with thermo-relective screen. Based on that, the main conclusion of this study is that the use of diffusive plastic screen in greenhouses can be recommended to regions where high temperatures occur, since it provides a better inside distribution of solar energy without causing major changes in air temperature and relative humidity, resulting in higher tomato productivity.
5. ACKNOWLEDGEMENTS
The authors are grateful to `Polysack Plastic Industries Ltda’ for supplying the shading screens and to ‘São Paulo Research Foundation – FAPESP’ for supporting this project (Process n°: 2008/58624-1) and the irst author with a master scholarship (Process n°: 2007/57897-1).
6. REFERENCES
BAILLE, A.; LÓPEZ, J.C.; CABRERA, J.; GONZALEZ-REAL, M.M.; PÉREZ-PARRA, J. Characterization of the solar diffuse component under “parral”type greenhouses. Acta Horticulturae, Leuven, n. 614, p. 341-346, 2003. BURIOL, G.A.; RIGHI, E.Z.; SCHNEIDER, F.M.; STRECK,
N.A.; HELDWEIN, A.B.; ESTEFANEL, V. Modiicação da umidade relativa do ar pelo uso e manejo da estufa plástica. Revista Brasileira de Agrometeorologia, Santa Maria,v. 8, n. 1, p. 11-18, 2000.
CALIMAN, F.R.B.; SILVA, D.J.H.; FONTES, P.C.R.; STRINGHETA, P.C.; MOREIRA, G.R.; CARDOSO, A. A. Avaliação de genótipos de tomateiro cultivados em ambiente protegido e em campo nas condicoes edafoclimaticas de Vicosa. Horticultura Brasileira, Brasilia, v. 23, n. 2, p. 255-259, 2005.
CASTILLA, N. Invernaderos de plástico: tecnologia y manejo. Madrid: Mundi-Prensa, 2005. 462 p.
FARIA JUNIOR, M.J.A.; SOUZA, R.A.R. de; HORA, R.C. da. Cultivo de alface em ambiente protegido, sob diferentes níveis de sombreamento, em duas épocas de plantio. Horticultura Brasileira, Brasília, v. 18, p. 232-233, 2000. FINCH, D.A.; BAILEY, W.G.; MCARTHUR, L.J.B.;
NASITWITWI, M. Photosynthetically active radiation regimes in a southern African savanna environment. Agricultural and Forest Meteorology, Amsterdam, v. 122, p. 229-238, 2004.
FRISINA, V.A.; ESCOBEDO, J.F. Balanço de radiação e energia da cultura de alface em estufa de polietileno. Pesquisa Agropecuária Brasileira, Brasília, v. 34, n. 10, p. 1775-1786, 1999.
FURLAN. R.A. Avaliação da nebulização e abertura de cortinas na redução da temperatura do ar em ambientes protegidos. 2001. 146 p. Tese (Doutorado em Irrigação
Period CV (%)
1st 5.11 a
2nd
3rd 5.21
EI 3.25 b
Table 6 - Average productivity of tomato plants in each studied environment, in three periods, being: Environment I (EI) = polyethylene
anti-UV + thermo-relective screen and Environment II (EII) = diffusive
plastic screen.
* For each period separately, averages followed by different letters in the same column differ statistically from each other (P < 0.05).
b R²
EI x E out 10.106 0.7526
EII x E out 10.597 0.7033
EI x E out 10.054 0.9737
EII x E out 10.241 0.9476
EI x E out 10.316 0.8920
EII x E out 10.681 0.9523
EI x E out 0.9789 0.9712
EII x E out 0.9369 0.9685
EI x E out 0.9871 0.9451
EII x E out 0.9724 0.9554
EI x E out 0.9734 0.9951
EII x E out 0.9604 0.9942
2nd
3rd 1st
2nd
RH (%) 3rd
1st
Period Linear regression Coefficients
T (°C)
Table 5 - Relationship between air temperature (T) and relative humidity (RH) observed inside Environment I (EI) = polyethylene
anti-UV + thermo-relective screen; Environment II (EII) = diffusive
plastic screen; and outside (E out) the greenhouses.
Prod. (kg pl-1) CV (%) R2
1 EII 5.11 a 22.18 0.606
3.41 b
2 EII 4.33 a 7.26 0.910
3.06 b
3 EII 4.79 a 5.21 0.932
EI 3.25 b
CV (%)
1 EII 5.11 a
EI
2 EII
EI
3 EII 5.21
EI 3.25 b
e Drenagem) - Escola Superior de Agricultura “Luiz de Queiroz”, Universidade de São Paulo, Piracicaba, 2001. GALVANI, E. Avaliação agrometeorológica do cultivo de
pepino (Cucumis sativus I.) em ambiente protegido e a campo, em períodos de outono-inverno e primavera-verão. 2001. 124 p. Tese (Doutorado em Energia na Agricultura) – Faculdade de Ciências Agronômicas, Universidade Estadual Paulista “Julio Mesquita Filho”, Botucatu, 2001.
GUISELINI, C. Microclima e produção de gérbera em ambientes protegidos com diferentes tipos de cobertura. 2002. 53 p. Dissertação (Mestrado em Física do Ambiente Agrícola) - Escola Superior de Agricultura “Luiz de Queiroz”, Universidade de São Paulo, Piracicaba, 2002. GUISELINI, C.; SENTELHAS, P.C. Uso de malhas de
sombreamento em ambiente protegido I: efeito na temperatura e na umidade do ar. Revista Brasileira de Agrometeorologia, Santa Maria, v. 12, n. 1, p. 9-17, 2004. GUISELINI, C.; SENTELHAS, P.C.; PANDORFI, H.; HOLCMAN, E. Temperatura e umidade do ar em ambientes protegidos cobertos com plástico transparente associado à malha termo-reletora, instalada externa e internamente. Revista Brasileira de Agrometeorologia, v.15, p.157-162. 2007.
KITTAS, C.; BAILLE, A.; GIAGLARAS, P. Influence of covering material and shading on the spectral distribution of light in greenhouse. Journal of Agricultural Engineering Research, London, v. 73, p. 341-51, 1999.
PANDORFI, C.G. Manejo de cobertura de ambientes protegidos: alterações micrometeorológicas e efeitos na produção e na qualidade de gérbera. 2006. 95 p. Tese (Doutorado em Física do Ambiente Agrícola) - Escola Superior de Agricultura “Luiz de Queiroz”, Universidade de São Paulo, Piracicaba, 2006.
PEZZOPANE, J.E.M.; OLIVEIRA, P.C. de; REIS, E.F. dos; LIMA; J.S.S. Alterações microclimáticas causadas pelo uso de tela plástica. Engenharia Agrícola, Jaboticabal, v. 24, n. 1, p. 9-15, jan./abr. 2004.
ROCHA, R.C. Uso de diferentes telas de sombreamento no cultivo protegido do tomateiro. 2007. 105 p. Tese (Doutorado em Irrigação e Drenagem) - Faculdade de Ciências Agronômicas, Universidade Estadual Paulista “Julio Mesquita Filho”, Botucatu, 2007.
SENTELHAS, P.C.; BORSATTO, R.S.; MINAMI, K. Transmissividade da radiação solar em estufas cobertas com ilmes de PVC azul e transparente. Revista Brasileira de Agrometeorologia, Santa Maria, v. 7, n. 2, p. 157-162, 1999. SENTELHAS, P.C.; VILLA NOVA, N.A.; ANGELOCCI,
L.R. Efeito de diferentes tipos de cobertura em miniestufas na atenuação da radiação solar e da luminosidade. In: CONGRESSO BRASILEIRO DE AGROMETEOROLOGIA, 10., 1997, Piracicaba. Anais... Piracicaba: Sociedade Brasileira de Agrometeorologia, 1997. p. 479-481.
SERRANO, T.D.; GUZMÁN, E.E.; RECIO, A.F.; GARCÍA, J.C.J.; GÁLVEZ, J.L.; CANO, A.S. Los ilmes plásticos
en la producción agrícola. Madrid: Mundi-Prensa, 2001. 320 p.
SHIRAHIGI, F.H. Produtividade e qualidade de híbridos de tomate (Solanum lycopersicum L.) dos segmentos Santa Cruz e Italiano em função do raleio de frutos, em ambiente protegido. 2009. 80p. Dissertação (Mestre em Fitotecnia) – Escola Superior de Agricultura “Luiz de Queiroz”, Universidade de São Paulo, Piracicaba, 2009. STEIDLE NETO, A.J.; RIBEIRO, A.; ZOLNIER, S.; LEITE,
F.P. Variabilidade sazonal da relação entre a radiação fotossinteticamente ativa e a radiação global na Bacia do Rio Doce, Estado de Minas Gerais. Acta Scientiarum Agronomy, Maringá, v. 28, n. 3, p. 427-31, 2006.