SIZE AND FORM OF PLOTS FOR THE CULTURE OF THE
ITALIAN PUMPKIN IN PLASTIC GREENHOUSE
Rodrigo Machado Mello1; Alessandro Dal’Col Lúcio1*; Lindolfo Storck1; Leandro Homrich Lorentz2; Ricardo Howes Carpes3; Alexandra Augusti Boligon3
1
UFSM - Depto. de Fitotecnia, 97105-900 - Santa Maria, RS - Brasil. 2
UFSM - Programa de Pós-Graduação em Agronomia. 3
UFSM - Graduando em Agronomia.
*Corresponding author <adlucio@smail.ufsm.br>
ABSTRACT: Quality control is the guaranty that experimental error is kept under acceptable levels, and the definition of the proper size and form of experimental plots ensures acurate experimental planning. This paper aims to determine the proper plot size and shape for the culture of the Italian pumpkin in protected environments. Two experiments were set in plastic green house in distinct crop seasons: either Summer-Fall or Winter-Spring season. The experiment comprised eight, 23-m long lines with 20 plants each, and fruit weight was considered the main performance parameter. Estimates of best plots size and shape were obtained by the maximum curvature, variance comparison and Hatheway methods. The plot size and shape varied according to the season and the ideal size and shape, according to the maximum curvature and Hatheway methods, to the Summer-Fall and Winter-Spring seasons, were eight plants (4 × 2 plot) and four plants (2 × 2 plot), respectively.
Key words: Curcubita pepo, protected environment, experiment planning, quality control
TAMANHO E FORMA DE PARCELAS PARA A CULTURA DA
ABÓBORA ITALIANA CULTIVADA EM ESTUFA PLÁSTICA
RESUMO: Na experimentação é de fundamental importância o controle de qualidade, fazendo com que o erro experimental apresente-se em níveis aceitáveis e, uma das formas desse controle, é a definição do tamanho e forma ótimos de parcela, no planejamento experimental. Determinou-se o tamanho e a forma ideais de parcela, para a cultura da abóbora italiana, em experimentos realizados sob ambientes protegidos, avaliando-se o rendimento acumulado da fitomassa dos frutos. Foram conduzidos dois experimentos em estufa plástica, modelo arco pampeano, durante o ano de 2001, em duas épocas de cultivo, um na estação sazonal verão-outono e outro na estação sazonal inverno-primavera. Os experimentos foram constituídos de oito fileiras de 20m de comprimento, sendo que, em cada uma delas, foram alocadas 20 plantas. As estimativas do tamanho e da forma de parcela foram obtidas pelos métodos da máxima curvatura, da comparação das variâncias e de Hatheway. As estimativas do tamanho e da forma da parcela variaram conforme a estação sazonal e o tamanho e a forma ideais, segundo os métodos da máxima curvatura e de Hatheway, para as estações sazonais verão-outono e inverno-primavera, foram de oito (quatro no comprimento e duas na largura) e quatro plantas (duas no comprimento e duas na largura), respectivamente. Palavras-chave: Curcubita pepo, ambiente protegido, planejamento de experimentos, controle de qualidade
INTRODUCTION
The italian pumpkin Cucurbita pepo (Cucurbitacea) stands as one of the twelve vegetables with the leading economic value and production in Brazil, be-ing the cultivars Clarita, Clarinda AG-135, Caserta CAC and Caserta BR the most known. Because of the prod-uct shortage in the market, producers from the south-ern-most state Rio Grande do Sul started to cultivate the Italian pumpkin in plastic greenhouses, in periods when the field production is not viable or scarce, as an alter-native to increase the profits.
Therefore, the expansion of this crop system and allied research efforts, brought increasing need for reli-able research results. To improve the quality of these re-sults it is necessary to reduce experimental error by esti-mating, for instance, the adequate size and shape of rep-licates, one of the main problems in experimental design and planning. Researchers often solve this problem em-pirically, using pragmatical plot sizes or personnal expe-rience to set up the experiment within a given, available area.
Lúcio et al.
458
adequate experimental design and ideal replicate size and shapes (Steel et al., 1997). The control of error by ex-perimental design consists in planning the experiment seeking the control of variation that occurs in the experi-mental area (Zanon & Storck, 2000). However, the ad-equate design depends on the culture, number of treat-ments, size of the experimental units, and environmental conditions. To determine size and shapes of replicates, researchers generally run a blank assay, which is also use-ful to determine the number of replications, local soil het-erogeneity, relative efficiency of a given experimental de-sign, and to predict the outcome of subsequent experi-ments.
The maximum curvature (Smith, 1938), the modi-fied maximum curvature, the relative information, the multiple regression (Hatheway & Williams, 1958; Hatheway, 1961), the comparison of variance and the method of Gomes (1984) stand among the most used methods to estimate size and shape of experimental rep-licates. However, this diversity of methods can hamper the choice of the adequate method to be used for these estimates (Storck, 1979).
Lopes et al. (1998) identified by the maximum curvature method that replicates with less than 18 plants (5.4 m2) set in totally randomized design are the ideal sta-tistical model to study salad-type tomato crops in plastic greenhouses but, in general, these information have been generated specially for big cultures, such as corn (Storck & Uitdewilligen, 1980; Resende & Souza Jr., 1997) and soy (Storck et al., 1982). There is still a lack of reliable information regarding vegetable crops, specially those planted in protected environments. This work aims to de-terminate optimal size and shape of replicates for the study of the Italian pumpkin crop, in protected environ-ment, in two different crop periods.
MATERIAL AND METHODS
Trials were set up in Santa Maria, RS, Brazil (29 43’23’’S; 53 45’15’’W; altitude 95 m). The soil of the experimental area is a Typic Hapludalf. The plastic green-house was 24 m long by 10 m wide by 2 m height, 3.5 m at the ridge. Roof, lateral curtains and laterals and doors were made of low density, 100-µm thick, anti-UV treated, polyethylene film (PEBD).
Italian pumpkin seedlings, cultivar Caserta, were produced in Styrofoam trays over metal frames, inside a nursery greenhouse, with plastic cover and wetted by micro-sprinklers. Seedlings were transplanted either in late February (Summer/Fall) or early September (Winter/ Spring), 2001. Plants were cultivated in eight lines of 20 plants, spaced 0.9 m. The rows were set on 0.1-m height by 0.4-m wide beds, covered with 100-µm thick, black mulching PEDB.
The soil preparation was done with a revolving hoe, and the chemical fertilization occurred based on the soil analyses results, following official culture recommen-dations. Irrigation was done by dripping under the mulch-ing; the quantity of irrigation water was defined based on the tension of water in the soil, for each row of plants, and controlled by low-fltbow jet hydrometers. Plants were cultivated in one stem, through vertical raffia strings, supported by steel wires, fastened to the height of the greenhouse’s ridge.
Routine cultural practices and phytossanitary treatments were performed after weekly evaluations. The temperature in the interior of the greenhouse was con-trolled by natural ventilation only, through opening and closing of the lateral curtains. The basic unit (BU) was composed by a plant and resulted in 20 basic units, in each of the eight rows. The plants were identified with labels containing the number of the row and the disposi-tion of the plant inside each row. Fruits harvested in each date were stored in identified plastic bags and weighted. Two types of replicates were planed, with varying size and shape. Each type of plot had X1 width basic unit (rows) and X2 length basic unit (columns), formed by the grouping of contiguous units, in a way that X1*X2 corresponds to X size of the replicate in number of ba-sic units. The fourteen types of plots planed (Table 1) are divisors of eight rows and of 20 columns of the trial. Therefore, the number of replicates per plot was limited by the total area of the plastic greenhouse.
For the variable accumulated value of fruit phytomass per plant, fourteen types of plots were planned and the following parameters were established: N = 160/ X = number of replicates with X basic units (BU) of size; M(x) = replicate with X BU of size average; V(x) = vari-ance between the portions of X BU of size; VU(X) = V(X)/X = variance by BU between the portions of X BU; CV(x) = variation coefficient between the X BU replicates of size, VR(x) = reduced variance for a basic unit – VR(x) = V(x)/X – according to Vallejo & Mendonza (1992) and Ortiz (1995). Starting from these parameters, the soil “b” heterogeneity index was estimated, according to the em-pirical relation VU(x) = V1/X (Smith, 1938), for the ac-cumulated value of fruit phytomass per plant. The value
2
X X1=1 X1=2 X1 =4 1 160(X=1) 8(X=2) 40(X=4) 2 80(X=2) 40(X=4) 20(X=8) 4 40(X=4) 20(X=8) 10(X=16) 5 32(X=5) 16(X=10) 8(X=20)
0
1 16(X=10) 8(X=20)
of “b” was estimated by a linear regression coefficient, trough the logarithmic of Smith’s equation (1938), weighted by the log VU(x) = log V1 – b log X of the degrees of freedom.
If the empirical relation proposed by Smith (1938) is precisely adjusted, the function CV(x) = a/Xb’ will also adjust, because CV(x) = 100* [V(x)/M(x)]½
, be-ing M(x) a measurement of the plot size in terms of de-termination of fruit phytomass, because M(x) is the av-erage of a X plot size determination, that is, M(x) = X*M(1) being M(1) the average of a BU replicate (Lessman & Atkins, 1963). The coefficient b’ measures the association between CV(x) and the plot size and the estimate of “a” is the estimate of VC(1). By comparisons, the constants “a” and b’ from the general equation of CV(x), transformed in logarithm, are estimated by the equation log{CV(x)} = log(a) – b’*log(x), weighted by the degrees of freedom. After the values of CV(x), VR(x), “a” and soil “b” heterogeneity rate, the optimum plot size was estimated by either the maximum curvature method, the variances comparison method or Hatheway method.
For the maximum curvature method, a graph was established by plotting the coefficient of variation VC(x) in the coordinate axis and the plot area, in number of BU’s, in the abscissa axis. The optimum plot size (Xo), by visual determination, is the point of maximum curva-ture in the graph.
For the method of comparison of variances, con-secutive Bartlett tests, α = 0.05 (Steel et al., 1997), were
run to check the homogeneity of reduced variances for a basic unit VR(x). After each test in which the variances are considered heterogeneous, the plot with smaller num-ber of BU will be excluded and the Bartlett test repeated among the VR(x) of the remaining plots. A group of plots with homogeneous VR(x) is defined, and the plot with the smallest number of BU chosen as optimum plot size. Hatheway (1961) proposed a method that does not consider the costs of information obtainment, as used by Smith (1938). The method combined the formula of Cochran & Cox (1968) to determinate the number of rep-etitions, starting from the relation of Smith (1938). This method considers the coefficient of variation estimated for the replicate of one BU, the foreseen number of rep-lications (r), the soil heterogeneity rate, the values of dis-tribution of “t” of Student and the minimum significant difference between averages of two treatments, measured by the percentage of the real average (d).
d2 = 2(t1 + t2)2 a2 / r Xb
being: t1=t
α1(gl); t2=tα2(gl), for infinite df; α1=0.05; α2 =2(1-P); r = 4, 8 and 16 replicates; a = the estimate of the coefficient of variation of the plots of a BU from log CV(x)=a/Xb’; b = soil’s heterogeneity index from log VU(x)=V1/Xb
; P = 0.80.
RESULTS AND DISCUSSION
Higher values for CV% were found in the Sum-mer-Fall season (S-F) (10.46 to 56.24%); in the Win-ter-Spring (W-S), CV% = 5.20 to 26.34% (Table 2). This result was already expected because in S-F, which represents the first semester of the year, there is a situ-ation of very intense environmental varisitu-ation in the re-gion, concerning temperature and insolation, since water and nutrient are supplied, and the Italian pumpkin shows linear response to temperature and in-solation.
The reduction of CV(x) in both experiments was not linear in relation to the increase of plot size. For smaller plot sizes, the decrease of CV(x) was more ac-centuated; for larger sizes, there was a tendency of stability. Therefore, increasing plot size is advantageous up to a given number of plants, for which the use of larger areas is not compensated by the low gains in accuracy. The values of the coefficients of variation for the different planned plots decreased with increas-ing plots width and/or length. This behavior is accepted as a rule, being conspicuously found in stud-ies on size and shape of plots (Storck, 1979; Oliveira & Estefanel, 1995; Simplício et al., 1996; Zanon & Storck, 2000).
Concerning the adjustment of variation coefficient in relation to the size of plot in S-F, it was observed that plots with more than eight plants present low variability reduction (Figure 1). However in Figure 2, which repre-sents the adjustment of variation coefficient in W-S, rep-licates with more than four plants had low reduction in the variation coefficient. Consequently, by this method, the most adequate size and shape of plots for S-F is eight plants, four in length and two in width; for W-S, four plants, two in length and two in width, is the adequate plot size.
The values of coefficients of variation for the S-F trial were higher as a result of the larger variability in the fruit growth. Such variability was caused, possibly,
Table 2 - Estimates of the variation coefficient in percentage, obtained in replicates of X1 basic units (BU) of width and X2 BU of length, for the accumulated phytomass value of fruit per plant, in the Italian pumpkin plot crop, cultured in the summer-fall and winter-spring seasons.
l l a f -r e m m u s -1
X X1- winter-spring 2
X 1 2 4 1 2 4
1 56.24 37.78 27.23 26.34 18.85 15.35 2 37.39 25.71 18.19 18.03 12.12 8.69 4 27.64 17.75 10.46 12.95 8.34 6.30 5 29.24 18.24 12.29 12.40 8.73 5.20
0
-Lúcio et al.
460
0 10 20 30 40 50 60
0 2 4 6 8 10 12 14 16 18 20 22
Number of plants
CV (%)
by variations of environmental conditions that occur in this season, such as broader ranges of temperature varia-tion, global solar radiavaria-tion, cloudiness and relative air hu-midity. Another important factor regarding S-F is the tem-perature reduction in the month of May, affecting fruit growth and development, interfering directly in the in-crease of weight variability of fruit.
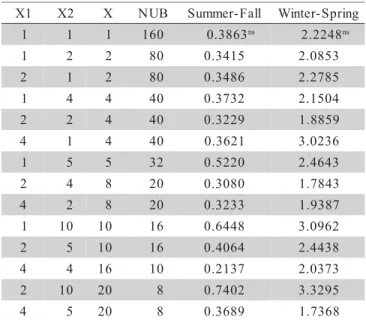
By the variance comparison method, all variances reduced to a basic unit, of different sizes and shapes of plots used in the trials, were homogeneous, independently of crop season (Table 3). The ideal plot size for both ex-periments is the one in which the plot is composed of a basic unit, in other words, one plant.
For the Hatheway method, the estimated values of soil “b” heterogeneity rate and of estimative “a”, ap-plied to the formula of minimum significant difference estimate, were respectively 0.74 and 44.63% for S-F, and 0.97 and 24.63% for W-S. This shows how heteroge-neous the area in this plastic greenhouse is, because the bigger the estimated value of “b”, the bigger the soil het-erogeneity; in other words, values close to the unit indi-cate a larger soil heterogeneity and close to nullity, more correlate the adjacent portions will be (Muniz et al., 1999). The result obtained for “b”, independently of crop sea-son, favors a large variability in fruit phytomass for this environment, and is explained by the fact that the har-vest is done aggressively to the plant, and by doing so, the researcher himself induces a variability source in the experimental area.
For fixed values of “a” and d, the size of plot decreases with increasing number of replication and of soil (b) heterogeneity rate; while for fixed “a” and r val-ues, the size of plots decreases with increasing percen-tile difference between two treatments statistically proven (d) and the “b” rate; finally, for fixed d and r values, it grows with the increase of variation coefficient and “b” rate. Therefore, smaller plots with larger number of rep-lications, allow the detection of smaller percentile differ-ences between treatments, than bigger plots with a smaller number of replications.
From these results, the researcher can establish the size of plot according to the minimum difference be-tween treatments he wishes to detect. An example is shown next (Figures 3 and 4). Minimum difference in percentage of the treatments average of 20%, in the S-F trial (Figure 3), could be detected with four plots of 28 plants (replicates), or eight plots of nine plants (replicates) or, yet 16 plots of four plants (replicates). In the W-S trial (Figure 4), a minimum difference in percentage of average between treatments of 15% could be obtained trough four plots of six replicates, or with eight plots of three replicates, or yet with 16 plots with two replicates. Relating the obtained results to the application of the three estimation methods of ideal size and shape of plots, the method of comparison of variances presented an unexpected result, because all the reduced variances, independently of crop season, were homogeneous and, therefore, only one plant became the recommendation of
Figure 1 - Relation between the variation coefficient and the size of replicate in number of plants, for the accumulated phytomass of the Italian pumpkin fruit, produced in the Summer - Fall season.
0 10 20 30 40 50 60
0 2 4 6 8 10 12 14 16 18 20 22
Number of plants
CV (
%
)
Figure 2 - Relation between the variation coefficient and the size of replicate in number of plants, for the accumulated phytomass of the Italian pumpkin fruit, produced in the
Winter – Spring season. nsNon heterogeneous variances, Bartlett test (α=0.05)
Table 3 - Estimative of reduced variances obtained in replicates of X1 basic units (BU) of width, X2 BU of length, X=X1*X2 BU of size and number of basic units of same size and shape (NUB) for the accumulated value of Italian pumpkin fruit phytomass, cultivated in plastic greenhouses in the summer-fall and winter-spring seasons.
1
X X2 X NUB Summer-Fall Winter-Spring 1 1 1 160 0.3863ns 2.2248ns
replicate size and shape, but in practice it does not add any advance to experimental planning in these conditions. However, the other methods used provided similar results, in each season, what proves the result obtained, conclud-ing that the maximum curvature method should be pre-ferred for trials run with the same characteristics, be-cause it is a graphic method, with a visual determination of the maximum curvature point, that corresponds to the ideal size and shape of plot, and so becomes more prac-tical and of easier application.
Besides the easiness of the maximum curvature method application, when compared to the Hatheway method, that method does not consider the maximum cur-vature point dependence of the scale used in the graph construction as well as the size of the smallest basic unit adopted and, it is not rare the good size of replicate be-ing obtained in the gap between two, pre-fixed points by studied sizes and shapes (Viana et al., 2002). Therefore, it is better to use the Hatheway method for estimates and subsequent recommendations of plot size and shape, pro-duced in a plastic greenhouse condition, because besides the maximum curvature method’s unfavorable character-istics, the Hatheway method presents conditions to com-bine different plot sizes and shapes, conciliating ent numbers of repetitions, minimum significant differ-ences between two treatments and still consider the soil heterogeneity present in the studied area, in other words, it is a mathematical method which permits many inter-pretations to support an adequate experiment planning in situations of limited physical area.
ACKNOWLEDGEMENTS
To “Fundação de Amparo à Pesquisa do Estado do Rio Grande do Sul (FAPERGS)” for granting funds for this research.
REFERENCES
COCHRAN, W.G.; COX, G.M. Experimental designs. 6.ed. New
York: Wiley & Sons, 1968. 616p.
GOMES, F.P. O problema do tamanho de parcelas em experimentos
com plantas arbóreas. Pesquisa Agropecuária Brasileira, v.19,
p.1507-1512, 1984.
HATHEWAY, W.H. Convenient plot size. Agronomy Journal, v.53,
p.279-280, 1961.
HATHEWAY, W.H.; WILLIAMS, E.J. Efficient estimation of the relationship between plot size and the variability of crop yields. Biometrics, v.14, p.207-222, 1958.
LESSMAN, K.J.; ATKINS R.E. Optimum plot size and relative
efficiency of lattice designs for grain sorghum yield tests. Crop
Science, v.3, p.477-481, 1963.
LOPES, S.J.; STORCK, L.; HELDWEIN, A.B.; FEIJÓ, S.; DA ROS, C.A. Técnicas experimentais para tomateiro tipo salada sob estufas
plásticas. Ciência Rural, v.28, p.193-197, 1998.
MUNIZ, J.A.; SIMPLÍCIO, E.; AQUINO, J.H.; SOARES, A.R. Determinação do tamanho de parcelas experimentais em
povoamento de Eucaliptus grandis Hill. II - parcelas quadradas.
Ciência e Agrotecnologia, v.23, p.446-453, 1999.
OLIVEIRA, P.H.; ESTEFANEL, V. Tamanho e forma da parcela para
avaliação do rendimento em experimentos com batata. Ciência
Rural, v.25, p.20-220, 1995.
ORTIZ, R. Plot techniques for assessment of bunch weight in banana
trials under two systems of crop management. Agronomy Journal,
v.87, p.63-69, 1995.
RESENDE, M.D.V.; SOUZA JR., C.L. Número de repetições e tamanho da parcela para seleção de progênies de milho em solos sob cerrado e
fértil. Pesquisa Agropecuária Brasileira, v.32, p.1457-1461, 1997.
SIMPLÍCIO, E.; MUNIZ, J.A.; AQUINO, L.H.; SOARES, A.R. Determinação do tamanho de parcelas experimentais em
povoamentos de Eucalyptus grandis Hill ex-Maiden. I – Parcelas
retangulares. Cerne, v.2, p.53-65, 1996.
SMITH, H.F. An empirical law describing heterogeneity in the yields
of agricultural crops. Journal of Agricultural Science, v.28,
p.1-23, 1938.
STEEL, R.G.D.; TORRIE, J.H.; DICKEY, D.A. Principles and
procedures of statistics: a biometrical approach. 3.ed. New York: McGraw-Hill, 1997. 666p.
STORCK, L. Estimativa para tamanho e forma de parcela e número de
repetições para experimentos com milho (Zea mays L.) Porto
Alegre: UFRGS, 1979. 98p. (Dissertação - Mestrado).
STORCK, L.; UITDEWILLIGEN, W.P.M. Estimativa para tamanho e forma de parcela e número de repetições para experimentos com milho (Zea mays L.) Agronomia Sulriograndense, v.16, p.269-282, 1980. STORCK, L.; SACCOL, A.V.; SCHNEIDER, F.M. Comparação de métodos de estimativa do índice de heterogeneidade do solo e do
tamanho ótimo de parcela em experimento com soja. Ciência
Rural, v.12, p.189-202, 1982.
VALLEJO, R.L.; MENDOZA, H.A. Plot technique studies on sweet
potato yield trials. Journal of the American Society for
Horticultural Science, v.117, p.508-511, 1992.
VIANA, A.E.S.; SEDIYAMA, T.; CECON, P.R.; LOPES, S.C.; SEDIYAMA, M.A.N. Estimativas de tamanho de parcelas em
experimentos com mandioca. Horticultura Brasileira, v.20,
p.58-63, 2002.
ZANON, M.L.B.; STORCK, L. Tamanho ótimo de parcelas
experimentais para Eucalyptus saligna Smith em dois estádios de
desenvolvimento. Cerne, v.6, p.104-111, 2000.
Figure 4 - Difference in percentile of the average (d) to be statistically rejected, for R = 4, 8 and 16 replications, of the accumulated phytomas of fruit of tte Italian pumpkin produced in the Winter - Spring.
0 10 20 30 40
0 5 10 15 20 25 30 35 40
Number of plants
R=4 R=8 R=16
d
Figure 3 - Difference in percentile of the average (d) to be statistically rejected, for R = 4, 8 and 16 replications, of the accumulated phytomas of fruit of tte Italian pumpkin produced in the Summer - Fall.
0 10 20 30 40 50 60 70
0 5 10 15 20 25 30 35 40 Number of plants
R=4 R=8 R=16
d