ACPD
12, 9813–9856, 2012Properties of the regional mixed layer
of Mexico’s Megapolis
C. Ochoa et al.
Title Page
Abstract Introduction
Conclusions References
Tables Figures
◭ ◮
◭ ◮
Back Close
Full Screen / Esc
Printer-friendly Version Interactive Discussion
Discussion
P
a
per
|
Dis
cussion
P
a
per
|
Discussion
P
a
per
|
Discussio
n
P
a
per
|
Atmos. Chem. Phys. Discuss., 12, 9813–9856, 2012 www.atmos-chem-phys-discuss.net/12/9813/2012/ doi:10.5194/acpd-12-9813-2012
© Author(s) 2012. CC Attribution 3.0 License.
Atmospheric Chemistry and Physics Discussions
This discussion paper is/has been under review for the journal Atmospheric Chemistry and Physics (ACP). Please refer to the corresponding final paper in ACP if available.
Physical and chemical properties of the
regional mixed layer of Mexico’s
Megapolis – Part 2: Evaluation of
measured and modeled trace gases and
particle size distributions
C. Ochoa1, D. Baumgardner1, M. Grutter1, J. Allan2, J. Fast3, and B. Rappenglueck4
1
Centro de Ciencias de la Atm ´osfera, Universidad Nacional Aut ´onoma de M ´exico, Mexico City, Mexico
2
School of Earth, Atmosphere and Environmental Sciences, University of Manchester, UK
3
Pacific Northwest National Laboratory, Richland, Washington, USA
4
Department of Earth and Atmospheric Sciences, University of Houston, Houston, Texas, USA Received: 16 March 2012 – Accepted: 1 April 2012 – Published: 16 April 2012
Correspondence to: D. Baumgardner ([email protected])
ACPD
12, 9813–9856, 2012Properties of the regional mixed layer
of Mexico’s Megapolis
C. Ochoa et al.
Title Page
Abstract Introduction
Conclusions References
Tables Figures
◭ ◮
◭ ◮
Back Close
Full Screen / Esc
Printer-friendly Version Interactive Discussion
Discussion
P
a
per
|
Dis
cussion
P
a
per
|
Discussion
P
a
per
|
Discussio
n
P
a
per
Abstract
This study extends the work of Baumgardner et al. (2009) in which measurements of trace gases and particles, at a remote, high altitude mountain site, 60 km from Mexico City were analyzed with respect to the origin of the air masses. In the current evalu-ation, the temperature, water vapor, ozone (O3), carbon monoxide (CO), acyl peroxy
5
nitrate (APN) and particle size distributions (PSDs) of the mass concentrations of sul-fate, nitrate, ammonium and organic mass (OM) were simulated with the WRF-Chem chemical transport model and compared with the measurements at the mountain site. The model predictions of the diurnal trends of the gases were well correlated with the measurements before the regional mixed layer (RML) reached the measurement site
10
but underestimated the concentration after that time. The differences are caused by an over rapid growth of the boundary layer by the model and too much dilution. There also is more O3being actually produced by photochemical production downwind of the emission sources than predicted by the model.
The measured and modeled PSDs compare very well with respect to their
gen-15
eral shape and diameter of the peak concentrations. The spectra are lognormal with most of the mass in the accumulation mode and the geometric diameter centered at 200±20 nm, showing little observed or predicted change with respect to the time when the RML is above the Altzomoni research station. Only the total mass changed with time and air mass origin. The invariability of average diameter of the accumulation
20
mode suggests that there is very little growth of the particles by condensation or coag-ulation past about six hours of aging downwind of the major sources of anthropogenic emissions in Mexico’s Megapolis. This could greatly simplify parameterization in cli-mate models although it is not known at this time if this invariance can be extended to other megacity regions.
ACPD
12, 9813–9856, 2012Properties of the regional mixed layer
of Mexico’s Megapolis
C. Ochoa et al.
Title Page
Abstract Introduction
Conclusions References
Tables Figures
◭ ◮
◭ ◮
Back Close
Full Screen / Esc
Printer-friendly Version Interactive Discussion
Discussion
P
a
per
|
Dis
cussion
P
a
per
|
Discussion
P
a
per
|
Discussio
n
P
a
per
|
1 Introduction
The role of Mexico City’s aerosol particles in modulating climate and their link to various health related issues has been clearly documented with numerous observational and theoretical studies (Molina et al., 2010 and references therein). Mexico City has been the focus of a number of major field programs since the early 1990’s that studied the
5
sources and evolution of these particles, as well as other anthropogenic emissions. For example, the first was the Mexico City Air Quality Research Initiative (MARI) conducted from 1990–1994 (LANL/IMP, 1994; Streit and Guzman, 1996), followed by the IMADA-AVER (Investigaci ´on sobre Materia Particulada y Deterioro Atmosf ´erico, Aerosol and Visibility Evaluation Research) campaign in February–March 1997 (IMP, 1998; Doran
10
et al., 1998; Edgerton et al., 1999; Molina and Molina, 2002). The third experiment was the Mexico City Metropolitan Area field program (MCMA-2003), an intensive 5-week campaign that took place in the spring of 2003 (31 March–4 May), with the goal of investigating the atmospheric chemistry of the MCMA, with particular focus on sec-ondary PM formation (Molina et al., 2007). Most recently, the Megacity Initiative: Local
15
And Global Research Observations (MILAGRO) project was carried out in March 2006 (Molina et al., 2010) during which continuous observations of gas and particle concen-trations were taken at various locations across Mexico City and its surroundings.
The environmental impact of these urban aerosols, a large fraction of them sub-sequently transported from the city, depends on their size differentiated composition.
20
Their lifetime, interaction with solar radiation, capacity to form cloud droplets and crys-tals and facility in entering the human respiration system are highly sensitive to how the mass and composition of these particles are distributed by size. Hence an impor-tant aspect of particles transported from the Mexican Megapolis is that of how their size distribution evolves; however, there have been very few studies that have looked
25
distribu-ACPD
12, 9813–9856, 2012Properties of the regional mixed layer
of Mexico’s Megapolis
C. Ochoa et al.
Title Page
Abstract Introduction
Conclusions References
Tables Figures
◭ ◮
◭ ◮
Back Close
Full Screen / Esc
Printer-friendly Version Interactive Discussion
Discussion
P
a
per
|
Dis
cussion
P
a
per
|
Discussion
P
a
per
|
Discussio
n
P
a
per
tions,<30 nm, were made during MCMA-2003 (Dunn et al., 2004) indicating that new particle formation occurred during periods of elevated sulfur dioxide. During this same project Salcedo et al. (2006) measured for the first time the size differentiated masses of selected inorganic and organic ions with an aerosol mass spectrometer (AMS). The size distributions were dominated by a prominent accumulation mode where inorganic
5
and organic species appeared to be internally mixed most of the time, and a smaller externally-mixed organic mode likely related to traffic emissions. During MILAGRO, al-though there were many instruments in operation that measured the size distributions of the aerosol particles, to date only four studies have been published that discuss the evolution of particle size distributions (PSD). Smith et al. (2008) studied new particle
10
formation with measurements of nanoparticles. Kleinman et al. (2009) evaluated the PSD characteristics as a function of time of day and photochemical age. Lewandowski et al. (2010) derived column averaged PSDs from sun photometer measurements and Wang et al. (2010) compared PSDs with measurements of CCN. There have been no published evaluations of the PSDs using numerical models, although Kleinman et
15
al. (2009) did make calculations of condensational growth to compare with their obser-vations.
It is the primary objective of the study described herein, to extend the evaluation by Baumgardner et al. (2009) who looked at the physical and chemical properties of the regional mixed layer of Mexico’s Megapolis during the MILAGRO project. In that
20
study, the diurnal trends of selected chemical species were evaluated at an elevated site southeast of Mexico City. The mixed layer, also known as the convective boundary layer, is the upper portion of the boundary layer in which air is thoroughly mixed by convection (Stull, 1994). In this study we refer to the regional mixed layer (RML) in the same context but where the region of interest is the area of the Mexican Megapolis, i.e.
25
ACPD
12, 9813–9856, 2012Properties of the regional mixed layer
of Mexico’s Megapolis
C. Ochoa et al.
Title Page
Abstract Introduction
Conclusions References
Tables Figures
◭ ◮
◭ ◮
Back Close
Full Screen / Esc
Printer-friendly Version Interactive Discussion
Discussion
P
a
per
|
Dis
cussion
P
a
per
|
Discussion
P
a
per
|
Discussio
n
P
a
per
|
as the air masses are advected by the larger scale circulation. We sample these air masses as they pass the Altzomoni research site, giving us a series of data points from which we can observe the diurnal trends in gas and particle composition in the upper portions of the RML.
In the following presentation we describe observations of diurnal trends in the mass
5
size distributions of sulfate, nitrate, ammonium and organic matter and compare these observations with simulations from the WRF-Chem model. In the following sections we describe the experimental methodology, compare simulated and measured chemically speciated PSDs, along with several other atmospherically relevant parameters, and finish with a discussion of the results and concluding remarks.
10
2 Experimental method
2.1 Measurements
During March 2006 measurements of meteorological conditions, gas concentrations and aerosol particle properties were made with instruments deployed at the Altzomoni overlook that is situated inside the national park Izta-Popo-Zoquiapan on the saddle,
15
called the Paso de Cort ´es, between the volcanoes Popocat ´epetl and Iztacc´ıhuatl. The site is located at 19.117◦N, 98.654◦W and an altitude of 4010 m a.s.l. (Baumgardner et al., 2009).
The atmospheric parameters measured at Altzomoni and the techniques employed are described in detail by Baumgardner et al. (2009). Here we briefly summarize only
20
the measurements used for the current study. Meteorological variables (temperature, relative humidity, wind direction and speed) were measured with a commercial weather station (Davis Instruments) at two meters AGL. An open-path FTIR was used to mea-sure gas concentrations of carbon monoxide (CO), ozone (O3) and sulfur dioxide (SO2) among other gases. Peroxyacetyl nitrate (PAN) and peroxypropionyl nitrate (PPN)
ACPD
12, 9813–9856, 2012Properties of the regional mixed layer
of Mexico’s Megapolis
C. Ochoa et al.
Title Page
Abstract Introduction
Conclusions References
Tables Figures
◭ ◮
◭ ◮
Back Close
Full Screen / Esc
Printer-friendly Version Interactive Discussion
Discussion
P
a
per
|
Dis
cussion
P
a
per
|
Discussion
P
a
per
|
Discussio
n
P
a
per
surements were carried out with a dual column gas chromatograph using an electron capture detector (Metcon Inc., K ¨onigstein, Germany).
Total particle number concentration for sizes larger than 10 nm was measured with a condensation nuclei (CN) counter model 3010 (TSI, St. Paul, MN). A quadrupole AMS (Aerodyne Research Inc, Billerica, MA) provided the mass concentrations of inorganic
5
ions (sulfate, nitrate, and ammonium) and the organic fraction in the sub-micron par-ticulate matter. The AMS was operated with a time resolution of five minutes (Jayne et al., 2000; Jimenez et al., 2003; Canagaratna et al., 2007). The collection efficiency of 0.5 was derived by comparing the total volume derived from a scanning mobility particle sizer (SMPS) with the volume derived from the AMS mass concentrations over
10
the same size range as the SMPS as discussed by Baumgardner et al. (2009). The instruments are summarized in Table 1. It is important to mention that all the particle measurement instruments were connected to an inlet with a PM1.0 cyclone separator (University Research Glassware, Chapel Hill, NC).
Baumgardner et al. (2009) selected fourteen days for evaluation: 3–4, 12–19 and
15
28–31 March. These periods had clear skies and did not show obvious influence from biomass burning. The fourteen days were those where the RML was clearly observed, from measurements made with a webcam, to grow above the research site and when the daily trends in gas and particle concentrations exhibited a sharp gradient.
In the studies reported here, we focus on a subset of these periods, 12–19 and
20
28–29 March. As in the analysis of Baumgardner et al. (2009), who used the wind fields derived from the North American Regional Reanalysis (NARR) at 650 mb (the average pressure measured at Altzomoni was 630 mb), we distinguish among different main wind sectors according to the origin of the air mass during the previous 24 h. The larger scale circulation brought air from the East (E) during the 12, 13, 14, 16, 17, 29
25
ACPD
12, 9813–9856, 2012Properties of the regional mixed layer
of Mexico’s Megapolis
C. Ochoa et al.
Title Page
Abstract Introduction
Conclusions References
Tables Figures
◭ ◮
◭ ◮
Back Close
Full Screen / Esc
Printer-friendly Version Interactive Discussion
Discussion
P
a
per
|
Dis
cussion
P
a
per
|
Discussion
P
a
per
|
Discussio
n
P
a
per
|
2.2 Model description and configuration
WRF/Chem is a chemical transport model that couples the Weather Research and Forecasting community model with atmospheric chemistry modules to simulate the evolution of trace gas and particle properties (Grell et al., 2005). The code used in the current study is the Pacific Northwest National Laboratory (PNNL) modified rendition of
5
WRF/Chem version 3 for Mexico City and surroundings (Fast et al., 2009). Table 2 lists the modules used in the simulation. The meteorology is described by Skamarock et al. (2008), the gas phase chemistry uses the carbon bond mechanism (CBM-Z, Zaveri and Peters, 1999) and the photolysis scheme is a simplified version of the Tropospheric Ultraviolet-Visible (TUV) model (Madronich, 1987) named fast-TUV (Tie et al., 2003).
10
For the particulate phase the MADE/SORGAM (Modal Aerosol Dynamics model for Eu-rope coupled with the Secondary Organic Aerosol Model) aerosol model (Ackermann et al., 1998; Schell et al., 2001) is used. The MADE/SORGAM simulates the aerosol size distribution using a modal approach for three different modes: Aitken, accumulation and coarse, using two overlapping lognormal modes for the sub-micrometer aerosols
15
(Ackermann et al., 1998). This configuration was selected based on the experience of some in-house tests and the expertise provided by Jerome Fast (PNNL, 2009).
The simulation covers two regions, an inner domain that encompasses the central region of Mexico with a 3-km grid spacing (Fig. 1) and an outer domain that covers the whole country with a 12-km grid spacing (not shown). The initial and boundary
20
conditions are the same as those used by Fast et al. (2009), but with the modified speciation to use the CBM-Z coupled with the MADE/SORGAM aerosol model.
The meteorological variables for the initial and boundary conditions were obtained in six hour intervals from the Global Forecast System (GFS) model maintained by the National Center for Environmental Prediction (NCEP). Other variables like initial sea
25
ACPD
12, 9813–9856, 2012Properties of the regional mixed layer
of Mexico’s Megapolis
C. Ochoa et al.
Title Page
Abstract Introduction
Conclusions References
Tables Figures
◭ ◮
◭ ◮
Back Close
Full Screen / Esc
Printer-friendly Version Interactive Discussion
Discussion
P
a
per
|
Dis
cussion
P
a
per
|
Discussion
P
a
per
|
Discussio
n
P
a
per
The initial and boundary conditions for trace gases and particles were obtained in 6-h intervals from the output of the global chemistry model MOZART-4 (Pfister et al., 2008). The emissions inventories of trace gas and particles used in this study, described by Fast et al. (2009), are based on the 1999 US National Emissions Inventory (NEI) and adjusted by Lei et al. (2007) with the 2002 Mexico City Metropolitan Area (MCMA)
5
inventory developed by the Comision Ambiental Metropolitana (CAM, 2004). In order to take into account the emissions fluctuations between weekdays and weekends, the weekday mobile emissions were diminished by 10 % and 30 % for Saturdays and Sun-days respectively (Fast et al., 2009; Lei et al., 2007). The volatile organic compounds (VOC) emissions were adjusted to update industrial, road and area emissions as in
10
Lei et al. (2007) for the Mexico City basin while for the grid cells outside this area the 1999 NEI is used. Baumgardner et al. (2009) reported that in the area to the east of Mexico City there are no major sources of anthropogenic pollutants, although the small villages in this region may have some minor impact. There are, however, two important natural sources of trace gases and particles: biogenic emissions (from vegetation and
15
biomass burning) and volcanic exhalations.
The Popocatepetl volcano, with strong intermittent emissions of sulfur dioxide (SO2) has an impact on atmospheric chemistry and secondary aerosols production (Grutter et al., 2008). Due to this intermittency, the volcano emissions are highly variable and this feature is addressed in the model by adding to the emissions inventory an emission
20
rate that varies day to day according to observations.
Trees, bushes and grass emit organic compounds, some of them in response to environmental stress. These highly volatile and reactive compounds can alter signifi-cantly the atmospheric chemistry (Dominguez-Taylor et al., 2007). The most abundant compounds are the isoprenoids (Guenther et al., 1995). The isoprene and terpene
25
ACPD
12, 9813–9856, 2012Properties of the regional mixed layer
of Mexico’s Megapolis
C. Ochoa et al.
Title Page
Abstract Introduction
Conclusions References
Tables Figures
◭ ◮
◭ ◮
Back Close
Full Screen / Esc
Printer-friendly Version Interactive Discussion
Discussion
P
a
per
|
Dis
cussion
P
a
per
|
Discussion
P
a
per
|
Discussio
n
P
a
per
|
the emissions for each plant functional type and summing them to estimate the total emission in a defined area (Guenther et al., 2006).
Another significant emission source is the burning of biomass (Yokelson et al., 2007; Molina et al., 2007; DeCarlo et al., 2008; Aiken et al., 2009). Fast et al. (2009) com-puted the daily fire emissions of trace gas and particles from the MODIS (Moderate
5
Resolution Imaging Spectroradiometer) thermal anomalies product using the method-ology described by Wiedinmyer et al. (2006).
The structure of the planetary boundary layer (PBL) is simulated in WRF/Chem us-ing the Yonsei University parameterization reported by Hong et al. (2006), settus-ing a minimum value of the PBL height at 200 m a.g.l. when there is no solar heating. This
10
scheme is a vertical diffusion package with non-local turbulent mixing in the PBL and is the next generation of the medium range forecast PBL implemented by Hong and Pan (1996). This new version adds an explicit treatment to the entrainment layer at the top of the PBL based on the studies reported by Noh et al. (2003) (Skamarock et al., 2008).
15
3 Results
3.1 Analysis methodology
The fidelity of the model with respect to its accuracy in predicting the temporal proper-ties of the atmospheric constituents is evaluated by comparing the measured, diurnal averages made at the Altzomoni research site with averages from the simulation, both
20
in hourly intervals. The comparisons are partitioned into the three periods mentioned above, i.e. air masses arriving from the E, SW and WNW.
The main focus of the evaluation is on the time evolution of the size distributed mass measured with the AMS compared to the lognormal PSDs produced by the model. Prior to discussing these comparisons, however, we investigated the simulation of the
25
observa-ACPD
12, 9813–9856, 2012Properties of the regional mixed layer
of Mexico’s Megapolis
C. Ochoa et al.
Title Page
Abstract Introduction
Conclusions References
Tables Figures
◭ ◮
◭ ◮
Back Close
Full Screen / Esc
Printer-friendly Version Interactive Discussion
Discussion
P
a
per
|
Dis
cussion
P
a
per
|
Discussion
P
a
per
|
Discussio
n
P
a
per
tion. A reasonable agreement between the simulated and measured meteorological and gas variables is a prerequisite for an accurate prediction of the PSD. Trends in the meteorological and trace gas variables also provide additional insight to changes in the characteristics of the PSDs. As we are interested in trends as well as absolute val-ues, for the comparison we calculate the Pearson’s correlation coefficient (Bevington
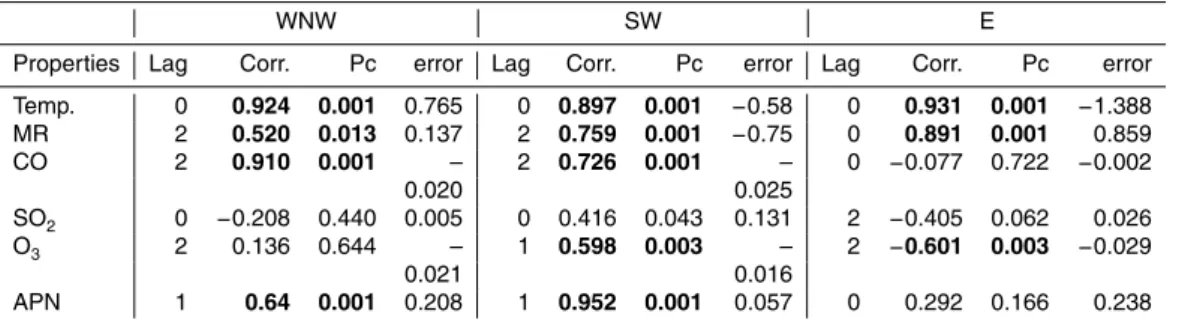
5
and Robinson, 2003) to quantify the relationship between the measured and simulated trends. The absolute differences are calculated as the sum of the average hourly dif-ferences between the measured and simulated parameters. As will be observed in the following Figs. 3–5, some of the measured and simulated variables had very similar daily trends but appeared to be shifted with respect to one another in time. Hence, an
10
additional step was taken in which the correlation coefficients and sum of the diff er-ences were calculated after shifting the simulated time series by plus or minus several hours to see if the correlations would improve and differences would decrease with time shifts. The results of these statistics, discussed below, are summarized in Table 3.
3.2 Boundary layer growth and meteorology
15
The diurnal trend of the atmospheric parameters is directly related to the physics of the boundary layer (BL) growth, i.e. solar heating, sensible heat flux from the ground, wind shear, turbulent mixing and larger scale circulations (Stull, 1994; Stensrud, 2007). In addition, the solar radiation that produces the energy to generate turbulence is also responsible for driving the photochemical processes that produce O3, PAN and
sec-20
ondary aerosols like sulfates, nitrates and some of the organics. Biogenic emissions are sensitive to the solar heating, as well. Hence, by analyzing the simulations of the BL thickness in relation to the diurnal cycles of the modeled and observed atmospheric parameters, we gain insight that helps us assess the accuracy of the model.
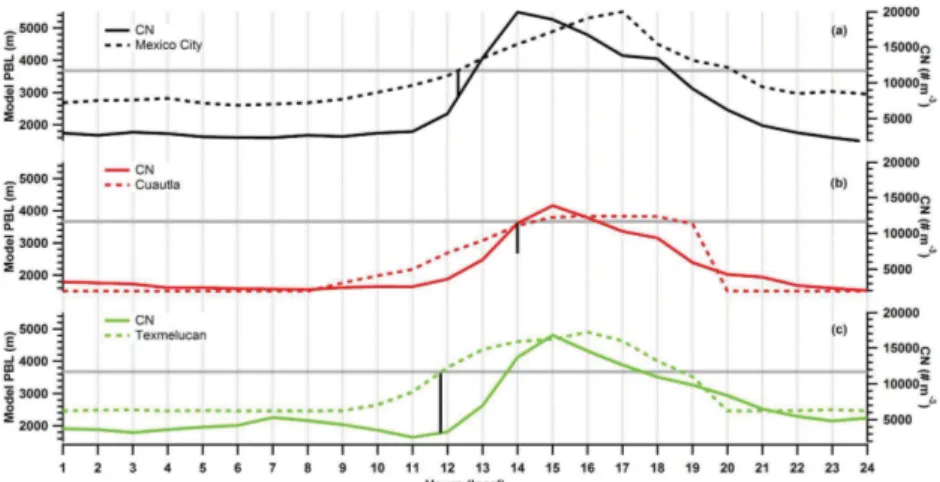
In addition to the BL depth at the Altzomoni research site, three additional locations,
25
ACPD
12, 9813–9856, 2012Properties of the regional mixed layer
of Mexico’s Megapolis
C. Ochoa et al.
Title Page
Abstract Introduction
Conclusions References
Tables Figures
◭ ◮
◭ ◮
Back Close
Full Screen / Esc
Printer-friendly Version Interactive Discussion
Discussion
P
a
per
|
Dis
cussion
P
a
per
|
Discussion
P
a
per
|
Discussio
n
P
a
per
|
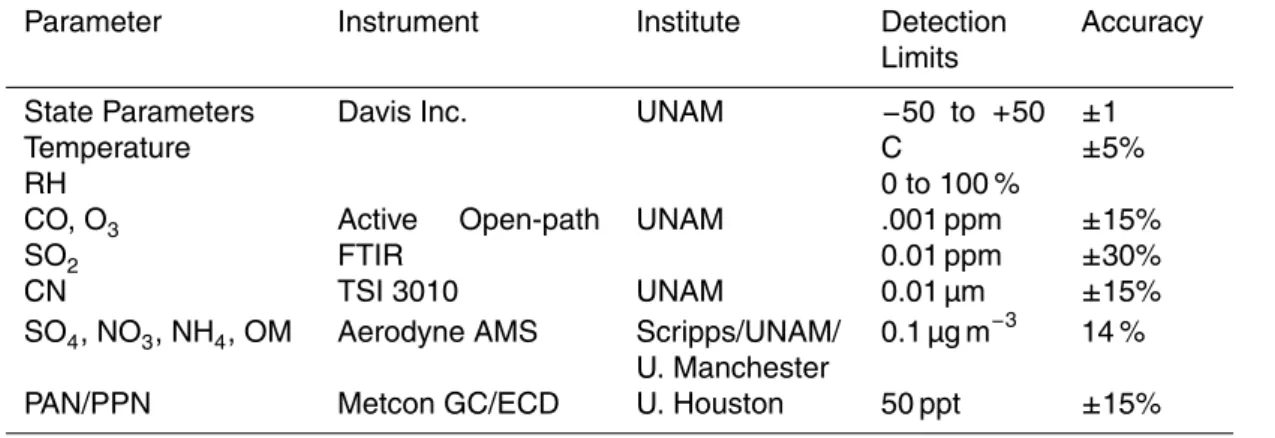
for their proximity to the major population centers but far enough from Altzomoni to be unaffected by local topographical features. Their distances from Altzomoni were 60 km, 30 km and 45 km, respectively. Figure 2 shows the simulated depth of the BL at these three locations. Also shown by the horizontal solid gray lines is the altitude of the research site as represented in the model. Note that this altitude is about 300 m lower
5
than the actual height of the research site as a result of the model resolution. The solid curve in each of the three panels is the diurnal time series of the CN concentration measured at the site. As was shown by Shaw et al. (2007), the BL in the Mexico City area routinely grows to depths greater than 4000 m a.g.l., as also seen in the model results here.
10
The CN concentration is an indicator of the time when the air from the regional BL reaches the research site (Baumgardner et al., 2009). Before this time, the concen-trations are quite low (below 2000 cm−3) reflecting the presence of free tropospheric air. As the RML grows and mixes with the local environment, the concentrations begin to increase, reaching a maximum usually when the aerosol layer that forms at the top
15
of the RML passes the site as the layer continues to grow (Raga et al., 2001; Baum-gardner et al., 2009). If the growth is correctly simulated, when the top of the RML approaches the altitude of the research site we should see the CN concentrations start to increase, keeping in mind that larger scale circulations are also important for lifting the RML up the mountain site.
20
We note several features when comparing the time when the simulated RML reaches the research site to the increase in CN concentration. In Fig. 2a, when the origin of the general air mass is from the WNW, we observe a slight increase in the CN just prior to the time when the RML depth in Mexico City is the same as the altitude of Altzomoni. As the RML reaches Altzomoni between 11:00 and 12:00 (all times are reported as
25
ACPD
12, 9813–9856, 2012Properties of the regional mixed layer
of Mexico’s Megapolis
C. Ochoa et al.
Title Page
Abstract Introduction
Conclusions References
Tables Figures
◭ ◮
◭ ◮
Back Close
Full Screen / Esc
Printer-friendly Version Interactive Discussion
Discussion
P
a
per
|
Dis
cussion
P
a
per
|
Discussion
P
a
per
|
Discussio
n
P
a
per
For the case of air originating from the SW (Fig. 2b), according to the model results the RML depth barely exceeds the height of the research site, broaching that altitude after 13:00 and then remaining constant for five hours before collapsing in the afternoon at 18”00. The delay in reaching its maximum depth, compared to the case of winds from the WNW, explains the delayed increase in the CN concentration when winds are
5
from the SW. The two hour difference between when the simulated RML at Cuautla reaches its maximum, compared to the maximum modeled for the RML in Mexico City and Texmelucan, can be attributed to two factors (1) the difference in time when the sun begins heating each location (Fast and Zhong, 1998; Whiteman et al., 2000) and (2) the difference in altitudes. Cuautla remains in the shadow of the mountains at that
10
time of the year until around 10:00 whereas Mexico City and Texmelucan receive solar warming between 08:00 and 09:00. Cuautla is also 1000 m lower than either Mexico City or Texmelucan, hence more time is needed for the boundary layer to grow and reach the altitude of the research site.
In Fig. 2c, when air originates from the east, we observe a small increase in the CN
15
concentration at the time the model predicts arrival of the RML at the measurement site but the more significant increase does not begin until an hour later when the predicted BL is about 200 m above Altzomoni. This is very similar to what was observed when the air masses originated from the WNW (Fig. 2a). To summarize the BL results, they appear to be consistent with the CN data and indicate that the atmospheric physics
20
is being well represented in the model. However, it is important to note that there is a time lag of approximately one hour between when the simulated RML reaches the Altzomoni site (e.g. 11:00 for WNW) and when the CN concentration starts to increase rapidly (e.g. 12:00 for WNW).
Figure 3 shows the diurnal averages of the temperature and mixing ratios that were
25
ACPD
12, 9813–9856, 2012Properties of the regional mixed layer
of Mexico’s Megapolis
C. Ochoa et al.
Title Page
Abstract Introduction
Conclusions References
Tables Figures
◭ ◮
◭ ◮
Back Close
Full Screen / Esc
Printer-friendly Version Interactive Discussion
Discussion
P
a
per
|
Dis
cussion
P
a
per
|
Discussion
P
a
per
|
Discussio
n
P
a
per
|
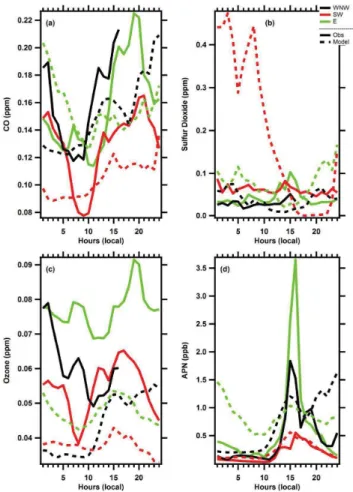
in excellent agreement with the measurements after 17:00 and 20:00 when air masses originate from the E and SW, respectively.
The agreement between the trends in simulated and measured water vapor mixing ratio (Fig. 3b) is very good in the easterly air masses over the whole day; however, the model has a bias of about one g kg−1
. In the air from the SW, the model agrees well
5
with the observations in the afternoon and evening after 15:00 but overestimate the mixing ratio by factors of two to four in the morning through mid-afternoon.
3.3 Trace gas species
The trace gases evaluated in this study were CO, O3, SO2 and the sum of PAN and PPN. Figure 4 shows the comparison of the modeled and measured mixing rations of
10
these four gases. Looking at Fig. 4a we see that from midnight to midday, the model reproduces the measurements of CO quite well when the air masses originate from the E or SW with excellent agreement in absolute values as well as the general trends. Once the RML reaches the measurements site, however, the measured CO exceeded the concentration from the model by 50–80 % in the air from the SW and E,
respec-15
tively. The CO predicted by the model, in the WNW air mass, overestimates CO by an average of ca. 0.05 ppm throughout the day, with the exception of one hour at 14:00 when the measurements spike and exceed the model by 80 %. It has been observed previously (Baumgardner et al., 2009) that measured CN concentrations are typically well correlated with the CO mixing ratio at the research site. Comparing Figs. 2 and
20
4b, both atmospheric species begin to increase as the RML approached the altitude of the research site and reach their maximum values at the same time. The secondary peaks that are prominent in the measured CO are not as sharp in the trends of CN but inflections in the trends are still noticeable. These correlations imply that the positive differences between the measured and modeled CO are not a result of CO that is
be-25
ACPD
12, 9813–9856, 2012Properties of the regional mixed layer
of Mexico’s Megapolis
C. Ochoa et al.
Title Page
Abstract Introduction
Conclusions References
Tables Figures
◭ ◮
◭ ◮
Back Close
Full Screen / Esc
Printer-friendly Version Interactive Discussion
Discussion
P
a
per
|
Dis
cussion
P
a
per
|
Discussion
P
a
per
|
Discussio
n
P
a
per
direct sources may be underestimated) or an overestimate of the amount of dilution by mixing.
As observed in Fig. 4b, the model does not correlate very well with the measure-ments of SO2. The SO2 emissions from Popocatepetl, parameterized in the model, vary from day to day corresponding to measurements made by Grutter et al. (2008)
5
and were greatest on 18 and 19 March, when the air masses were from the SW. This is the source of the SO2from the model that is much higher than was measured. The significance of these differences is questionable, due to the resolution of the model that produces a wider plume of SO2from the volcano than is actually emitted.
The O3 is underestimated by the model throughout the 24 h period regardless of
10
the air mass origin (Fig. 4c). When the model results are shifted two hours later with respect to the measurements, the correlations are all positive and significant at the
P <0.01 level (Table 3), indicating good agreement in trends even though the absolute
values are on average more than 0.02 ppm less than observed. The differences be-tween the model and measurements can be attributed to an inadequate representation
15
of O3 precursors (e.g. biogenic VOC) in the emissions inventory, an underestimate of the continuing, photochemical production of O3, as was seen by Tie et al. (2009), or overestimation of the dilution by mixing as we observed in comparisons of the CO. It may be that the 25 % difference between the measurements and models, before the RML arrives at Altzomoni, is a result of an underestimate of photochemical production,
20
since Tie et al. (2009) observed a similar difference. Once the RML is above the re-search site, however, the 50–80 % difference is similar to the differences seen in CO, leading us to conclude that the model is entraining free tropospheric air too rapidly.
The majority of acyl peroxy nitrates (APN) are composed of PAN and PPN. Their principal loss mechanism is via thermal decomposition (Seinfeld and Pandis, 2006). To
25
ACPD
12, 9813–9856, 2012Properties of the regional mixed layer
of Mexico’s Megapolis
C. Ochoa et al.
Title Page
Abstract Introduction
Conclusions References
Tables Figures
◭ ◮
◭ ◮
Back Close
Full Screen / Esc
Printer-friendly Version Interactive Discussion
Discussion
P
a
per
|
Dis
cussion
P
a
per
|
Discussion
P
a
per
|
Discussio
n
P
a
per
|
only 0.06 ppb after shifting the simulations by one hour later than the measurements. The trends of the simulations and observations, in easterly air masses, are in good agreement in the morning from midnight until 13:00, then again in the late afternoon and evening after 17:00. The model overestimates APN during these time periods but follows a similar diurnal tendency. The model also over-predicts APN in the WNW air
5
masses from midnight to 13:00 and, unlike the simulations for E and SW air masses, where APN decreases in the evening, the model keeps increasing APN. The rapid in-crease in APN around midday, not reproduced by the model, follows the same trend as was seen in CO.
3.4 Aerosol particle size distributions
10
The size distributions of the mass concentrations of the sulfate, nitrate, ammonium and organic matter ions were averaged hourly and grouped by air mass origin over the same periods as previously discussed for the meteorological and trace gas mea-surements. The size spectra from the simulations were also grouped and averaged over these same periods. The AMS measures the vacuum, aerodynamic diameter of
15
the particles, whereas the diameter reported from the WRF-Chem model is geometric. Hence, the size scales of the AMS spectra are converted to geometric diameter using a density of 1.8 g cm−3for the sulfate, nitrate and ammonium particles and 1.4 g cm−3
for organic matter (Barnard et al., 2010). Figures 5–8 show selected time periods cho-sen to reprecho-sent the evolution of the size distributions: 11:00 for when the RML is just
20
arriving at Altzomoni, 14:00 for when the maximum concentration gases and particle is observed and 17:00 for when these concentrations are decreasing. In the following discussion we focus specifically on the time evolution of three features of the PSDs: (1) the mass concentration of particles less than 0.1 µm, (2) the diameter and concentra-tion of the peak in the PSD and (3) the general shape of the PSD. The interest in the
25
coag-ACPD
12, 9813–9856, 2012Properties of the regional mixed layer
of Mexico’s Megapolis
C. Ochoa et al.
Title Page
Abstract Introduction
Conclusions References
Tables Figures
◭ ◮
◭ ◮
Back Close
Full Screen / Esc
Printer-friendly Version Interactive Discussion
Discussion
P
a
per
|
Dis
cussion
P
a
per
|
Discussion
P
a
per
|
Discussio
n
P
a
per
ulation, as do changes in the overall shape of the spectra. As was previously described in Sect. 2.2, the model provides information on the size spectra via the concentrations and diameters of the Aiken and accumulation modes assuming a lognormal proba-bility distribution with a constant standard deviation for each mode. The size spectra shown in the figures are calculated from the sum of the two, overlapping lognormal
5
distributions.
Figure 5a–c show the PSDs for sulfate when the air originated from the WNW, SW and E, respectively. Regardless of the origin of the air mass, the model produces much more sulfate than observed in the measurements. Note that the PSDs in panels a, b and c are drawn with different scales on the ordinate axis because of the range in
val-10
ues predicted by the model, with the most sulfate found in the WNW air masses and the least from the SW. The measurements, however, do not reflect this variation since the peak concentration for all three cases is approximately 0.5 µg m−3. Another major difference between the model and measurements is that the simulations indicate a shift in the size at which the peak value falls from morning to afternoon for the PSDs with air
15
from WNW and E, whereas the measurements show the peak at 200 nm regardless of time of day or air mass origin. In addition, for air mass origins from the WNW and E, there are negligible differences in the shape of the PSDs. Only in air from the SW do we observe an increase in the peak concentration as the day progresses. The evolu-tion of the PSDs predicted by the model is quite different depending on the air mass
20
origin. In WNW air (Fig. 5a), the diameter of the peak decreases as the day progresses even as the peak concentration increases. In the morning and mid-afternoon there is an increase in the mass concentration of the small particles that then decreases by late afternoon. The evolution of the PSDs in southwesterly and easterly air masses is sim-ilar with little change between 11:00 and 14:00 and distinct modes at 30 and 200 nm.
25
ACPD
12, 9813–9856, 2012Properties of the regional mixed layer
of Mexico’s Megapolis
C. Ochoa et al.
Title Page
Abstract Introduction
Conclusions References
Tables Figures
◭ ◮
◭ ◮
Back Close
Full Screen / Esc
Printer-friendly Version Interactive Discussion
Discussion
P
a
per
|
Dis
cussion
P
a
per
|
Discussion
P
a
per
|
Discussio
n
P
a
per
|
The PSDs of the nitrate ion, shown in Fig. 6a–c, also drawn on different concentration scales, show much more variation related to time of day and air mass origin. Turning first to the measurements, we see that regardless of the air mass direction, the size of the peak in the PSDs does not shift with time of day. The peak diameter is slightly larger than 200 nm in air from the WNW (Fig. 6a), slightly smaller than 200 nm in SW
5
air masses (Fig. 6b) and almost exactly 200 nm in easterly air (Fig. 6c). With respect to the peak concentration, the maximum occurs at 14:00, 17:00 and 14:00 in air masses originating from the WNW, SW and E, respectively. There is no evidence of a small particle mode in any of the PSDs and no obvious broadening or narrowing related to the time of day. With respect to the agreement between the modeled and measured
10
PSDs, the PSDs compare very well at 14:00 when air is from the E (Fig. 6c). In air from the WNW, the predicted PSDs evolve almost inversely to the measurements, i.e. the peak concentrations and diameters decrease during the day. The peak diameter is 400 nm at 11:00 and 250 nm at 17:00. The peak concentration at 17:00 is seven times smaller than at 11:00. There is also a small particle mode at 11:00 that disappears
15
by 14:00. The peak concentration from the model at 11:00 is almost the same as the measured concentrations at 14:00 and 17:00. In the SW air mass the simulated peak concentrations are approximately five times smaller than were measured (Fig. 6b). In the easterly air the PSDs change very little during the day, contrary to what was observed.
20
In Fig. 7a–c we compare the PSDs of the ammonium ions and observe that there is good agreement between the model and the measurement in the easterly air masses at 14:00 (Fig. 7c), similar to what was seen in the comparison of nitrate PSDs. The measured peak concentration is slightly higher and diameter a little smaller. In the SW air mass (Fig. 7b) the 11:00 PSDs are in fairly good agreement. The evolution of the
25
ACPD
12, 9813–9856, 2012Properties of the regional mixed layer
of Mexico’s Megapolis
C. Ochoa et al.
Title Page
Abstract Introduction
Conclusions References
Tables Figures
◭ ◮
◭ ◮
Back Close
Full Screen / Esc
Printer-friendly Version Interactive Discussion
Discussion
P
a
per
|
Dis
cussion
P
a
per
|
Discussion
P
a
per
|
Discussio
n
P
a
per
PSDs in air of WNW origin (Fig. 7a) decrease in diameter but not in concentration as was observed in the predicted peak of nitrate mass. In addition, the predicted peak concentrations for all three time periods exceed those that were measured in the WNW air but the measured peak concentrations exceeded the simulated concentrations by a wide margin in SW air and less so in easterly air.
5
The measured PSDs of organic matter, shown in Fig. 8a–c, all reach their maximum peak concentrations at 14:00, with very little shifts in the peak diameter regardless of air mass origin. The measured PSDs are generally much narrower than the predicted PSDs. The predicted PSDs also reach their maximum peak concentrations at 14:00; however, in air masses from WNW and E, the maxima in peak concentrations remain
10
at least until 17:00 while in the SW air mass the 17:00 peak concentration has returned to its 11:00 value. The measured peak concentrations show the reverse of this behav-ior, i.e. in the WNW and E air masses, the 11:00 and 17:00 peak concentrations are the same whereas in air from the SW, the 14:00 and 17:00 concentrations are nearly identical.
15
4 Discussion
As seen in the summary of the comparisons (Table 3), the daily trends from the model and measurements are sometimes in good agreement, using a confidence level of Pc<0.01 as the criterion for a statistically significant correlation coefficient. The
tem-perature and water vapor mixing rations were well correlated regardless of air mass
20
origin, as was the ozone. The CO was very well correlated prior to the arrival of the RML but the significant underestimation by the model after that time causes the cor-relation coefficients to decrease. Of the 18 comparisons (six parameters and three different air mass directions) 12 were statistically significant. Most of these good cor-relations were reached when the average time series from the model is shifted by one
25
ACPD
12, 9813–9856, 2012Properties of the regional mixed layer
of Mexico’s Megapolis
C. Ochoa et al.
Title Page
Abstract Introduction
Conclusions References
Tables Figures
◭ ◮
◭ ◮
Back Close
Full Screen / Esc
Printer-friendly Version Interactive Discussion
Discussion
P
a
per
|
Dis
cussion
P
a
per
|
Discussion
P
a
per
|
Discussio
n
P
a
per
|
and E air masses and one hour later for southwesterly air. The need to shift the model results in time suggests that the BL is growing too rapidly in the model.
In Sect. 3.2 the trends in the modeled BL were compared with the onset of increases in the CN concentration. It was observed that the CN concentration generally began increasing at the time when the depth of the BL was close to the elevation of the
5
research site. Taking a closer look at Fig. 2, we see that the really sharp increases in CN do not occur in the air originating from the WNW and E (Fig. 2a and c) until two hours after the BL is at the site. Similarly in southwesterly air the increase in CN occurs an hour after the arrival of the BL (Fig. 2b). These time lags are the same as those required to produce correlated O3 and reinforce our conclusion that the RML maybe
10
growing too rapidly in the model, compared to the actual growth rate.
Prior to the arrival of the RML at Altzomoni, we observe that the model underesti-mates the O3 with respect to the measurements by approximately 25 % then by 50– 80 % afterwards. In Sect. 3.3 we suggest that the 25 % difference is a result of the continuing photochemical production of O3that is not taken into account in the model,
15
as concluded by Tie et al. (2009). The much larger difference after the RML reaches the research site was also observed in the comparison of CO and is further evidence that the simulated BL growth is overly vigorous. Turbulence generated by solar heat-ing entrains free tropospheric air as the BL grows and leads to mixheat-ing and dilution of the gases and particles in the BL. Figure 9 illustrates this process with simulated
ver-20
tical profiles of CO (Fig. 9a) and O3 (Fig. 9b) at the three sites shown in Fig. 1 and whose BL depth trends were presented in Fig. 2. The time periods selected are 11:00, 14:00 and 18:00 to correspond to the average time of RML arrival at Altzomoni, time of maximum CN and time when the RML is beginning to collapse. Shown connected by horizontal lines at the pressure altitude of Altzomoni are the maximum CO (Fig. 9a) and
25
O3 (Fig. 9b) modeled (diamond on left of line) and measured (solid circle). An arrow designates that the measured value is greater than the maximum on the scale.
ACPD
12, 9813–9856, 2012Properties of the regional mixed layer
of Mexico’s Megapolis
C. Ochoa et al.
Title Page
Abstract Introduction
Conclusions References
Tables Figures
◭ ◮
◭ ◮
Back Close
Full Screen / Esc
Printer-friendly Version Interactive Discussion
Discussion
P
a
per
|
Dis
cussion
P
a
per
|
Discussion
P
a
per
|
Discussio
n
P
a
per
the research site. By 14:00 the CO has mixed upwards, decreasing the concentration at the surface but increasing it at the research site. The trends in Mexico City (WNW) and Texmelucan (E) are similar in that the maximum in CO at the same pressure level of Altzomoni (630 mb) occurs at 14:00 then by 18:00 continuing dilution decreases
5
the average concentration. The maximum in CO when air is from the SW (Cuautla) occurs at 18:00 because Cuautla is 1000 m lower in altitude than Mexico City and Texmelucan; hence and it takes longer for the emissions from that area to reach the research site. The model results coincide with the measured trends in CO and CN that show the maxima occurring later and also remaining high until 14:00 (Figs. 2b and 4a).
10
Comparing these profiles with the maximum modeled and measured CO at Altzomoni, we see that in the WNW air masses, there has been a 13:1 dilution in the maximum CO that is at 630 mb over Mexico City. When looking at the results from Cuautla the modeled CO at Altzomoni is 20 % greater than the CO upwind at the same level over Cuautla. This means that the CO was continuing to mix upwards from the surface;
15
however, given that measured CO was 30 % larger than simulated, it implies that the CO was over-diluted. A different situation occurs in the southeasterly air masses where the CO from the model is the same at the research site as at the same level upwind at Texmelucan but the measured CO is 80 % larger, almost the same concentration as found at the surface at Texmelucan at 11:00. This suggests that not only has there
20
been too much dilution in the model, but the emission strength of CO is also likely underestimated.
Figure 9b shows that the O3profiles are much more vertical from the surface to the altitude of Altzomoni at 11:00 than seen in the CO profiles. This is a result of verti-cal mixing and photochemiverti-cal production of new O3. The maximum concentration is
25
ACPD
12, 9813–9856, 2012Properties of the regional mixed layer
of Mexico’s Megapolis
C. Ochoa et al.
Title Page
Abstract Introduction
Conclusions References
Tables Figures
◭ ◮
◭ ◮
Back Close
Full Screen / Esc
Printer-friendly Version Interactive Discussion
Discussion
P
a
per
|
Dis
cussion
P
a
per
|
Discussion
P
a
per
|
Discussio
n
P
a
per
|
from the SW, represented by the Cuautla vertical profile, the O3concentration at 18:00 returns to its 11:00 value. This trend also is reflected in the measurements. Only the profiles of air from the SE differ from the trends that were measured. In this case the 18:00 concentration falls between the 11:00 and 14:00 values but the measured O3at
5
18:00 is approximately what it was at 14:00. In comparison with the maximum mod-eled and measured O3 at the research site (horizontal bars) we find that the O3 is a factor of three lower at Altzomoni than at the same pressure altitude over Mexico City, i.e. continuing photochemical production of O3 has been offset by dilution. The mea-sured O3, however, is almost a factor of two larger than the simulation. This reflects
10
either more actual production of O3 or less dilution than predicted. The comparisons of model and measurements at the research site in SW air, in relation to the simu-lated vertical profiles at Cuautla, shows that the photochemical production of O3by the model overcomes the dilution by mixing as the modeled concentration downwind of Cuautla is slightly larger than the concentration upwind. The measured O3, however,
15
is 0.15 ppm, offthe scale in this figure, suggesting that there is much more O3 actu-ally being produced than predicted. The same is seen in the comparisons in easterly air masses where the measured maximum O3at Altzomoni is 0.11 ppm, twice what is predicted.
When comparing the model predictions and AMS measurements of the PSDs, we
20
have to recognize that the maximum geometric size that can be sampled with approx-imately 100 % efficiency is about 600 nm. This is a result of operating at 630 mb, the average pressure level of Altzomoni. As seen in Figs. 5–8, there is mass that is de-tected beyond this size but the uncertainty due to the decreased aspiration efficiency is much larger and we refrain from placing any significance on differences between the
25
model and the measurements in this size range.
ACPD
12, 9813–9856, 2012Properties of the regional mixed layer
of Mexico’s Megapolis
C. Ochoa et al.
Title Page
Abstract Introduction
Conclusions References
Tables Figures
◭ ◮
◭ ◮
Back Close
Full Screen / Esc
Printer-friendly Version Interactive Discussion
Discussion
P
a
per
|
Dis
cussion
P
a
per
|
Discussion
P
a
per
|
Discussio
n
P
a
per
distributed with a single mode centered at a geometric diameter of 200±20 nm, re-gardless of the time of day, origin of the air mass or chemical composition. Differences were only reflected by changes in the maximum concentration of the peak and area under the curve. From 11:00 to 17:00 there was rarely any indication of particle growth
5
by condensation or coagulation or loss of mass by particle evaporation. The lack of any mode in the small particle size range (<0.1 µm) suggests that by the time the RML
had reached the research site, most of the particles in the Aiken mode had grown into the accumulation mode and there was no formation of new particles. Kleinman et al. (2009) compared a similar observation from air borne measurements downwind of
10
Mexico City. In their studies, they evaluated the size distribution as a function of photo-chemical age that was defined as the negative logarithm of the concentration of NOx to NOy that has a value of 1.0 after approximately 8 h of processing. Baumgardner et al. (2009) showed measurements of CO and O3 made in Mexico City and Altzomoni that showed that on average air from Mexico City, under conditions of WNW
circula-15
tion, reach Altzomoni in approximately 6 h. This corresponds to a photochemical age of around 0.7–0.8. As we did not have measurements of NOx and NOy, we are unable to compute a photochemical age to directly compare with that which was reported by Kleinman et al. (2009). Nevertheless, these investigators reported measurements of the PSDs of organic matter from an AMS on an aircraft. The modal diameter of these
20
PSDS, in the afternoon, was nearly the same as measured at Altzomoni, 200 nm, and shapes were independent of the photochemical age. One difference was that whereas our measurements at Altzomoni show no evidence of a small particle mode, some of the PSDs from the aircraft measurements showed evidence of such a mode in the photochemically young air masses. This was not seen in the PSD in air with a
photo-25
chemical age between 0.8 and 1.
ACPD
12, 9813–9856, 2012Properties of the regional mixed layer
of Mexico’s Megapolis
C. Ochoa et al.
Title Page
Abstract Introduction
Conclusions References
Tables Figures
◭ ◮
◭ ◮
Back Close
Full Screen / Esc
Printer-friendly Version Interactive Discussion
Discussion
P
a
per
|
Dis
cussion
P
a
per
|
Discussion
P
a
per
|
Discussio
n
P
a
per
|
maximum concentration. The reason for the decrease in the modal diameter is that the model predicts another peak in the Aiken mode such that these particles grow by condensation and coagulation into the accumulation mode, shifting the modal diameter to smaller sizes. The measurements indicate that the majority of mass in the Aiken
5
mode must have already shifted into the accumulation mode before the air masses have reached the research site.
The large difference between the modeled and measured sulfate is due to two fac-tors: an overestimate of the SO2 and water vapor mixing ratio and the way that the model handles the inorganic chemistry. An overabundance of SO2 and water vapor
10
will lead to the production of too much sulfate from aqueous chemistry. Secondly, the chemical system considered in MADE, the module that simulates the inorganic chem-istry, is restricted to sulfate, nitrate, ammonium and water components in the aerosol phase. The sulfate formed in the model by oxidation of SO2 in the gas-phase is neu-tralized irreversibly by ammonia to produce ammonium sulfate. Any excess ammonia
15
reacts with nitric acid in the model resulting in the reversible formation of ammonium nitrate aerosol. Hence, we see from figures 8a and b that the simulated sulfate exceeds that which is measured while the measured nitrate exceeds the simulated concentra-tions. The exception was in the easterly air masses where even though the sulfate is greatly overestimated, by 17:00 the modeled and measured concentrations are in
20
close correspondence. This suggests that even though the sulfate is over predicted, by the time all the SO2 had been removed, there remained enough ammonia left to produce the ammonium nitrate. This also indicated that the model was doing a good job of predicting the available nitric acid.
The differences between the modeled and measured PSDs of OM vary with air mass
25
ACPD
12, 9813–9856, 2012Properties of the regional mixed layer
of Mexico’s Megapolis
C. Ochoa et al.
Title Page
Abstract Introduction
Conclusions References
Tables Figures
◭ ◮
◭ ◮
Back Close
Full Screen / Esc
Printer-friendly Version Interactive Discussion
Discussion
P
a
per
|
Dis
cussion
P
a
per
|
Discussion
P
a
per
|
Discussio
n
P
a
per
shift their peak diameters but only increase or decrease in maximum concentration. This matches the behavior of the measurements and is significant since it indicates that there is no longer any growth of the particles by 11:00 and changes are a result of mixing processes.
5
The result that both modeled and measured PSD are lognormal indicates that the use of the lognormal distribution is justified in the model. Barnard et al. (2010) had reached the same conclusion when they evaluated the optical module of WRF-Chem using real chemical data. The WRF-Chem optical module takes the multi-mode lognor-mal PSDs, calculated from the chemical information, to predict the optical coefficients.
10
Barnard et al. (2010) found that when they compared measured optical data with sim-ulated data using measured chemical concentrations in the optical module, the results were satisfactory. When the simulated chemistry was used in the optical module, there were large differences suggesting the modeled chemistry was the source of the error, not the log normal distributions.
15
5 Summary and conclusions
An evaluation of the fidelity of the WRF-Chem chemical transport model has been conducted using measurements taken during the MILAGRO campaign in the region of Mexico City in March 2006. The evaluation compares the simulations of meteorology, selected trace gases and aerosol particle mass size distributions to those that were
20
measured at a remote mountain site 60 km to the southeast of Mexico City for 10 days during the field campaign when there were no clouds or indications of local biomass burning. The comparisons were stratified by the history of the air masses over the 24 h before they arrived at the measurement site. Analysis of the wind fields derived from the North American Regional Reanalysis (NARR) at 650 mb showed that air originated
25
com-ACPD
12, 9813–9856, 2012Properties of the regional mixed layer
of Mexico’s Megapolis
C. Ochoa et al.
Title Page
Abstract Introduction
Conclusions References
Tables Figures
◭ ◮
◭ ◮
Back Close
Full Screen / Esc
Printer-friendly Version Interactive Discussion
Discussion
P
a
per
|
Dis
cussion
P
a
per
|
Discussion
P
a
per
|
Discussio
n
P
a
per
|
parison with the measurements were the correlation coefficient and average difference between the simulated and measured values. The former metric indicates how well the daily trends are simulated while average differences help us assess possible biases.
The analysis shows that the trends in temperature, water vapor mixing ratio and
5
O3 are significantly correlated (P <0.01), after shifting the modeled data with respect to the measurements by a positive one or two hours. The CO trends are also well represented by the model prior to when the RML reaches the measurement site of Altzomoni. After that time the measurements exceed the modeled concentrations by 50–80 %. The APN concentrations are predicted very accurately in the cases when
10
the air masses are from the WNW and SW but underestimated with respect to the measurements in air from the east, although the average trends are well correlated.
Evaluation of the vertical profiles of the CO and O3 at three upwind locations indi-cates that the underestimation of simulated CO when the research site is in the RML is a result of overly vigorous entrainment and mixing of free tropospheric air by the
15
model. The underestimate of the O3could also be related to over dilution, but there is also evidence that more O3 is being produced photochemically than predicted by the model.
The particle size distributions (PSD) of mass concentrations of sulfate, nitrate, am-monium and organic matter (OM) agree very well with respect to the geometric
diame-20
ter of the peak in the log normal distributions that fell within 200±20 nm regardless of the origin of the air mass or its age when the measurement site was in the RML. The major differences were in the sulfate and nitrate PSDs where concentrations of sulfate are over predicted and nitrate under predicted by the model.
The fidelity of the model, validated by the measurements, is generally quite good
25
ACPD
12, 9813–9856, 2012Properties of the regional mixed layer
of Mexico’s Megapolis
C. Ochoa et al.
Title Page
Abstract Introduction
Conclusions References
Tables Figures
◭ ◮
◭ ◮
Back Close
Full Screen / Esc
Printer-friendly Version Interactive Discussion
Discussion
P
a
per
|
Dis
cussion
P
a
per
|
Discussion
P
a
per
|
Discussio
n
P
a
per
The discrepancy in the modeled O3 and OM would probably be improved by a bet-ter emissions inventory of volatile organic compounds, although further investigation is needed to separate differences related to chemistry from those caused by dynamics. In addition, the 3 km×3 km resolution used in the model was not sufficient to resolve
5
some of the smaller scale topographical features. This could contribute to observed dif-ferences in the meteorological parameters and phase lag in the diurnal cycles. Future work will add an additional nested grid at finer resolution centered on the research site. The modeled and observed invariability of the shape of the PSDs and constant peak modal diameter suggest that by at least 6 h of aging downwind of major sources of
10
anthropogenic emissions, the aerosol population can be well represented by a single, lognormal distribution with modal diameter of 200 nm. This could greatly simplify pa-rameterization in climate models although it is not known at this time if this invariance can be extended to other megacity regions.
Acknowledgements. The authors would like to thank the national park of Izta-Popo-Zoquiapan
15
and its personnel for supporting the research at the Altzomoni measurement site and for as-sisting us in maintaining the equipment during the project. We would like to thank Armando Retama, director of the Red Autom ´atica de Monitoreo Atmosf ´erico (RAMA) for providing the RAMA mobile van during the preliminary measurements in November 2005 and the measure-ments from RAMA in the city during March, 2006. We are grateful to TSI Inc, Mexico, for the
20
loan of the Scanning Mobility Particle Sizer (SMPS) that was used during the project and to Lynn Russell, of Scripps Oceanographic Institute, for the loan of the AMS. This project was partially supported by PAPIIT grants #IN-117403 IN-113306. The AMS measurements at Alt-zomoni were partially supported by a grant from the James S. McDonnell Foundation.
References
25
ACPD
12, 9813–9856, 2012Properties of the regional mixed layer
of Mexico’s Megapolis
C. Ochoa et al.
Title Page
Abstract Introduction
Conclusions References
Tables Figures
◭ ◮
◭ ◮
Back Close
Full Screen / Esc
Printer-friendly Version Interactive Discussion
Discussion
P
a
per
|
Dis
cussion
P
a
per
|
Discussion
P
a
per
|
Discussio
n
P
a
per
|
Aiken, A. C., Salcedo, D., Cubison, M. J., Huffman, J. A., DeCarlo, P. F., Ulbrich, I. M., Docherty, K. S., Sueper, D., Kimmel, J. R., Worsnop, D. R., Trimborn, A., Northway, M., Stone, E. A.,
5
Schauer, J. J., Volkamer, R. M., Fortner, E., de Foy, B., Wang, J., Laskin, A., Shutthanan-dan, V., Zheng, J., Zhang, R., Gaffney, J., Marley, N. A., Paredes-Miranda, G., Arnott, W. P., Molina, L. T., Sosa, G., and Jimenez, J. L.: Mexico City aerosol analysis during MILAGRO using high resolution aerosol mass spectrometry at the urban supersite (T0) – Part 1: Fine particle composition and organic source apportionment, Atmos. Chem. Phys., 9, 6633–6653,
10
doi:10.5194/acp-9-6633-2009, 2009.
Barnard, J. C., Fast, J. D., Paredes-Miranda, G., Arnott, W. P., and Laskin, A.: Technical Note: Evaluation of the WRF-Chem “Aerosol Chemical to Aerosol Optical Properties” Module using data from the MILAGRO campaign, Atmos. Chem. Phys., 10, 7325–7340, doi:10.5194/acp-10-7325-2010, 2010.
15
Baumgardner D., Raga G. B., Kok G., Ogren J., Rosas I., Baez A., and Novakov T.: On the evolution of aerosol properties at a mountain site above Mexico City, J. Geophys. Res., 105, 22243–22253, doi:10.1029/2000JD900299, 2000.
Baumgardner, D., Grutter, M., Allan, J., Ochoa, C., Rappenglueck, B., Russell, L. M., and Arnott, P.: Physical and chemical properties of the regional mixed layer of Mexico’s Megapolis,
At-20
mos. Chem. Phys., 9, 5711–5727, doi:10.5194/acp-9-5711-2009, 2009.
Bevington, P. R. and Robinson D. K.: Data reduction and error analysis for the physical sci-ences, third edition, McGraw Hill Companies Inc., New York, NY, USA, 320 pp., 2003. Canagaratna, M. R., Jayne, J. T., Jimenez, J. L., Allan, J. D., Alfarra, M. R., Zhang, Q., Onasch,
T. B., Drewnick, F., Coe, H., Middlebrook, A., Delia, A., Williams, L. R., Trimborn, A. M.,
25
Northway, M. J., Kolb, C. E., Davidovits, P., and Worsnop D. R.: Chemical and microphysical characterization of ambient aerosols with the aerodyne aerosol mass spectrometer, Mass Spectrom. Rev., 26, 185–222, 2007.
Cross, E. S., Slowik, J. G., Davidovits, P., Allan, J. D., Worsnop, D. R., Jayne, J. T., Lewis, D. K., Canagaratna, M., and Onasch, T. B: Laboratory and Ambient Particle Density Determinations
30
using Light Scattering in Conjunction with Aerosol Mass Spectrometry, Aerosol Sci. Technol., 41, 343–359, 2007.