Article
0103 - 5053 $6.00+0.00*e-mail: [email protected]
An Appraisal on the Degradation of Paracetamol by TiO
2/UV System in Aqueous Medium.
Product Identification by Gas Chromatography-Mass Spectrometry (GC-MS)
Ilza Dalmázio,
aTânia M.A. Alves
band Rodinei Augusti*
,aaDepartamento de Química, Universidade Federal de Minas Gerais, Av. Antonio Carlos 6627,
31270-901 Belo Horizonte-MG, Brazil
bCentro de Pesquisas Rene Rachou, Fundação Oswaldo Cruz, 30190-002 Belo Horizonte-MG, Brazil
A oxidação do paracetamol (1) promovida pelo sistema TiO2/UV em meio aquoso foi investigada. O contínuo monitoramento feito por várias técnicas, tais como espectroscopia UV-Vis, HPLC (cromatografia líquida de alta eficiência), TOC (carbono orgânico total) e ESI-MS (espectrometria de massas com ionização electrospray), mostrou que a remoção do paracetamol foi altamente eficiente, mas com um grau reduzido de mineralização. As análises por GC-MS (cromatografia a gás acoplada a um espectrômetro de massas) indicaram que hidroquinona, ácidos carboxílicos alifáticos, e paracetamol mono e dihidroxilados são os principais produtos formados neste processo de degradação. De acordo com estes resultados, uma rota para degradação do paracetamol induzida pelo sistema TiO2/UV foi proposta. A fragmentação dos derivados
trimetilsililados (TMS) do monohidróxi e dihidróxi paracetamol, baseada em dados dos espectros de massas, foi também proposta.
The advanced oxidation of paracetamol (1) promoted by TiO2/UV system in aqueous medium was investigated. Continuous monitoring by several techniques, such as UV-Vis spectroscopy, HPLC (high performance liquid chromatography), TOC (total organic carbon), and ESI-MS (electrospray ionization mass spectrometry), revealed that whereas the removal of paracetamol was highly efficient under these conditions, its mineralization was not likewise accomplished. GC-MS (gas chromatography-mass spectrometry) analysis showed that hydroquinone, aliphatic carboxylic acids, monohydroxy and dihydroxy paracetamol were the main products formed as a result of such degradation process. Based on these results, a reaction route for the degradation of paracetamol induced by the TiO2/UV system was suggested. Fragmentation pathways, as obtained from the mass spectra data, were also proposed for the trimethylsilyl (TMS) derivatives of monohydroxy and dihydroxy paracetamol.
Keywords: paracetamol, advanced oxidation process, GC-MS
Introduction
In recent years, there has been growing interest on the occurrence and fate of pharmaceuticals (antiinflammatories, analgesics, betablockers, lipid regulators, antibiotics, antiepileptics, and estrogens) and active ingredients in personal care products (PCPs) in the aquatic environment. These compounds and their bioactive metabolites are continuously introduced in the environment via a number of routes but
mainly by both untreated and treated wastewater.1
Several research efforts are in progress to avoid the accumulation of these pollutants in the aquatic
environment.2 The development of oxidation techniques
for achieving the reduction of water pollution has been
proposed.3,4 Various works have reported the successful
employment of ozonation and advanced oxidation
processes (AOPs), such as the O3/H2O2, Fenton, and TiO2/
UV systems, for the degradation of pharmaceuticals and
their metabolites in water.5-8
Paracetamol (N-(4-hydroxyphenyl)acetamide) is
regularly used as analgesic and antipyretic drug, as material for the azo dyes production, as photographic chemicals, and for chemical control of Brown Tree snakes population. Its occurrence in environment has attracted interest as a
potential contaminant of waters. Levels of 1 up to 6Mg L-1
effluents9 and up to 10 Mg L-1 in water samples from natural
sources in USA.10 The degradation of such compound
have been conducted by using the following oxidative
systems: O3/H2O2/UV,11,12 O
3/UV plus Fe
2+or Cu2+ as
catalysts,13 electrogenerated H
2O2/UV with Fe
2+or Cu2+
as catalysts,14 and anodic oxidation with a boron-doped
diamond electrode.15
No previous works have been reported on the degradation of paracetamol in aqueous solution by the
TiO2/UV oxidative system, although a related study on
the H2O2/TiO2 photocatalytic oxidation of metol (an
structurally-related molecule) has been performed.16
Hence, the aim of this report is to evaluate the efficiency
of the TiO2/UV system in promoting the degradation
of paracetamol in aqueous solution by using assorted techniques as UV-Vis, HPLC-UV, TOC, and ESI-MS. The products resulting from such photocatalytic oxidative process are characterized via GC/MS analysis of the derivatized samples.
Experimental
Chemicals
All reagents, i.e. paracetamol (purchased from
Sigma-Aldrich, Milwaukee, WI, USA), TiO2 P25 (Degussa,
Americana, SP, Brazil), and HPLC grade methanol (Merck, Whitehouse Station, NJ, USA), were used without further purification. Doubly-distilled water was used to prepare the solutions in all experiments.
Degradation system
100 mL of an aqueous solution of paracetamol
(1.0r 10-4 mol L-1) and TiO
2 (0.1 g L
-1) was irradiated using
a monochromatic UV lamp bulb (254 nm, 15 W, Philips TUV G5T8). Aliquots were taken at several reaction times, submitted to centrifugation at 2600 rpm/10 minutes, and immediately stocked at 4 °C for subsequent analysis. For analysis control, a small portion of the initial paracetamol
and TiO2 solution was kept protected from light at 4 °C.
Analytical methods
UV-Vis spectroscopy
Absorbance measurements of samples (diluted 10 times) were performed using a Cary 50 Conc instrument (Varian, Mulgrave, Australia) equipped with a quartz cell with a 1 cm path length and using baseline
correction, scan rate of 300 nm min-1, and data point
interval of 0.5 nm.
HPLC-UV
The analyses were carried out on an SPD-10A instrument (Shimadzu, Kyoto, Japan) using a ODS Hypersil
column (250 mm length, 4.6 mm i.d., 5 Mm particle size).
The following operating conditions were employed:
isocratic elution of MeOH/H2O (15:85), flow rate of 1 mL
min-1, injection volume of 20 ML, and UV detector set up
at 205 and 243 nm.
TOC
The analyses were carried out in a TOC 5000A (Shimadzu, Kyoto, Japan) instrument at 680 °C using a platinum catalyst.
ESI-MS
The analyses were conducted in a LCQ Advantage (ThermoElectron, San Jose, CA, USA) mass spectro-meter operating in the positive and negative ion modes with electrospray ionization (ESI) source. The mass spectra were obtained as an average of 50 scans. The aliquots were directly injected into the ESI source at a
flow rate of 5 ML min-1 by using a micro syringe. ESI
source conditions were as follows: heated capillary
temperature 200 °C; sheath gas (N2) flow rate 20 units
(ca. 0.30 L min-1); spray voltage 4.5 kV; capillary voltage
25 V; tube lens off set voltage 25 V. For ESI-MS/MS, the precursor ions were first isolated by applying an appropriate waveform across the end cap electrodes of the ion trap to resonantly eject all trapped ions except
those ions of the m/z ratio of interest. The isolated ions
were then subjected to a supplementary ac signal to resonantly excite them and so cause collision-induced dissociation (CID). The relative collision energy was set to a value at which product ions were produced in measurable abundance and varying from 18 to 40 %. The isolation width used in the MS/MS experiments was 1 unit.
GC-MS
GC-MS analyses were performed using a gas chromatograph (Trace Ultra) coupled to a mass spectrometer (PolarisQ Ion Trap) (ThermoElectron, San Jose, CA), with RTX-5MS column (5 % diphenyl, 95 % dimethyl polysiloxane) 30 m x 0.25 mm i.d. (Restec, Ireland) and the splitless mode. The temperature program
was as follow: 80 °C for 1 min, 7 °C min-1 up to 150 °C,
hold time of 5 min, 7 °C min-1 up to 200 °C, hold time of
5 min. The injector, transfer line and detector temperatures
were kept at 250, 275 and 200 oC, respectively. The MS
detector was operated in the EI mode at 70 eV with a scan
Sample derivatization
In a typical run, a reaction aliquot (1 mL) was centrifuged, the aqueous layer isolated, and water completely removed under vacuum at 40 °C. Subsequently, 1.5 mL of acetonitrile was added and the solvent
completely evaporated under a gentle N2 flux. 50 ML of
a solution of N,O-bis-(trimethylsilyl)trifluoroacetamide (BSTFA):acetonitrile (1:1) was then added and the resulting mixture exposed to a constant irradiation (power of 480 W) from a domestic microwave oven (Panasonic,
Manaus, Brazil) for 3 min. Finally, 200 ML of acetonitrile
was added and the resultant solution inserted into the GC inlet.
Results and Discussion
Degradation of paracetamol
The degradation of paracetamol (1) in aqueous
solution by TiO2/UV was initially monitored by UV-Vis
spectroscopy. The UV-Vis spectra (not shown) undergo changes as the reaction proceeds. The absorption maximum
at the two characteristic wavelengths of 1, i.e. ca. 195
and 243 nm, continuously decreases. After 150 min of reaction, the UV-Vis spectra show only an absorption band at 210-190 nm.
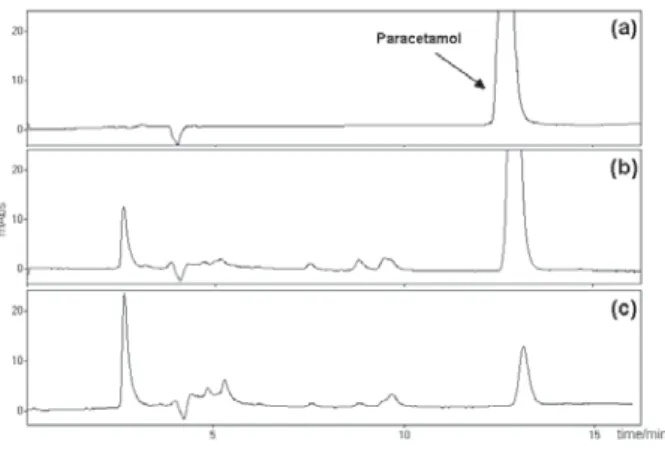
Figure 1 shows the HPLC-UV chromatograms obtained from aliquots collected upon reaction times of 0, 60 and 160 min. It can be noted that the area of the paracetamol peak (retention time of 12.40 min) decreases as the reaction advances and, most important, new peaks, with retention times shorter than that of paracetamol (retention times of 2-6 and 8-10 min) and with crescent areas, appear.
Figure 2 shows the plot of normalized paracetamol peak area and the solution total organic carbon (TOC) as a function of reaction time. Whereas about 90 % of paracetamol is consumed after a reaction time of 160 min, only 35 % of TOC removal is observed. These results thus indicate that the degradation of paracetamol does not occur with its complete
mineralization, i.e. its conversion to CO2, H2O and other
small molecules, and thus other organic compounds are being continuously formed in solution. This finding is also corroborated by the UV and mainly HPLC-UV data. It must also be said that the use of a lower value for the concentration
of TiO2 (0.1 g L-1 as compared with 1 g L-1 usually employed
in a number of papers described in literature)17-19 did not cause
the complete mineralization of paracetamol thus allowing the detection of intermediates in significant amounts, as will be shown following in this paper.
ESI-MS monitoring
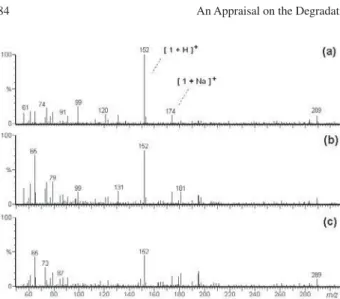
Figure 3 shows the ESI mass spectra in the positive
ion mode, ESI(+)-MS, of the paracetamol (1) aqueous
solution (a) and for aliquots taken upon reaction times of 60 min (b) and 160 min (c). In the paracetamol aqueous
solution, intense and prominent signals of m/z 152,
corresponding to protonated paracetamol, [1 + H]+, and
of m/z 174, corresponding to [1 + Na]+, are observed.
The fragmentation of the [1 + H]+ cation upon
collision-induced dissociation (CID) yielded mainly a fragment
ion of m/z 110 by the loss of ketene CH2CO,i.e. [1 + H –
CH2CO]+ (spectrum not shown). As expected, the CID of
the [1 + Na]+ yielded a similar fragmentation (not shown).
The degradation of paracetamol by the TiO2/UV system
was monitored in intervals of 20 min. As can be seen in the ESI mass spectra of the aliquots taken upon reaction times of 60 and 160 min (Figures 3b and 3c, respectively),
Figure 1. HPLC chromatograms (the UV detector was set at 205 nm) of:
(a) an aqueous solution of paracetamol at 1.0 r 10-4 mol L-1; and aliquots taken after exposition times of (b) 60 min and (c) 160 min to the TiO2/UV system. Note the appearance of new chromatographic peaks with retention times shorter than that of paracetamol (tR = 12.40 min).
Figure 2. Normalized concentration (Ci/C0) of paracetamol (as determined
by HPLC monitoring) and total organic carbon (TOCi/TOC0) as a function of reaction time as induced by the TiO2/UV system (C0 = 1.0 r 10-4 mol L-1 corresponding to a TOC
the intensity of the ion [1 + H]+ (m/z 152) decreased as
the reaction proceeded thus indicating the continuous
consumption of 1. The presence of other ions in these mass
spectra (Figures 3b-c) that could indicate the formation of degradation products was not consistently and reliably
verified.20-22 Maybe the very low concentration of such
compounds in relation to that of paracetamol prevented their detection. Similar behavior was also observed when the monitoring was performed by using electrospray ionizations mass spectrometry in the negative ion mode, ESI(-)-MS (spectra not shown). Also in this case, only the
anion of m/z 150 (deprotonated paracetamol, [1 – H]-) was
observed in all the aliquots analyzed. Its absolute intensity was observed to decrease as the reaction time increased, with no clear evidences that could confirm the formation of degradation products.
Reaction monitoring and products characterization by GC-MS
GC-MS analyses were performed by a meticulous comparison between the chromatogram of the initial paracetamol solution (control sample, Figure 4a) with the chromatograms of the aliquots taken at consecutive reaction times. All samples were submitted to exactly the same derivatization procedure (see Experimental section for more details). Figure 4b shows, for instance, the chromatogram obtained for an aliquot withdrawn
after a reaction time of 150 min. The labeled peaks (a-l),
as shown in Figure 4b, either appeared or exhibited noticeable changes in their areas as the reaction proceeded. A more detailed inspection in Figure 4, although not promptly visualized, reveals a noticeable
decrease in the areas of the peaks e and f (paracetamol
derivatives) whereas the area of the other labeled peaks increased continuously as the reaction proceeded. These GC-MS data are thus consistent, within the error range, with the HPLC results, as previously shown in Figure 2. Conversely, the areas of the unlabeled peaks, including the ones in the chromatogram of the control solution (Figure 4a), stayed practically constant during the reaction monitoring. These unlabeled peaks were thus postulated to be related to compounds originated exclusively from
the derivatization reagents.23
The chemical structures of the compounds related to
the labeled peaks (a-l, Figure 4b) were determined based
on the following protocols: (i) comparison of their mass
spectra with the ones found in the NIST library, available in the instrument database, considering a similarity level
higher than 90 %; (ii) comparison with results of similar
investigations on paracetamol degradation previously
reported in literature12 by the system H
2O2/UV; and (iii)
evaluation of their MS fragmentation profiles (Table 1).
The only exception was the compound related to peak b for
which a reliable chemical structure could not be proposed. Therefore, the compounds that eluted at retention times of
17.80 (peak e) and 20.73 min (peak f) were characterized
to be [1-di-TMS] and [1-TMS],i.e. the di- and mono-TMS
derivatives of paracetamol (1), respectively (paracetamol
has two active protons, the OH group at the acetamide
moiety in its tautomeric form (-N=C-(Me)-OH) and mainly
the phenolic hydroxyl that can be promptly silylated under these conditions, Scheme 1).
The area of such peaks (e and f) decreased continuously
as the reaction advanced thus indicating the continuous consumption of paracetamol. On the other hand, the area of the other peaks continuously increased and the corresponding eluted compounds were identified as
Figure 3. ESI-MS monitoring of the degradation of paracetamol by the
TiO2/UV system after: (a) 0 min; (b) 60 min; and (c) 160 min. The relative abundances of all ions in the three MS spectra are related to the abundance of the ion of m/z 152 ([1 + H]+) in the first spectrum.
Figure 4. GC-MS chromatograms obtained upon derivatization of aliquots
being (compound number; peak label): fumaric acid
(2-di-TMS;a), hydroquinone (3-di-TMS;c), malic acid
(4-tri-TMS;d), monohydroxy paracetamol (5-tri-TMS;g
andh), monohydroxy paracetamol (5-di-TMS;i and k),
and dihydroxy paracetamol (6-tetra-TMS; j and l). The
chemical structures for the compounds 1-TMS,1-di-TMS,
2-TMS,3-di-TMS, and 4-tri-TMS were attributed based on
the information furnished by the NIST mass spectra library,
and5-di-TMS was attributed based on data previously
reported in literature (Table 1). On the other hand, the
chemical structures for the compounds 5-tri-TMS and
6-tetra-TMS were proposed based on the interpretation of
the respective MS fragmentation profiles.
Both positional isomers of the tri-TMS derivatives of
monohydroxy paracetamol, (5-tri-TMS, Scheme 2), that
eluted at retention times of 22.16 (peak g) and 22.41 min
(peak h) (Figure 4b), displayed similar mass spectra
(Table 1). In these mass spectra, it can be observed the
molecular ion (M·+) of m/z 383 and prominent fragments
ofm/z 368 ([M – CH3]+), 147 ([(CH
3)3Si-O=Si(CH3)2] +),
116 [(CH3)3SiOCNH]+), and 73 ([Si(CH
3)3]
+), besides
other signals involving losses of the silyl groups (Scheme 3). Remarkable differences, however, in the relative abundances of some specific fragments in the mass spectra of both isomers can be observed. Thus, the fragments of
m/z 294, 206 and 147 show to be more abundant in the
mass spectrum of the isomer that eluted at 22.16 min
(peakg) whereas the fragments of m/z 280, 269 and 253
are noticeably more intense in the mass spectrum of the
isomer related to the chromatographic peak h (Table 1 and
Scheme 3). The correct association between each isomer
to each chromatographic peak (g and h) was thus proposed
based on the distinct relative abundance of the fragment
ofm/z 147 ([(CH3)3Si-O=Si(CH3)2]+) in both mass spectra
(Table 1). Hence, the compound that eluted at 22.16 min
(peakg), whose mass spectrum displays the fragment of
m/z 147 in a higher abundance in comparison to its isomer
(peakh), likely possesses both the OTMS groups at adjacent
positions (i.e. the second OTMS group is located at the
meta position in relation to the acetamide moiety), since
this array could favor the formation of such an ion, i.e.
[(CH3)3Si-O=Si(CH3)2]+ of m/z 147 (Scheme 2).
Four possible positional isomers can be formed upon the double hydroxylation of paracetamol. However, only
two peaks (j and l), related to the tetra-sylilated derivatives
of dihydroxy paracetamol ([6-tetra-TMS]) with a nominal
mass of 471 Da, were detected in the chromatogram displayed in Figure 4b. The reasons for the formation of only two isomers under these reaction conditions, although not fully understood, is possibly related to the remarkable differences in reactivity that the distinct ring positions of monohydroxy paracetamol can undergo towards electrophilic attack by hydroxyl radicals (a more detailed explanation on the reaction mechanism is furnished later in this paper). The mass spectra of both isomers shown
the presence of the molecular ion (M·+) of m/z 471 as well
as characteristic fragments of m/z 456 ([M – CH3]+), 147
([(CH3)3Si-O=Si(CH3)2]+), 116 [(CH
3)3SiOCNH]
+), and
73 ([Si(CH3)3]+). Consecutive neutral losses of (CH
3)2SiO,
Si(CH3)4, and CH3CN from the ion of m/z 456 to generate
the fragments of m/z 382, 294, 253, and 206, as shown in
Scheme 4, were also observed. Also in this case, differences in the relative abundances of such fragments could be noted, although much less pronounced in comparison to those
Scheme 1. TMS derivatives formed upon the sylilation of paracetamol (1). Scheme 2. TMS derivatives formed upon the sylilation of monohydroxy
paracetamol (5).
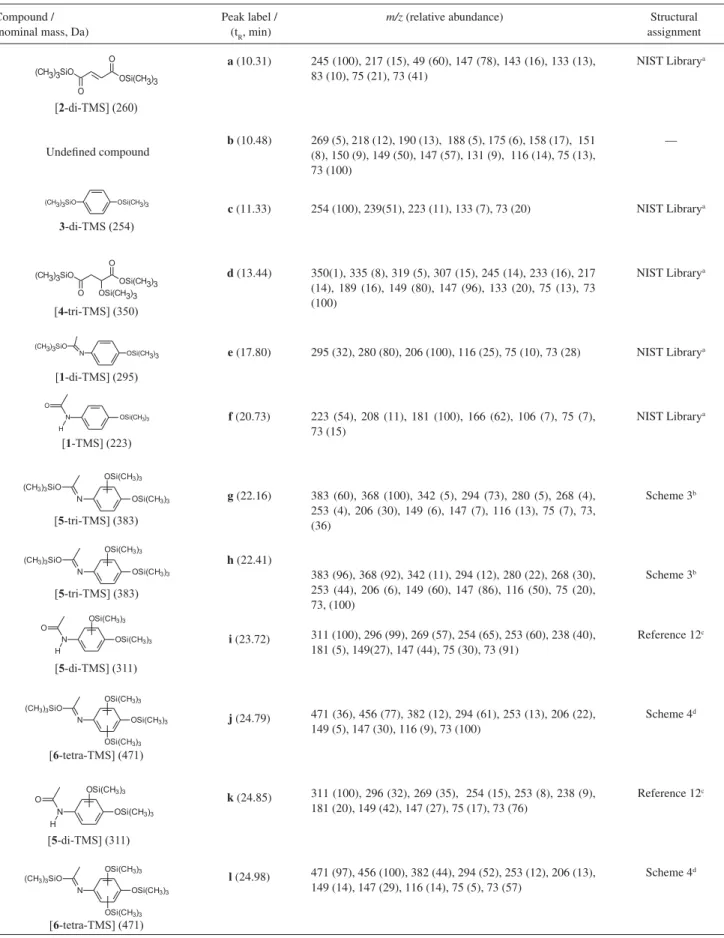
Table 1. GC-MS data of an aliquot of a paracetamol aqueous solution at 1.0 r 10-4 mol L-1 treated with the TiO
2/UV system for 150 min. The aliquot was derivatized with BSTFA prior to the analysis
Compound / Peak label / m/z(relative abundance) Structural
(nominal mass, Da) (tR, min) assignment
a (10.31)
b (10.48)
c (11.33)
d (13.44)
e (17.80)
f (20.73)
g (22.16)
h (22.41)
i (23.72)
j (24.79)
k (24.85)
l (24.98)
245 (100), 217 (15), 49 (60), 147 (78), 143 (16), 133 (13), 83 (10), 75 (21), 73 (41)
269 (5), 218 (12), 190 (13), 188 (5), 175 (6), 158 (17), 151 (8), 150 (9), 149 (50), 147 (57), 131 (9), 116 (14), 75 (13), 73 (100)
254 (100), 239(51), 223 (11), 133 (7), 73 (20)
350(1), 335 (8), 319 (5), 307 (15), 245 (14), 233 (16), 217 (14), 189 (16), 149 (80), 147 (96), 133 (20), 75 (13), 73 (100)
295 (32), 280 (80), 206 (100), 116 (25), 75 (10), 73 (28)
223 (54), 208 (11), 181 (100), 166 (62), 106 (7), 75 (7), 73 (15)
383 (60), 368 (100), 342 (5), 294 (73), 280 (5), 268 (4), 253 (4), 206 (30), 149 (6), 147 (7), 116 (13), 75 (7), 73, (36)
383 (96), 368 (92), 342 (11), 294 (12), 280 (22), 268 (30), 253 (44), 206 (6), 149 (60), 147 (86), 116 (50), 75 (20), 73, (100)
311 (100), 296 (99), 269 (57), 254 (65), 253 (60), 238 (40), 181 (5), 149(27), 147 (44), 75 (30), 73 (91)
471 (36), 456 (77), 382 (12), 294 (61), 253 (13), 206 (22), 149 (5), 147 (30), 116 (9), 73 (100)
311 (100), 296 (32), 269 (35), 254 (15), 253 (8), 238 (9), 181 (20), 149 (42), 147 (27), 75 (17), 73 (76)
471 (97), 456 (100), 382 (44), 294 (52), 253 (12), 206 (13), 149 (14), 147 (29), 116 (14), 75 (5), 73 (57)
NIST Librarya
—
NIST Librarya
NIST Librarya
NIST Librarya
NIST Librarya
Scheme 3b
Scheme 3b
Reference 12c
Scheme 4d
Reference 12c
Scheme 4d
The structural assignments were performed based on: athe comparison with the mass spectra of the NIST library (available in the GC-MS database); bthe interpretation of the fragmentation profiles as displayed in Scheme 3; cresults previously described in reference 12, which describes the degradation of paracetamol by the UV/H2O2 system; dthe interpretation of the fragmentation profiles as shown in Scheme 4.
observed in the mass spectra of the isomeric compounds
[5-tri-TMS] (Table 1). Hence, a clear distinction and
characterization among these isomers, as previously
discussed for the [5-tri-TMS] isomeric compounds, could
not be accomplished.
The reaction mechanism
From the chemical structures of the compounds detected by the GC-MS analyses, a reaction route for the
paracetamol degradation by the TiO2/UV system in aqueous
medium was thus proposed (Scheme 5). The degradation of
organic compounds by the TiO2/UV system is well-known
to occur via the in situ generation of free hydroxyl radicals
UV-light absorption by the TiO2 composite at wavelengths
higher than that of its band gap, which is sufficient to
generate the so-called electron-hole (h+/e–) pair. The excited
electron can reduce the oxygen molecule to form the radical
anion O2 , whereas the hole h+ can react either with the
target compound or with water, leading to the formation of
can readily attack organic molecules and thus a sequence of reactions can be initiated, resulting in a partial or total
degradation of target organic compounds.24 In Scheme 5,
1)
was thus proposed. This attack could lead to the formation
of: (i) hydroquinone (3),via a mechanism involving the
ipso substitution of the acetamide moiety by the hydroxyl
radical, and (ii) the two positional isomers of monohydroxy
paracetamol (5),via an electrophilic attack of hydroxyl
radical at both the available positions of the aromatic ring
of 1. Compound 5 can be further hydroxylated, via an
identical electrophilic substitution mechanism, to yield
dihydroxy paracetamol (6) (as several positional isomers-
see previous discussion). Finally, successive oxidation of
such intermediates (especially 6) is suggested to lead the
formation of fumaric (2) and malic acid (4), which could
thus be further converted to CO2 and H2O (in a process
known as mineralization). A very similar mechanism has
Scheme 4. Proposed MS fragmentation pathways for the isomeric compounds [6-tetra-TMS].
Scheme 5. Reaction pathways proposed for the formation of products 2-6 upon the reaction of paracetamol (1) with the TiO2/UV system in aqueous
also been proposed for the degradation of paracetamol
by the H2O2/UV system, which also promotes the in situ
formation of hydroxyl radicals, with the attainment of
similar products than those described herein.11,12
Conclusions
As revealed by a set of techniques such as UV-Vis,
HPLC-UV, ESI-MS, and GC-MS, the TiO2/UV system
showed to be highly efficient in promoting the degradation of paracetamol, a widely used analgesic, in aqueous medium. However, as indicated by the TOC data, such a system did not produce the mineralization of paracetamol at the same extent. GC-MS analyses of the derivatized aliquots pointed to the formation of a number of products, such as: hydroquinone, monohydroxy paracetamol, dihydroxy paracetamol and lastly aliphatic carboxylic acids (fumaric and malic acid). These compounds were suggested to be formed as a result of successive hydroxylations at the benzene ring moiety of paracetamol which at the end brought about its rupture. Furthermore, the reaction mechanism was proposed to involve the formation of hydroxyl radicals, highly reactive species, as a result of
an initial interaction between the UV-light and the TiO2
composite. Finally, the threat that these degradation products can represent to the environment and human health must be carefully evaluated.
Acknowledgments
The authors thank FAPEMIG and CNPq for financial support.
References
1. Daughton, C. G.; Ternes, T. A.; Environ. Health Persp.1999, 107, 907.
2. Petrovic, M.; Gonzalez, S.; Barcelo, D.; TrAC, Trends Anal. Chem.2003,22, 685.
3. Bautitz, I.; Nogueira, R. F. P.; J. Photochem. Photobiol., A 2007, 187, 33.
4. Nogueira, R. F. P.; Guimaraes, J. R.; Water Res.2000,34, 895. 5. Huber, M. M; Canonica, S.; Park, G. Y.; von Gunten, U.;
Environ. Sci. Technol.2003, 37, 1016.
6. Zwiener, C.; Frimmel, F. H.; Water Res.2000,34, 1881. 7. Ravina, M.; Campanella, L.; Kiwi, J.; Water Res.2002,36, 3553. 8. Doll, T. E.; Frimmel, F. H.; Water Res.2004,38, 955. 9. Ternes, T. A.; Water Res.1998,32, 3245.
10. Kolpin, D. W.; Furlong, E. T.; Meyer, M. T.; Thurman, E. M.; Zaugg, S. D.; Barber, L. B.; Buxton, H. T.; Environ. Sci. Technol. 2002,36, 1202.
11. Andreozzi, R.; Caprio, V.; Marotta, R.; Vogna, D.; Water Res. 2003,37, 993.
12. Vogna, D.; Marotta, R.; Napolitano, A.; D’Ischia, M.; J. Org. Chem.2002,67, 6143.
13. Skoumal, M.; Cabot, P. L.; Centellas, F.; Arias, C.; Rodriguez, R. M.; Garrido, J. A.; Brillas, E.; Appl. Catal., B 2006,66, 228. 14. Sires, I.; Garrido, J. A.; Rodriguez, R. M.; Cabot, P. I.; Centellas,
F.; Arias, C.; Brillas.; J. Electrochem. Soc.2006,153, D1. 15. Brillas, E.; Sires, I.; Arias, C.; Cabot, P. L.; Centellas, F.;
Rodríguez, R. M.; Garrido, J. A.; Chemosphere2005,58, 399. 16. Aceituno, M.; Stalikas, C. D.; Lunar, L.; Rubio, S.;
Perez-Bendito, D.; Water Res.2002,36, 3582.
17. Muneer, M.; Das, S.; Manilal, V. B.; Haridas, A; J. photochem. photobiol., A 1992,63, 107.
18. Madeira, P.; Nunes, M. R.; Borges, C.; Costa, F. M.; Florencio, M. H.; Rapid Commun. Mass Spectrom. 2005,19, 2015. 19. Florêncio, M. H.; Pires, E.; Castro, A. L.; Nunes, M. R.; Borges,
C.; Costa, F. M.; Chemosphere2004,55, 345.
20. Santos, L. S.; Dalmázio, I.; Eberlin, M. N.; Claeys, M.; Augusti, R.;Rapid Commun. Mass Spectrom.2006,20, 2104. 21. Moura, F. C. C.; Araujo, M. H.; Dalmázio, I.; Alves, T. M. A.;
Santos, L. S.; Eberlin, M. N.; Augusti, R.; Lago, R. M.; Rapid Commun. Mass Spectrom. 2006,20, 1859.
22. Dalmázio, I., Santos, L. S.; Lopes, R. P.; Eberlin, M. N.; Augusti, R.;Environ. Sci. Technol.2005,39, 5982.
23. Little, J. L.; J. Chromatogr., A1999,844, 1.
24. Ziolli, R. L.; Jardim, W. F.; Quim. Nova1998,21, 319.
Received: March 22, 2007