http://dx.doi.org/10.1590/S1982-21702015000100011
A MODEL SUGGESTION FOR THE DETERMINATION OF
THE TRAFFIC ACCIDENT HOTSPOTS ON THE TURKISH
HIGHWAY ROAD NETWORK: A PILOT STUDY
Sugestão de modelo para a determinação de pontos críticos de acidentes de tráfego na rede de estradas de rodagem da Turquia: um estudo piloto
SAFFET ERDOGAN1,* VELI ILÇI2 OMER M. SOYSAL3 AYSEGUL KORKMAZ4
1*
Department of Geomatics, Faculty of Engineering, Afyon Kocatepe University, TR-03200, Afyonkarahisar, Turkey
2
Department of Geomatics, Faculty of Engineering, Çorum Hitit University, TR-19200, Çorum, Turkey
3
Department of Information Systems and Decision Sciences,Louisiana State University, Baton Rouge 70803, USA
4
General Directorate of Highways, TR-06100, Ankara, Turkey [email protected]; [email protected]; [email protected];
ABSTRACT
Traffic accidents are very serious problems for human life and the environment. In road safety, it is crucial to identify the high risk locations to apply proper counter measures. This paper aims at introducing outcomes of a pilot project whose main goal is to develop a GIS based crash analysis system integrated with the quantitative methods for identification of high risk locations on road networks in Turkey. In this concept, traditional hotspot detection methods used in Turkey(crash frequency, rate, and severity) are compared with the spatial statistical methods including Moran‟s I, GetisOrd G and planar and network kernel density estimation in terms of their sensitivity to spatial characteristics of crash clusters.
at obtaining a model including different hotspot identification methods for the safety program of Turkey. In order to obtain the model, many hotspot detection methods will be used and compare stage by stage. In the first stage, the seven methods mentioned above are used and examined. Although some of these methods are compared in couple, there is no study using all these methods together extensively in the literature. Methods validated with a different spatial vantage points. Repetitiveness of hotspots in a seven years period are used to compare the methods. Meanwhile advantages and disadvantages of the methods according to location of hotspots are examined additionally. Results show that using planar KDE with Gi in
the junction locations and using planar KDE with Moran‟s I in the straight road
locations could improve the model while determining hotspots
Keywords: Traffic Accidents; Hotspot; Spatial Statistical Methods; GIS.
RESUMO
Acidentes de trânsito são sérios problemas para os seres humanos e para o meio ambiente. Para msegurança nas estradas, é crucial que se verifique os locais de alto risco para aplicar contra-medidas apropriadas. Este trabalho objetiva introduzir resultados de um projeto piloto cujo objetivo principal é o desenvolver um sistema de análise de acidentes baseado em SIG integrado com métodos quantitativos para identificar os locais de alto risco em rede de estradas de rodagem na Turquia. Neste conceito, métodos tradicionais de detecção dos pontos críticos usados na Turquias (freqüência de acidentes, velocidade e severidade) são comparados com métodos
estatísticos espaciais incluindo Moran‟s I, GetisOrd G, Planar e densidade do núcleo
da rede estimados nos termos de sua sensitividade para as características espaciais de uma série de acidentes. Muitos países usam métodos de detecção de pontos críticos tradicionais tais como freqüência, velocidade e sensitividade assim como na Turquia. Neste projeto, nós tencionamos obter um modelo incluindo diferentes métodos de identificação de pontos críticos para um programa de segurança na Turquia. A fim de obter o modelo, muitos modelos de detecção de pontos críticos serão usados e comparados por estágio. No primeiro, os sete métodos mencionados acima serão usados e examinados. Apesar de alguns destes métodos serem comparados em duplas, não há nenhum estudo na literatura usando todos juntos extensivamente. Métodos validaram pontos de natureza espacial diferente. A repetição de pontos críticos num período de sete anos, são usados para comparar os métodos. Enquanto isto, vantagens e desvantagens de métodos de acordo com a localização de pontos críticos são examinadas adicionalmente. Os resultados mostraram que usando o Planar KDE com Gi nos locais de encruzilhadas e usando o
Planar KDE com Moran‟s I em locais de estrada retas poderiam melhorar o modelo
enquanto se determina os pontos críticos.
1. INTRODUCTION
million people die and 45 million people are injured in road traffic accidents around the world each year. Likewise, the number of fatalities in traffic accidents has increased from 1 billion in 2001to 1.4 billion in 2011,with a ranking increase from position 11to 9 as the leading cause of death. It is expected that 17 million people will lose their lives and more than 200 million people will be severely and permanently injured by 2020, on roads all over the world (WHO, 2013).
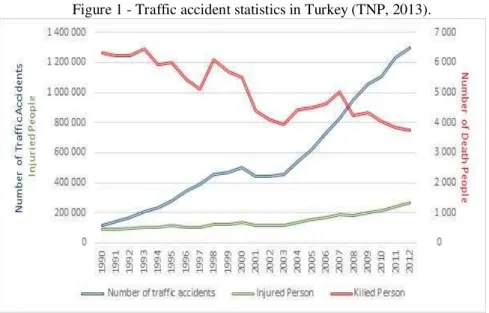
Turkey, a rapidly developing country, is a junction point between Asia and Europe in terms of its social and economic structure. Following the world trends, approximately 42000 people lose their lives due to traffic accidents, while approximately 3.5 million people are injured each year (ETSC, 2013).According to statistics from the General Directorate of Police, the number of accidents in Turkey has increased from 440000 in 2002 to 1296636 in 2012. On average, 4000 people die and 170000 are injured each year (TNP, 2013).Despite great improvements in the road infrastructure during this period, the increase in the number of motor vehicles paralleled to the economic growth has caused the number of road traffic accidents to rise enormously. Although there has been an increase in the number of traffic accidents, deaths caused by traffic accidents have reduced. According to the Who, Turkey is ranked at 146out of192 countries, in terms of the estimated road traffic death rate per 100000 of population. The number of traffic accidents, deaths, and injuries from 1990 to 2012 is shown in Figure 1.On the other hand, the economic impact of traffic accidents is equivalent to 2 percent of gross national product in terms of economic loss. The cost of traffic accidents is expected to be 22 billion Turkish lira.
Any effort to reduce the impact of traffic accidents is crucial. Among these, locating the high risk locations, so called hotspots, and identifying possible causes have been studied extensively. Hotspot identification is usually the first step in a safety improvement program. In many safety improvement programs sites are ordered according to ranking criteria and a subset of sites are then selected as the highest accident risk sites. Since budgets are limited, the priority is given to these locations for the implementation of precautionary measures.
The current practice of the Turkish Highway Agency is to apply a rate quality-control method, which combines the crash rate, frequency, and severity as ranking criteria. Raw risk estimators have several limitations, such as incorrect classification due to the random variation of traffic accidents year by year, as discussed in a number of studies (HAUER, 1997; MIAU and SONG, 2005). Therefore, we aimed to develop a model including both traditional and model based spatial statistical methods to determine the hotspots on a geographical information system (GIS) platform. The project has three main stages: in the first stage, the study area will be examined for hotspots based on the crash rate, the crash frequency, and the crash severity ranking, Kernel density analysis, and local spatial autocorrelation methods
(Moran‟s I, GetisOrd G). In the second stage, Poisson regression, Negative binomial
regression and Empirical Bayesian methods will be implemented. In the last stage, methods will be weightened according to the results. In this paper, we present our findings for the only first stage.
2. LITERATURE REVIEW
As mentioned above, traffic safety is the most critical matter in the transportation strategy of many agencies. Increasing traffic safety on the highway network is the aim of many countries‟ comprehensive safety programs. Today,
highway agencies use different hotspot techniques. In his study, Elvik (2008) considered hotspot definitions and hotspot detection approaches in eight European countries. He proposed four criteria for an adequate definition of a hotspot location. According to Elvik, a good system 1) should control for random fluctuations in the number of accidents, 2) should account for as many of the factors that are known to influence road safety as possible, 3) should identify sites at which fatal and serious injury accidents are over represented, and 4) should identify sites at which local risk factors related to road design and traffic control make a substantial contribution to accidents. In addition, he suggests that the identification of hotspots should rely on the EB method because of these criteria.
Meulenerset al. (2008b) studied the international black spot programs in 12 different countries including the USA, Belgium, the UK, the Netherlands, Denmark, Portugal, Canada, New Zealand, Germany, Sweden, Austria and Norway. According to Meulenerset al. the majority of the countries uses a non-model based (crash number and crash frequency) black spot identification. Meanwhile, a few countries, such as Canada, Texas, Austria and the UK use the „crash rate‟ method (crashes per vehicle km). Only three countries identified the use of model-based methods of identification, including category analysis in Kentucky, USA, the Poisson statistical method in Denmark and the Empirical Bayes approach in Portugal. All three of these countries use these methods in combination with the non-model based „crash number‟ method.
Similarly, Sorensen and Elvik (2007) examined the same European countries
and reported their studies under the title of “Best Practice Guidelines on Black Spot Management and Safety Analysis of Road Networks” in the six European
Framework Programs. They rated Model-based methods as best practice for black spot identification, because of the usage of statistical techniques that take into account systematic variation determined by general road design and traffic volume, as well as random variation. The Empirical Bayes technique, traditional approaches including the Poisson or Negative Binomial Distribution and Category analysis are rated as Model-based methods, considered the best from a theoretical point of view. They declared the weakness of these model-based methods, as they require comprehensive and connected crash, road and traffic data. When such data is not available they suggested using non-model based methods of identification. The best non-model based black spot identification methods are ranked as crash frequency-rate, crash frequency-rate, crash frequency and crash number, respectively in this report.
Many of the studies focusing on a country‟s safety program are not concerned
with hotspot detection methods, but are interested in structural action with regard to the traffic safety program. With the exception of safety programs, there is fairly extensive literature focused on hotspot identification methods.
MONTELLA, 2010).Local spatial autocorrelation methods and density analysis have frequently been used in recent years because of the ease of these methods and powerful visualization (FLAHAUT et al., 2003; ERDOGAN et al., 2008;ERDOĞAN, 2009). As a result, a number of comparison studies have also been devoted to the issue of the relative performance of EB technique in the other hot spot detection techniques (PERSAUD and HAUEr, 1984; ELVIK, 2007). Some studies have also proposed to incorporate accident severity into the risk measures (HAUER et al., 2004; MIRANDA-MORENO, 2006)
Researches on hotspot selection rules are still noticeably scarce. In this research we attempt to develop a model including several hotspot detection methods to determine the hotspots in the highways of Turkey. In this concept, seven different hotspot detection methods are examined to develop the model in the first stage in a pilot study.
3. DATA, METHODS AND METHODOLOGY
3.1 Data
Accident and location information is recorded by the Traffic department of the General Directorate of National Police and General Directorate of Highways in Turkey. We collected fatal or injury traffic accident data on some roads of Turkey in the period of 2005-2012. This data set consists of a total of 254,672 records with 33 columns for 8 years. Columns consist of 33 different items, including the accident location, date of accident, accident id, accident year, month of accident, accident day, day of the week, time, place of accident, non-residential/residential condition, road division, road id, becoming type, km, meters, the number of vehicles, weather, day forecast lighting, working on the road, the road direction, stimulating traffic sign, road surface, death total, injured total, road geometry horizontal, vertical road geometry, road geometry other, X coordinate, and Y coordinate. The Turkish digital road network, which was updated in 2011, and the Annual Average Daily Traffic
data were provided by the General Directorate of Highways. The locations of the
accidents are recorded with both the GPS location and the distance in mile from a reference point. The data collected has some errors, such as typos or inaccurate GPS coordinates due to lack of waiting time for the satellite signal, or errors due to recoding previous coordinates when the device is turned on each time. The distance is used to correct location information for these types of records in error.
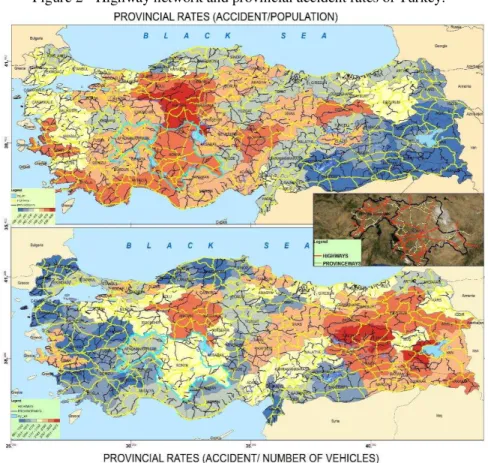
Figure 2 - Highway network and provincial accident rates of Turkey.
3.2 Methods
Crash Frequency: crash frequency is one of the simplest forms of crash data
analysis. It is defined as the number of crashes occurring within a specific period on a highway segment. Highway network divided to 1o (nearly 1 km) segments. Applying this method, segments are ranked in descending order. In order to compare segments of different lengths, the total number of crashes is divided by the segment length within the same time period. These results are compared with a critical value (Fc) (SWEROAD, 2001) that is calculated with the formulae of
Fc=Fa+Kα -0.5/L (1)
Crash rate:The crash rate CR method normalizes the frequency of crashes with exposure data. Crash rate analysis typically uses exposure data in the form of traffic volumes. Traffic volumes are expressed in the form of Annual Average Daily Traffic. The crash rate analysis provides a more effective comparison for similar locations.
In order to compare the segments of different lengths, the total number of crashes is multiplied with 1000000 then divided by the segment length and Annual Average Daily Traffic data in the same time period. These results are compared with a critical value (CRc) (SWEROAD, 2001); the formulae for CR and CRc are given
by
�
=
�
+
�
��
/
� −
0.5/
�
and
�
=
��∗1000000�� � ∗365∗�
(2)
where is the average crash rate for the similar segments, m is AADT for that segment and kαis the significance level
Crash severity: The amount of severity measured for a section can assist officials in determining its safety improvements. In addition, if two similar sections have the same number of accidents, it may be appropriate to select the section with more severe crashes.
In order to compare the segments of different sections, as defined in (SWEROAD, 2001), the accident severity of a section is calculated by
Severity (S)=Number of Fatalities x 9 + Number of Injured Persons x 3 + Number
of Damaged Vehicles x 1. (3)
This value can be divided by a suitable value. One such a value could be the number of accidents Ai. The relative severity value Qi for a segment iis then
(4)
The average severity value is estimated with
(5)
The result values compare with a critical value (Qc) that is calculated with the
formulae
The road section is considered to be a black spot, from the severity point of view, if QĠ >Qc.
Kernel Density Estimation (KDE): KDE is one of the most popular methods
for analyzing the first order properties of a point event distribution and it has been widely used to determine the traffic accident hotspots. Kernel density estimation involves placing a symmetrical surface over each point and then evaluating the distance from the point to a reference bandwidth, based on a kernel function and calculating a magnitude per unit area, then summing the value for all the surfaces for that reference location. Conceptually, a smooth curved surface is fitted over each point. The surface value is highest at the location of the point, and diminishes away from the point, reaches zero at the radius distance from the point (SILVERMAN, 1986).
KDE are usually defined as planar methods; whereas traffic accidents are bound to the network. As some researches (OKABE at al.,2009; XIE and YAN, 2013; LOO and YAO, 2013) pointed out, the planar KDE over a 2-D Euclidean space has its limitations in analyzing traffic accidents.
Moran‟s I and GetisOrd G are the most commonly used global statistics for
measuring spatial autocorrelation by translating a non-spatial correlation to a spatial context (GETIS and ORD, 1992). Local spatial statistics are better suited for practical applications like hot-spot detection. Local spatial autocorrelation methods can help to identify and examine where unusual clusters of events occur, based on a formal assessment of statistical significance (XIE and YOUNG, 2013).
Local Moran’s I: is fully developed by Anselin (1995) as LISA and its formulation is shown in the following equation.
1 2 1 1 1 ) ) ( )( ( ) )( ( i i N j i N j ij j N i N j i ij X X W X X X X W NI (7)
In addition, GĠ* statistics are used to detect local pockets of dependence that may not show up when using global spatial statistics (ORD and GETIS, 1995).
The Gİ* statistic: is often used to identify whether high values (hot spots) or
low values (cold spots) exist, based on the distance. A high value GĠ* statistic indicates a spatial cluster of high values, while a low value GĠ* statistic indicates a spatial cluster of low values around the given area. The formulation is shown in the following equation.
i j j i i j j i ij X X X X w d G ) ( ) ( )For both Moran‟s I and GĠ* statistics, the statistical significance, as a measure of confidence that accident patterns are not simply due to chance, can be calculated through a number of formulae that have been derived by either the normal approximation or by randomization experiments. The null hypothesis used to examine the significance of methods is that the location of a variable attached to certain areas has no importance, and only the frequency of the variable values has statistical significance (ANSELIN, 1995; GETIS and ORD, 1992).
3.3 Methodology
When the methodology of hotspot detection methods are examined:
In the study, the critical crash number is used as 5 for all years in the crash frequency method. Repetitiveness of the locations within the study period to detect hotspots is shown in Figure 3.
Secondly, the critical crash rate is used as 4 for all years in the crash rate method. Repetitiveness of the locations is shown in Figure 4, where we define the repetitiveness of a location as the number of years observing a crash at the location.
Figure 4 - Hotspots detected with crash rate method and repetitiveness of detected hotspots in the period of 2005-2012.
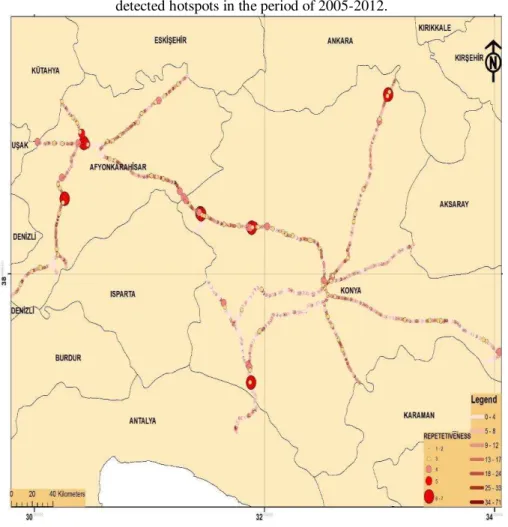
Thirdly, the critical crash severity is used as 10 for all years in the study. Repetitiveness of the locations during the period of study to detect the hotspot is shown in Figure 5.
Spatial Analysis on a Network (SANET), developed by a group of researchers at the University of Tokyo (OKABE et al., 2009).
Figure 5 - Hotspots detected with crash severity method and repetitiveness of detected hotspots in the period of 2005-2012.
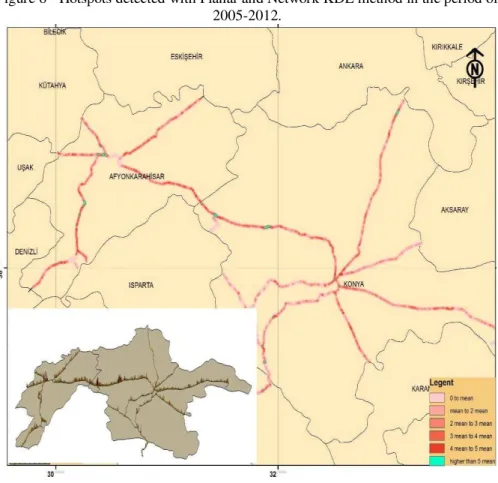
In the study, accidental magnitude values were calculated per 50mx50m areas with a 700 m bandwidth for every year based on quadratic kernel function with Arc GIS and SANET module. Average values for the 2005-2012 period were calculated
with the raster calculator tool in the Arc GIS Spatial Analyst extension. To show the
based on both planar and network kernel density estimation surfaces for the pilot area.
Figure 6 - Hotspots detected with Planar and Network KDE method in the period of 2005-2012.
LISA (Local Indicator of Spatial Association) was used as a local indicator of spatial association, which highlights those clusters of accident locations with similar values. Local analyses based on the LISA statistics are visualized in the form of significance and cluster maps. Four other situations are identifiable from the LISA data: first, a cluster of locations with high-high numbers with excessive accident numbers; second, a cluster of locations with high-low numbers; third, a cluster of locations with low-high numbers; and fourth, a cluster of locations with low-low numbers; Figure 7.
Figure 7 - Hotspots detected with Moran‟s I method and repetitiveness of detected hotspots in the period of 2005-2012.
Figure 8 - Hotspots detected with Getis-Ord G method and repetitiveness of detected hotspots in the period of 2005-2012.
4. RESULTS
Hotspots can have two different dimensions as temporal and spatial dimensions. In this paper, the spatial dimension of hotspots is examined by using different hotspot detection methods and a detail analysis of the temporal dimension is left as a future study. At this time, only the temporal distribution of the accidents is summarized in Figure 9.
Figure 9 - The number of accidents according to the occurrence time (Hourly, daily and monthly distributions of the accidents).
The Gi statistic is very sensitive to the point cluster patterns and this situation sometimes conflicts with the traffic hotspot concept. Gi statistics determine a segment as a hotspot when it is clustered with segments having a high number of accidents. In such a case, Gi statistics show large areas covered in clusters and cannot provide a clear hotspot boundary. This situation usually occurs in the junction locations and give rise to misunderstanding in terms of traffic safety. On
the contrary, Moran‟s I is more powerful for such cases occurring in junction areas.
However, although Moran‟s I is more sensitive to unusual jumps in the number of accidents, it is very deceptive in the areal clusters. The first situation of Moran‟s I is
very important for determining the hotspots arising from the road geometry in terms
of traffic safety. Both Gi and Moran‟s I statistics can give different results,
depending on the spatial weight matrix and the scale of the study area. When only the fixed distance band method is used in the generation of spatial weight matrices, the significance of Gi values can be deceptive for areas with a sparse location. A combination of k nearest neighbor and fixed distance band methods must be used together in the generation of weight matrices. Kernel density analysis is very sensitive for visual detection and has a tendency towards the particular type of locations. It is not very sensitive to the areal cluster pattern and there is not a statistical significance for the reliability. Another challenge for identifying hotspots related to traffic accidents is the network restriction. In this study, both network and planar kernel density analysis was used. Planar KDE has a density at any location within the study area, while the network KDE has a density only its network (Kuo et al., 2011). The network and the planar KDE gave almost the same results. In cases where the conjunction areas are arising, the planar KDE is affected from the neighbor routes whilethe network KDE is poor in visualization of areal clusters and in the interaction of regional distribution.
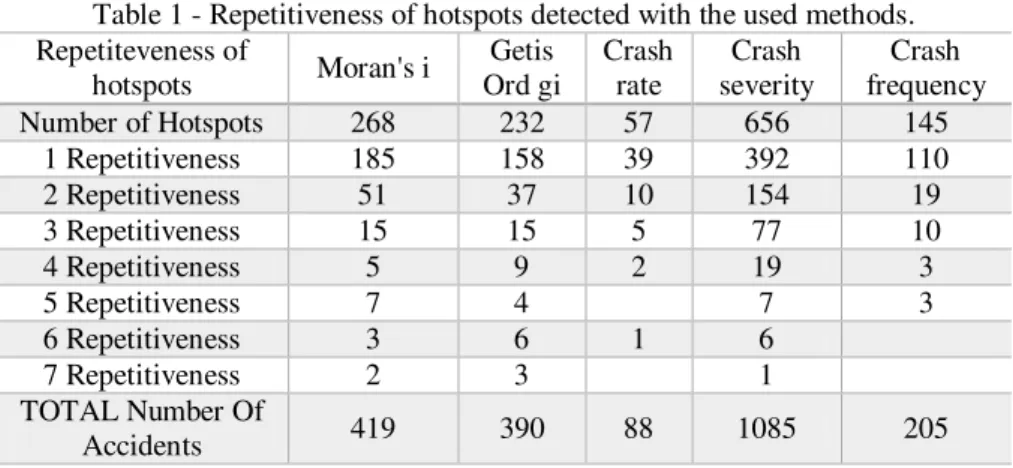
Table 1 - Repetitiveness of hotspots detected with the used methods. Repetiteveness of
hotspots Moran's i
Getis Ord gi Crash rate Crash severity Crash frequency
Number of Hotspots 268 232 57 656 145
1 Repetitiveness 185 158 39 392 110
2 Repetitiveness 51 37 10 154 19
3 Repetitiveness 15 15 5 77 10
4 Repetitiveness 5 9 2 19 3
5 Repetitiveness 7 4 7 3
6 Repetitiveness 3 6 1 6
7 Repetitiveness 2 3 1
TOTAL Number Of
5. CONCLUSION
In conclusion, many studies in the literature have shown that using different hotspot detection methods leads to different results. Very few studies have attempted to combine the different hotspot detection methods in a study area. Results showed that using planar KDE with Gi in the junction locations and using
planar KDE with Moran‟s I in the straight road locations could identify hotspots
more accurately. This study is the first part of a project that attempts to develop a hotspot detection model for Turkey. In the first stage we employed seven different hotspot detection methods and studied advantages and disadvantages of the methods in the pilot area. Future work will contain the results of negative binomial, Poisson regression and empirical Bayesian methods, in terms of the usage of these methods in traffic safety and a suggestion for incorporation of these methods as a model.
ACKNOWLEDGEMENTS:
This work was supported by Th e Sci en tific an d Tech n ological Resear ch Coun cil of Tur key Program 1001 (113Y417)
REFERENCES
ANSELIN, L., 1995. Local indicators of spatial association-LISA. Geographical Analysis 27 (2), 93–116.
CHAINEY, S., REID, S., STUART, N., 2002. When is a hotspot a hotspot? A procedure for creating statistically robust hotspot maps of crime. Taylor and Francis, London, England, pp.21-36.
CHENG, W., WASHINGTON, S., 2005. Experimental evaluation of hotspot identification methods. Accident Analysis and Prevention 37, 870-881.
ECK, J., CHAINEY, S., CAMERON, J., WILSON, R., 2005. Mapping crime: Understanding hotspots (Special Report). National Institute of Justice, Washington, D.C.
ELVIK, R., 2007. State-of-the-art approaches to road accident black spot management and safety analysis of road networks. Institute of Transport
Economics, Oslo, Norway.
ELVIK, R., 2008. A survey of operational definitions of hazardous road locations in some European countries. Accident Analysis and Prevention 40(6), 1830-1835. ERDOGAN, S., YILMAZ, I., BAYBURA, T., GULLU, M., 2008. Geographical information systems aided traffic accident analysis system case study: city of Afyonkarahisar. Accident Analysis and Prevention 40 (1), 174-181.
ERDOGAN, S., 2009. Explorative spatial analysis of traffic accident statistics and road mortality among the provinces of Turkey. Journal of Safety Research 40(5), 341-355.
ETCS (European Transport Safety Council), 2013. http://www.etsc.eu/ home.php FLAHAUT, B., MOUCHART, M., MARTIN, E.S., THOMAS, I., 2003. The local
GETIS, A., ORD, J. K., 1992. The analysis of spatial association by use of distance statistics. Geographical Analysis 24(3), 189-206.
HAUER, E., 1992. Empirical Bayes approach to the estimation of unsafety: the multivariate regression approach. Accident Analysis and Prevention 24, 456– 478.
HAUER, E., 1997. Observational before-after studies in road safety. Pergamon, Tarrytown, NY.
HAUER, E., 2001. Over dispersion in modeling accidents on road sections and in empirical bayes estimation. Accident Analysis and Prevention 33(6), 799-808. HAUER, E., Council, F. M., and MOHAMMEDSHAH, Y., "Safety Models for
Urban Four-Lane Undivided Road Segments."Transportation research record. No. 1897 (2004), p. 96-105
KUO, P., ZENG, X., LORD, D., 2011. Guidelines for choosing hot-spot analysis tools based on data characteristics, network restrictions, and time distributions.
In Proceedings of the 91 Annual Meeting of the Transportation Research
Board, January, pp.22-26.
LOO, B. P., YAO, S., 2013. The identification of traffic crash hot zones under the link-attribute and event-based approaches in a network-constrained environment. Computers, Environment and Urban Systems 41, 249-261. LORD, D., MANNERING, F.L., 2010. The statistical analysis of crash-frequency
data: a review and assessment of methodological alternatives. Transportation Research Part A 44(5), 291–305.
MEULENERS, L., FRASER, M., 2008. Review of the Wa state black spot program: a literature review of Australian and international black spot programs. Centre For Population Health Research, School of Public Health, Curtin University of Technology, Perth.
MEULENERS, L.B., HENDRIE, D., LEE, A.H., LEGGE, M., 2008.Effectiveness of the black spot programs in Western Australia. Accident Analysis and
Prevention 40, 1211-1216.
MIAOU, S. P., SONG, J. J., 2005. Bayesian ranking of sites for engineering safety improvement: decision parameter, treatability concept, statistical criterion and spatial dependence. Accident Analysis and Prevention (37), 699–720.
MIRANDA-MORENO, L.F., 2006. Statistical models and methods for the identification of hazardous locations for safety improvements. Ph.D. Thesis, Department of Civil Engineering, University of Waterloo.
MIRANDA-MORENO, L.F., LABBE, A., FU, L., 2007. Bayesian multiple testing procedures for hotspot identification. Accident Analysis and Prevention 39(6), 1192-1201.
MONTELLA, A., 2010. A comparative analysis of hotspot identification methods.
Accident Analysis and Prevention 42(2), 571-581.
ORD, J. K., GETIS, A., 1995. Local spatial autocorrelation statistics: distributional issues and an application. Geographical Analysis 27(4), 286-306.
PERSAUD, R.N., HAUER, E., 1984. Comparison of two methods for debiasing before-and-after accident studies. Transportation Research Record 975, 43– 49.
PERSAUD, B., 2001. Statistical methods in highway safety analysis. NCHRP Synthesis 295, Transportation Research Board, Washington, D.C.
SĠLVERMAN, B. W., 1986. DensityEstimationforStatisticsand Data Analysis. ChapmanandHall, New York, USA, P. 175.
SORENSEN, M., ELVIK, R., 2008. Black spot management and safety analysis of
road networks. Best Practice Guidelines and Implementation Steps, 6th
Framework Programme Ripcord Iserest Deliverable.
SWEROAD, 2001. „Ulusal Trafik Güvenliği Programı‟, Türkiye Cumhuriyeti
Karayolu Ġyileştirme ve Trafik Güvenliği (KĠTGĠ), Trafik Güvenliği Projesi,
Ankara. In Turkish.
TARKO, A.P., KANODIA, M., 2004. Hazard elimination program. Manual on Improving Safety of Indiana Road Intersections and Sections. Report
FHWA/IN/JTRP-2003/19, West Lafayette, Indiana.
TNP (Turkish National Police), 2013. http://www.trafik.gov.tr/ Sayfalar/ Istatistikler/Genel-Kaza.aspx
WHO, 2013. Global Status Report on Road Safety 2013. Supporting a Decade of Action.
XIE, Z., YAN, J., 2013. Detecting traffic accident clusters with network kernel density estimation and local spatial statistics: an integrated approach. Journal
of Transport Geography 31, 64-71.