Research Article
Comparative Analysis of Performance Measures for
Network Screening: A Case Study of Brazilian Urban Areas
Vanessa Jamille Mesquita Xavier and Flávio José Craveiro Cunto
Department of Transportation Engineering, Universidade Federal do Cear´a, Campus do PICI, s/n, Bloco 703, Fortaleza, CE, Brazil
Correspondence should be addressed to Vanessa Jamille Mesquita Xavier; [email protected] Received 13 February 2017; Accepted 4 June 2017; Published 9 July 2017
Academic Editor: Richard S. Tay
Copyright © 2017 Vanessa Jamille Mesquita Xavier and Fl´avio Jos´e Craveiro Cunto. This is an open access article distributed under the Creative Commons Attribution License, which permits unrestricted use, distribution, and reproduction in any medium, provided the original work is properly cited.
The overall effectiveness of the roadway safety management process relies on a robust method for identifying and ranking sites with major potential for safety improvements. In Brazil, guidelines for hotspot identification are usually based only on crash frequency and Crash Rate as safety performance measures. This study presents a comparative analysis of safety performance measures, considering its limitations of applicability in a sample of signalized intersections from Fortaleza city, Brazil. The performance of each measure to rank the sample intersection was obtained through the rank difference between each safety performance measure and the Excess Expected Average Crash Frequency with EB Adjustment (EEB). In addition, it has taken a temporal analysis based on the consistency of safety performance measures during subsequent time periods. The results have suggested a reasonable matching between the most comprehensive safety performance measure (EEB) and very simple safety performance measures such as crash frequency and Crash Rate. It is recommended to investigate the consistency of the results for longer observation period as well as for a different jurisdiction in Brazil.
1. Introduction
Every year the lives of almost 1.24 million people are abbre-viated due to traffic accidents. These events cause substantial economic losses for the victims and their families and to the nations as a whole [1]. In Brazil, in the year 2010, approx-imately 41 thousand fatal victims in road crashes were recorded [2].
Establishing effective safety improvement programs fre-quently relies on a good network screening process. The complete sequence of activities from identifying sites with promise, to investigating contributing factors, to select-ing countermeasures, to developselect-ing and comparselect-ing safety projects, encompasses what is known as the roadway safety management process [3].
Selecting a location with potential for the reduction of accidents is the first step of the roadway safety management process (RSMP). The errors in the identification of critical points may produce false negatives (“genuinely” dangerous sites designated as “safe”) and false positives (relatively safe locations that are identified as hazardous). These failures
result in the inefficient use of resources for safety improve-ments and may reduce the global effectiveness of the RSMP. Therefore, the correct identification of critical points is essen-tial to the successful implementation of any plan for road safety [4–6].
Several methods of network screening are presented in the literature. These methods are usually based on safety per-formance measures ranging from observed crash frequency to the most elaborated ones obtained from statistical mod-eling or composite indexes [3, 4, 7–9]. These methods differ among themselves regarding the data requirements and mod-eling skills needed for their application and the limitations in considering the rare random nature of crashes.
The main methods of network screening applied to the Brazilian scenario present in some guidelines have not incor-porated in a proper manner the stochastic nature of crashes [10, 11]. It is recognized that data limitations are one of the highest impediments for applying advanced network screen-ing safety performance measures, especially in developscreen-ing countries jurisdictions. Furthermore, exploring the differ-ences in the network screening process using different safety
performance measures applied to a developing country juris-diction will definitely contribute to increasing the scope of both the RSMP methodology as well as to improving our knowledge regarding the usefulness of main safety perfor-mance measures.
The main objective of this paper is to provide a com-parative analysis between the safety performance measures proposed by HSM applied to urban signalized intersections taking into account the suitability of these safety performance measures to the Brazilian urban road environment as well as the efforts for the acquisition of information and modeling required to implement them. The main findings of this work will serve to support improvements on accident data systems as well as investments to improve practitioners overall mod-eling skills.
2. The Network Screening Process
The global effectiveness of the RSMP relies on a robust method for identifying and ranking sites with major potential for safety improvements. The Highway Safety Manual (HSM) provides decision makers and engineers with the information and tools to improve roadway safety performance. Network screening is the first activity performed in the cyclical roadway safety management process proposed by HSM. This activity presents five major steps: (i) establishing focus, (ii) identifying the network and establish reference populations, (iii) selecting safety performance measures (SPM), (iv) select-ing screenselect-ing method, and (v) screenselect-ing and evaluatselect-ing results. The Highway Safety Manual (HSM) proposes 13 SPM for hotspot identification which requires different levels of completeness and accuracy of accident data systems as well as different modeling skills from safety staff. Therefore, it is common that jurisdictions in the infant stage of the RSMP would apply less informative SPM.
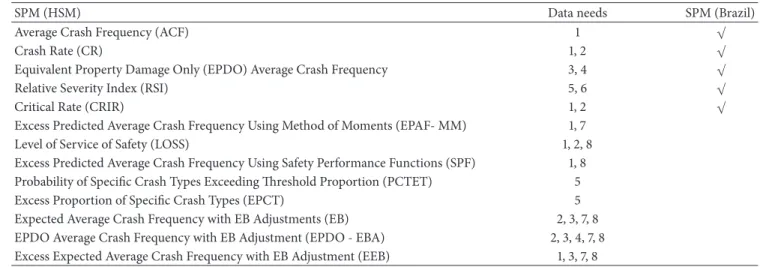
In Brazil, methods for identifying hotspots are presented in two road safety manuals from national agencies [10, 11] consisting basically of the following steps: (i) data collection, (ii) application of an SPM, and (iii) list with critical sites. Table 1 shows the SPM proposed by HSM, the data needed for its application, and which ones are included in the Brazilian manuals. Among the necessary information are crash data by location and date (1), traffic volume (2), crash data by severity and by location (3), crash costs by crash severity (4), crash data by type and location (5), crash costs by crash type (6), geometric and operational characteristics of the road (7), and calibrated safety performance functions (SPFs) and overdispersion parameters (8).
To implement the methods proposed by the HSM, a major challenge for state and local agencies is the collection of nec-essary roadway information along thousands of miles of high-ways. Collecting roadway asset inventory data often incurs significant but unknown costs [12]. Applying more complex SPM can yield better estimates to the expected crash fre-quency; however, more data and more specialized transporta-tion professionals are needed for the applicatransporta-tion. For exam-ple, in the estimation of an SPM that requires SPF, a consid-erably large amount of information regarding road crashes, roadway characteristics, and traffic conditions are needed,
and this certainly brings a new layer of difficulty for devel-oping countries.
In addition to the methodology proposed by the HSM, there are methods which propose another methodology, such as a probabilistic method [13] and composite safety perfor-mance index [5].
The probabilistic method steps are as follows: (i) estab-lishing reference populations, (ii) generating a binary regres-sion model, and (iii) elaboration of a critical locations list. For the generation of a binary regression model, Couto and Ferreira [13] proposed the simulation of a database based on a crash sample from the city of Porto, Portugal. The construc-tion of simulated database enables a larger sample compared to the real database, that is, a more significant sample for cali-bration and validation of binary regression model. The binary regression model has as the response variable 1 to critical locations and 0 to safe locations. It is important to notice that the random generation of the so-called “independent vari-ables” can yield combinations of geometric and operational attributes which are not representative of any intersection on the network.
Coll et al. [5] propose a method to combine different SPM into a single index called composite safety performance index (CSPI). The steps for index construction are as follows: (i) the selection of the road safety indicators to be aggregated, (ii) the pairwise comparisons of indicators, and (iii) the development of the CSPI. A comparison made by Coll et al. suggests that the new aggregation method is very similar to the results of the qualifying lists, in temporal terms, when compared to a more basic technique of aggregation. The study also pointed out that choosing adequate indicators as well as their respec-tive weights in order to produce the composite index is still open to discussion.
3. Safety Performance Measures
Comparison Methods
Different efforts aiming at comparing the use of different SPM is readily available. According to Cheng and Washington [9], the comparison criteria based on false positives and false negatives are not sufficient to explore variations in the clas-sification of critical sites. The tests developed by Cheng and Washington are based on the premise that road sections are in the same or similar underlying operational states and that their expected safety performance remains virtually unal-tered over the two periods. The tests are site consistency test (T1), the consistency test (T2), the total rank differences test (T3), and the Poisson mean differences test. More details on these tests can be found in the methodology section.
The basic premise of the tests proposed by Cheng and Washington [9] is that a good method is the one that can identify critical locations over subsequent periods of time. In their application crash frequency simple rank was applied to identify critical points and since this SPM is subjected to RTM bias the results could be misleading.
Table 1: HSM and SPM used in Brazilian safety manuals.
SPM (HSM) Data needs SPM (Brazil)
Average Crash Frequency (ACF) 1 √
Crash Rate (CR) 1, 2 √
Equivalent Property Damage Only (EPDO) Average Crash Frequency 3, 4 √
Relative Severity Index (RSI) 5, 6 √
Critical Rate (CRIR) 1, 2 √
Excess Predicted Average Crash Frequency Using Method of Moments (EPAF- MM) 1, 7
Level of Service of Safety (LOSS) 1, 2, 8
Excess Predicted Average Crash Frequency Using Safety Performance Functions (SPF) 1, 8 Probability of Specific Crash Types Exceeding Threshold Proportion (PCTET) 5
Excess Proportion of Specific Crash Types (EPCT) 5
Expected Average Crash Frequency with EB Adjustments (EB) 2, 3, 7, 8
EPDO Average Crash Frequency with EB Adjustment (EPDO - EBA) 2, 3, 4, 7, 8 Excess Expected Average Crash Frequency with EB Adjustment (EEB) 1, 3, 7, 8
measure relatively estimated from the composition of the absolute efficacies of each test proposed by Cheng and Wash-ington [9], being weighted by the maximum and minimum values of the tests.
Ferreira and Martins [6] compared the binary model proposed by Couto and Ferreira [13] with other methods for identification of critical points applying the temporal consistency tests discussed above. For a total sample of inter-sections (without reference population) it was obtained that the binary model has better performance, while, for a sample of intersections with light signals, the EEB method was more efficient.
4. Methodological Procedure
The methodological approach to reach the entire objective can be divided into four stages presented in Figure 1. The implementation and evaluation of the proposed method will be performed through a case study for signalized intersec-tions of Fortaleza city, Brazil.
4.1. Selection of Reference Population. For comparison between the estimated SPM, it is necessary to define a reference population, because sites with very atypical or specific characteristics can have an estimate of the expected frequency of accidents which differs from others solely by its characteristics. The selected years to implement the SPM should be those where road sections are in the same or similar underlying operational states (similar traffic volumes, geometric designs, weather fluctuations, etc.).
The following criteria will be used for the selection of the reference population: traffic light implementation date, availability of information on the vehicular flow, and number and geometric configuration of the intersection (skew angle). Figure 2 shows an example of intersection removed from the sample due to a nonrepresentative configuration.
4.2. Data Collection and Modeling Requirements. The esti-mation of a considerable number of SPM for HSM usually
Comparative analysis of performance measures Selection of reference
population
Data collection and modeling requirements
Estimate of performance measures
Figure 1: Flowchart for comparative analysis of safety performance measures for hotspot identification.
Figure 2: Example atypical intersection removed from the sample.
capable of handling crash overdispersion and the regression to the mean phenomenon is the development of SPF.
The raw accident data from the years 2009, 2010, and 2011 were collected from the municipal accident data system (SIAT-FOR). The SIAT-FOR is a georeferenced database that compiles the traffic accidents such as date, time, location (street name and number/reference), crash type, vehicles involved, and the severity of the accident (without casualties, with injured victims, and with fatalities) as well as informa-tion on victims and gender, age, and type (driver, passenger, pedestrian, cyclist, etc.) [14].
The annual average daily traffic (AADT) was estimated using the monthly average daily traffic (October/2010) pro-vided by the CTAFOR (Traffic Control Center) database whose traffic signal control is done by the SCOOT system (Split Cycle Offset Optimization Technique).
The safety performance functions used for estimating model based SPM was calibrated in the work of Cunto et al. [14] as follows:
𝑌 = 0,00591 ⋅ (AADT0,52) ⋅ 𝑒0,28lanes, (1)
whereYis expected number of accidents in 2009 (signalized intersections); AADT is average annual daily traffic in 2009; and lanes = number of lanes.
It should be noted that the above SPF was calibrated for 2009 data. In this application, it was assumed there was no variation among the calibration coefficients for the SPF. The use of SPF brings a new variable (number of lanes) that was not available in the databases used. The number of lanes for each intersection was obtained by using aerial photographs from Google Earth ©.
4.3. SPM Estimation. The SPM to be investigated in this study were selected based on two criteria: data availability and the possibility of producing comparative ranks. It is also impor-tant to compare SPM that correspond to the same crash type as well as severity level. The present analysis used SPM that estimate values in terms of total accidents and for all types of collision. Another criterion for comparing the ranks is that SPM can rank all sites from the highest to the lowest value.
Among the 13 SPM proposed by HSM seven will be assessed as follows: Average Crash Frequency (ACF), Crash Rate (CR), Equivalent Property Damage Only Average Crash Frequency (EPDO), Level of Service of Safety (LOSS), Excess Predicted Average Crash Frequency Using Safety Perfor-mance Functions (SPFs), Expected Average Crash Frequency with EB Adjustments (EB), and Excess Expected Average Crash Frequency with EB Adjustment (EEB).
4.4. Comparative Analysis of Safety Performance Measures.
The comparative analysis among SPM will be based on two approaches. The first is based on the differences between sites ranking and the second based on the temporal consistency of the ranking. These approaches seek to compare a given SPM (subject SPM) to a reference SPM that has the best capacity to estimate the places with the greatest potential for the reduc-tion of accidents, incorporating in the best way the stochastic nature of crashes. In this exercise, the Excess Expected
Average Crash Frequency with EB Adjustment (EEB) was chosen as the reference SPM.
4.4.1. Comparative Analysis Based on Rank Positions. For this analysis three types of tests were proposed, as follows: the root mean square error (RMSE) between EEB rank and the tested SPM and the difference in the ranking position (DRP) and a Number of Sites Identified as Critical (NSIC).
Initially, subject SPM will be evaluated according to the average difference between its ranking list and the EEB ranks using the root mean square error [15], as follows:
RMSE= √ 1𝑁 𝑁
∑
𝑖=1(𝑥𝑖− 𝑦𝑖)
2, (2)
where RMSE is root means square error;𝑥𝑖is rank position of reference SPM;𝑦𝑖is rank position of other performance measures that will be compared.
The analysis is divided into blocks of 10 positions so that the first position corresponds to the location obtained as more critical by the reference measurement and so on. The smaller the RMSE, the better the subject SPM performance as compared to the reference SPM.
Next, the difference in the ranking position (DRP) of the 30 most critical sites is visually assessed. DRP can be expressed as
DRP= 𝑥𝑖− 𝑦𝑖, (3)
where𝑥𝑖is the rank position which is determined by the sub-ject SPM and𝑦𝑖is the rank position determined by the refer-ence SPM. The DRP analysis will be done by plotting a graph where the performance measures are compared with the EEB. The lower the DRP, the smaller the difference between the positions on the rank of performance measures for a given location.
Finally, the Number of Sites Identified as Critical (NSIC) will be estimated. This evaluation will identify which sites are critical based on the number of performance measures that identify them as critical. The higher the NSIC, the greater the chances of a particular location to be truly critical.
4.4.2. Temporal Consistency Tests. The temporal consistency tests were adapted from a two-period temporal comparison proposed by Montella [4] which unites in a single index three temporal indicators proposed by Cheng and Washington [9]. The first period of time (𝜏1) corresponds to the oldest year of the set of years available for study. The second time period (𝜏2) can be obtained by averaging the years after the year of the first period of time.
For the first test (T1) the classification list of the subject SPM for 𝜏1 is made, identifying the critical sites. For each of these sites, the reference measure for𝜏2is calculated. The result of the first test corresponds to the sum of the values obtained by the reference measure in𝜏2. Applying the test to the available set of performance measures, the best measure will be the one that gets the highest sum.
Table 2: Descriptive statistics of variables.
Variable Mean Standard deviation Minimum Maximum
AADT 36,287 11,877 14,101 64,175
Number of lanes 6.03 1.60 4 12
Number of fatal crashes 0.28 0.63 0 3
Number of injury crashes 7.27 6.26 0 47
Number of PDO crashes 12.88 9.75 1 50
Number of total crashes 20.49 15.20 5 91
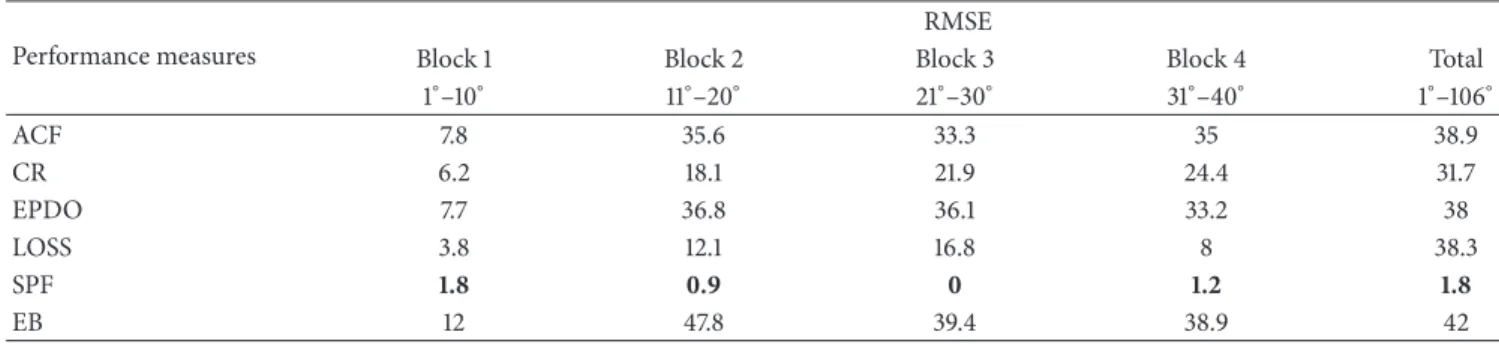
Table 3: Root means square error of performance measures.
Performance measures
RMSE
Block 1 Block 2 Block 3 Block 4 Total
1∘–10∘ 11∘–20∘ 21∘–30∘ 31∘–40∘ 1∘–106∘
ACF 7.8 35.6 33.3 35 38.9
CR 6.2 18.1 21.9 24.4 31.7
EPDO 7.7 36.8 36.1 33.2 38
LOSS 3.8 12.1 16.8 8 38.3
SPF 1.8 0.9 0 1.2 1.8
EB 12 47.8 39.4 38.9 42
the reference SPM. Then, the classification list of the subject SPM under analysis is calculated in𝜏1. The result of this test is the number of “truly critical sites” identified in𝜏1by the measure under study. The best measure of performance is the one that gets the highest value.
For the third test (T3), the classificatory list in𝜏1is calcu-lated at first for the measure to be evaluated. Next, the list is calculated in𝜏2for the reference SPM. The value of this test corresponds to the sum of the difference in module in the positions of the classificatory lists obtained by the measure to be evaluated and the reference measure. The best perfor-mance measure is the one that gets the lowest value. The formulation of the index proposed by Montella [4] is as follows:
TST𝑗= 100
3 × [(
T1𝑗
max𝑗T1) + ( T2𝑗 max𝑗T2)
+ (1 −T3𝑗−min𝑗T3
max𝑗T3 )] .
(4)
In that, 𝑗 corresponds to the performance measure to be evaluated and max and min correspond to the highest and lowest value obtained in a given test, respectively.
5. Results and Discussions
Table 2 presents a descriptive analysis of the variables used to estimate the performance measures.
The proposed method was applied to a sample of signal-ized intersections using the year of 2009, 2010, and 2011. The reference population was defined as four-leg signalized inter-section with traffic light implementation before July 2008 and orthogonal approaches (skew angle between 75 and 90 degrees) more than 50-meter spacing between intersections.
Applying the above criteria for defining the reference popu-lation a total of 106 signalized intersections were selected.
5.1. Comparative Analysis Based on the Rank Positions.
Table 3 presents the rank RMSE for the six performance measures assuming the EEB as the benchmark. The rank RMSE was estimated for blocks of 10 intersections each until intersection ranked 40th.
It can be noticed that the lowest RMSE of the top ten (Block 1), as well as the other blocks, is obtained by the SPF estimates. The second lowest RMSE in most blocks is the LOSS, being also the third lowest one in the first block by a small difference in relation to the CR. It is worth noticing that, despite its formulation, the EB performance measure pre-sented the highest RMSEs in all blocks. This is probably due to the influence of traffic exposure when comparing different sites.
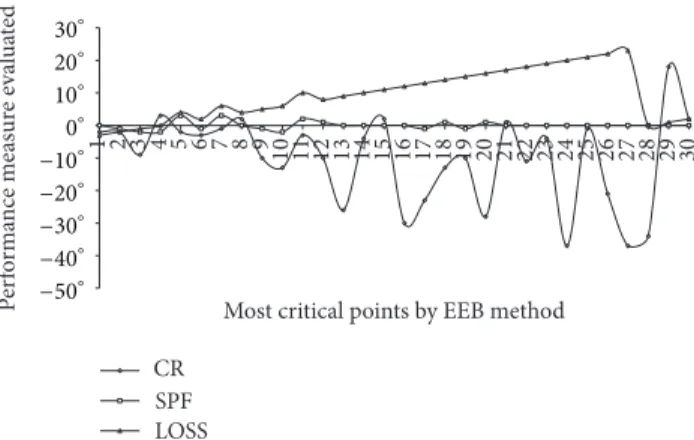
The second test is also based on differences between the positions of ranks (DRP) which is presented in Figures 3 and 4. On the𝑦-axis is the difference between the ranks and in
𝑥-axis are the thirty locations ranked as more critical by EEB, for example, the number 1 of thex-axis corresponds to the first most critical site according to the EEB, and the value 2 is the second most critical location in the EEB classification list. It can be observed from Figures 3 and 4 that there is a general trend of rank underestimation for the vast majority of performance measures when compared to the EEB; that is, there is a clear trend of producing false negative. This is espe-cially significant for EB, EPDO, and ACF. Another important finding, at least for this sample, is that the relative position (to EEB) tends to be more relevant after the 10th ranked intersection.
1 2 3 4 5 6 7 8 9 10 11 12 13 14 15 16 17 18 19 20 21 22 23 24 25 26 27 28 29 30
Most critical points by EEB method
CR SPF LOSS P er fo rma nce me asur e e val ua te d 30∘ 20∘ 10∘ 0∘ −10∘ −20∘ −30∘ −40∘ −50∘
Figure 3: Difference between EEB and CR and LOSS and SPF ranks.
1 2 3 4 5 6 7 8 9 10 11 12 13 14 15 16 17 18 19 20 21 22 23 24 25 26 27 28 29 30
Most critical points by EEB method
ACF EB EPDO 30∘ 20∘ 10∘ 0∘ −10∘ −20∘ −30∘ −40∘ −50∘ −60∘ −70∘ −80∘ P er fo rma nce me asur e e val ua te d
Figure 4: Difference between EEB and ACF and EB and EPDO ranks.
together the observed crashes and those predicted by SPF in such a way that the predictive variables included in the SPF such as AADT and number of lanes usually prioritize sites with higher exposure in exchange for sites with relatively lower traffic flow. In Figure 3, the valleys for sites 5 and 7, for example, have the top positions for EEB because despite their characteristics estimating a low frequency of accidents in the year under analysis, its frequency by EB was relatively high, and thus the potential for improvement is greater than the others.
It is noticed that the curves ACF, EPDO, and EB go together to the peaks and valleys, and this occurs because high values of ACF resulted in high values of EPDO and EB. The EPDO uses weighting factors for severity type for the estimated frequency of accidents; the more the accidents, the greater the values obtained by EPDO. Excessive values of a specific crash type could cause the EPDO to be different than the ACF in terms of rank, and this occurred of the local 12 and 17. As for the EB to the sample in question, most of the places with high frequency of observed accidents also presented a high number of lanes and volumes, and thus greater ACF values resulted in higher EB values.
The CR has little variation in top positions, with a more marked variation only in the 13th position. The CR could prioritize sites with low volume, as can be seen at position
19. For the Level of Service of Safety (LOSS), the degree of deviation from the predicted average crash frequency is divided into four classes. Thus various locations will belong to the same position in rank, which can be perceived in the local 12 to 26.
The SPF had the best performance in relation to EEB because both of these measures calculate the excess. The difference between the observed and predicted crash frequen-cies is the excess predicted crash frequency using SPFs.
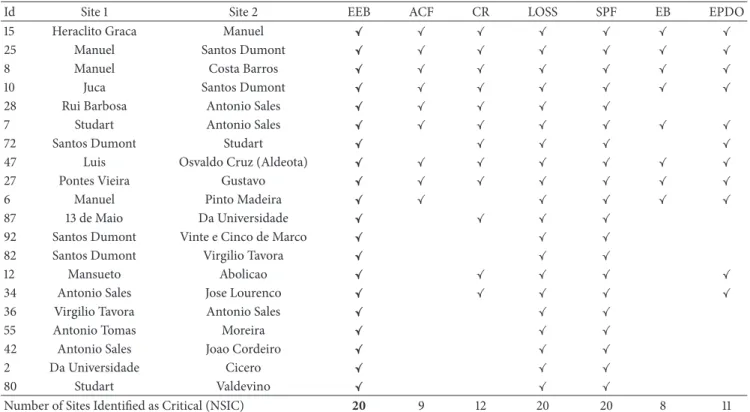
The third test for rank comparison is presented in Table 4. This table shows the first 20 places ranked by EEB and checks marks for sites that would have been included in the list of the 20 most dangerous sites using other measures. The results indicated that, regardless of rank differences, the list of the 20 most dangerous sites would match for EB and EPDO. For CR 16 out of 20 sites would match. The worst performance was observed for EB with only 10 out of 20 sites.
5.2. Temporal Consistency Tests. The temporal consistency analysis was performed for three-time combinations as fol-lows: (1) 2009 and 2010, (2) 2010 and 2011, and (3) 2009 and 2011. The truly critical sites were defined as the 30 locations in the second period which have the highest expected frequency of accidents defined by the EB. The total score test was estimated for 30 critical locations according to the three individual tests. The applied reference performance indicator was the Excess Expected Average Crash Frequency with EB Adjustment (EEB).
Due to its formulation, the EEB performance indicator can result in negative values for specific sites. This means that the expected crash frequency for the site is lower than the expected frequency for sites with similar traits; however, this does not preclude the site from being critical. In order to simplify the interpretation of the results the lowest EEB estimated value was added to the sample to avoid negative numbers. It is worth noticing that this linear transformation does not alter the ranking.
After the calculation of the three tests, value of the total score tests (TST) was obtained for the three-period analysis (Table 5). As discussed previously, the TST has the advantage of being a single indicator, facilitating the analysis, so that the best performance in three tests (T1, T2, and T3) will reach the 100 score. According to the TST, SPF and EEB performance measures have had the best results which were expected, as these measures deal with the crash frequency excess in its formulation. LOSS performance measure also provided high levels of TST; however, it is noteworthy that, as in the previous analysis, time consistency tests are also based on the difference between the ranking lists and LOSS is not a continuous indicator (four levels) which makes comparisons not straightforward.
Table 4: Critical sites for EEB performance measure.
Id Site 1 Site 2 EEB ACF CR LOSS SPF EB EPDO
15 Heraclito Graca Manuel ✓ ✓ ✓ ✓ ✓ ✓ ✓
25 Manuel Santos Dumont ✓ ✓ ✓ ✓ ✓ ✓ ✓
8 Manuel Costa Barros ✓ ✓ ✓ ✓ ✓ ✓ ✓
10 Juca Santos Dumont ✓ ✓ ✓ ✓ ✓ ✓ ✓
28 Rui Barbosa Antonio Sales ✓ ✓ ✓ ✓ ✓
7 Studart Antonio Sales ✓ ✓ ✓ ✓ ✓ ✓ ✓
72 Santos Dumont Studart ✓ ✓ ✓ ✓ ✓
47 Luis Osvaldo Cruz (Aldeota) ✓ ✓ ✓ ✓ ✓ ✓ ✓
27 Pontes Vieira Gustavo ✓ ✓ ✓ ✓ ✓ ✓ ✓
6 Manuel Pinto Madeira ✓ ✓ ✓ ✓ ✓ ✓
87 13 de Maio Da Universidade ✓ ✓ ✓ ✓
92 Santos Dumont Vinte e Cinco de Marco ✓ ✓ ✓
82 Santos Dumont Virgilio Tavora ✓ ✓ ✓
12 Mansueto Abolicao ✓ ✓ ✓ ✓ ✓
34 Antonio Sales Jose Lourenco ✓ ✓ ✓ ✓ ✓
36 Virgilio Tavora Antonio Sales ✓ ✓ ✓
55 Antonio Tomas Moreira ✓ ✓ ✓
42 Antonio Sales Joao Cordeiro ✓ ✓ ✓
2 Da Universidade Cicero ✓ ✓ ✓
80 Studart Valdevino ✓ ✓ ✓
Number of Sites Identified as Critical (NSIC) 20 9 12 20 20 8 11
Table 5: Total score tests results for three-time periods.
Performance measures Period 1 (2009) Period 1 (2010) Period 1 (2009)
Period 2 (2010) Period 2 (2011) Period 2 (2011)
ACF 65 69 75
CR 74 85 79
EPDO 66 70 74
LOSS 100 90 93
SPF 100 100 100
EB 52 62 66
EEB 100 97 100
The performance reasons obtained by EPDO and the EB are similar to the comparative analysis based on the qualifying list.
6. Concluding Remarks
The decision on which method to use for the identification of sites with potential for safety improvements is a major factor in terms of effectiveness of road safety management process. The Highway Safety Manual provides a set of 13 performance measures that can be applied either isolated or in conjunction to the network screening process. HSM SPM require different data acquisition and modeling efforts from the safety analyst which may not be available especially in developing countries jurisdictions.
This paper focused on providing a quantitative compari-son of site ranking among major SPM suggested by the HSM when applied to a set of signalized intersections from an
urban area in Brazil. The reference population (106 signalized four-leg intersections) was selected according to crash data availability as well as traffic flow and geometric attributes pro-vided by the municipal department of traffic (AMC). In order to evaluate the performance measures proposed by HSM in the Brazilian context, seven SPM were compared using the EEB as a benchmark. Sites were ranked according to each of the SPM and then compared to the rank provided by the EEB method using the root mean square error. The individual stability of each SPM as compared to the EEB was graphically evaluated using a comparative rank plot showing the rank dif-ference between EEB and the specific SPM for the redif-ference population. A final test was made to check the consistency of the 20 most dangerous intersections according to the EEB throughout the other SPM.
many sites remain in the same position in rank because there are only four Levels of Service of Safety, which may impair the prioritization of critical locations. The CR performed well throughout the analysis proposed by the methodological process, but, for the Brazilian reality, the application of this SPM may prove to be more difficult because it requires traffic flow data.
The measures that had the worst performance were the EB and EPDO. The EB despite being a robust performance measure showed a poor performance when compared with the EEB. The EPDO may overemphasize locations with a low frequency of severe crashes depending on weighting factors used.
Furthermore, for the sample used in this exercise, the results obtained from the three evaluations suggested that simple measures such as ACF and CR were not outperformed by more comprehensive measures such as EB and EPDO. This finding should be seen with caution since it is well known in the literature; the ACF and CR do not consider appropriately the rare and stochastic nature of crashes. It just appears that aspects such as the RTM bias were not apparent in the data due to the sampling procedure (none of these sites were selected to have traffic signal or other interventions imple-mented due to a high crash record from a previous year). In order to enhance the vision about SPM and the network screening process applied to the Brazilian road environment, it is recommended to apply the proposed methodology to other jurisdictions, with applicable adjustments and with a longer observation period.
Conflicts of Interest
The authors declare that there are no conflicts of interest regarding the publication of this paper.
Acknowledgments
The authors would like to acknowledge the Brazilian National Council for Scientific and Technological Development (CNPq) and the Cear´a State Foundation for Scientific and Technological Development (FUNCAP) for funding this research.
References
[1] World Health Organization, “Global Status Report on Road Safety 2013, 2016,” http://www.who.int/iris/bitstream/10665/ 78256/1/9789241564564_eng.pdf.
[2] J. J. Waiselfisz, “Os Novos Padr˜oes da Violˆencia Homicida no Brasil. Caderno Complementar 2: Acidentes de Trˆansito Mapa da Violˆencia 2012, 2016,” http://www.mapadaviolencia.org.br/ pdf2012/mapa2012_transito.pdf.
[3] American Association of State and Highway Transportation Officials, American Association of State and Highway Trans-portation Officials, Washington, DC, USA, 2010.
[4] A. Montella, “A comparative analysis of hotspot identification methods,”Accident Analysis and Prevention, vol. 42, no. 2, pp. 571–581, 2010.
[5] B. Coll, S. Moutari, and A. H. Marshall, “Hotspots identification and ranking for road safety improvement: An alternative approach,”Accident Analysis and Prevention, vol. 59, pp. 604– 617, 2013.
[6] S. Ferreira and J. Martins, “M´etodos de identificac¸˜ao de zonas de acumulac¸˜ao de acidentes: Revis˜ao e aplicac¸˜ao a um caso de estudo,”Transportes, vol. 22, no. 3, p. 103, 2014.
[7] E. Hauer, D. W. Harwood, F. M. Council, and M. S. Griffith, “Estimating safety by the empirical bayes method: a tutorial,” Transportation Research Record, no. 1784, pp. 126–131, 2002. [8] L. F. Miranda-Moreno,Statistical models and methods for
iden-tifying hazardous locations for safety improvements , PhD Thesis [Ph.D. thesis], University of Waterloo, Ontario, Canada, 2006. [9] W. Cheng and S. Washington, “New criteria for evaluating
methods of identifying hot spots,” Transportation Research Record, vol. 2083, pp. 76–85, 2008.
[10] MT, Procedimentos para o Tratamento de Locais Cr´ıticos de Acidentes de Trˆansito, Minist´erio dos Transportes, Programa PARE, 2002.
[11] DNIT,Elaborac¸˜ao de ac¸˜oes preventivas e corretivas de seguranc¸a rodovi´aria, por meio de identificac¸˜ao e mapeamento dos segmen-tos cr´ıticos da malha vi´aria do DNIT, Departamento Nacional de Infra-Estrutura de Transportes, Universidade Federal de Santa Catarina, Laborat´orio de Transportes e Log´ıstica, 2010. [12] M. Jalayer, H. Zhou, J. Gong, S. Hu, and M. Grinter,A
Compre-hensive Assessment of Highway Inventory Data Collection Meth-ods for Implementing Highway Safety Manual, Transportation Research Board of the National Academie, Washington, DC, USA, 2015.
[13] A. Couto and S. Ferreira, “M´etodo Probabil´ıstico para Iden-tificac¸˜ao de Zonas de Acumulac¸˜ao de Acidentes,” inProceedings of the XXVI Congresso de Pesquisa e Ensino em Transportes, vol. 21, pp. 763–774, ANPET, Joinville, Brazil, 2012.
[14] F. J. Cunto, M. M. De Castro Neto, and D. S. Barreira, “Modelos de previs˜ao de acidentes de trˆansito em inter-sec¸˜oes semaforizadas de Fortaleza,”Transportes, vol. 20, no. 2, pp. 47– 64, 2012.
,QWHUQDWLRQDO-RXUQDORI
$HURVSDFH
(QJLQHHULQJ
+LQGDZL3XEOLVKLQJ&RUSRUDWLRQKWWSZZZKLQGDZLFRP 9ROXPH
Robotics
Journal ofHindawi Publishing Corporation
http://www.hindawi.com Volume 2014
Hindawi Publishing Corporation
http://www.hindawi.com Volume 2014 Active and Passive Electronic Components
Control Science and Engineering
Journal of
Hindawi Publishing Corporation
http://www.hindawi.com Volume 2014
Machinery
Hindawi Publishing Corporation
http://www.hindawi.com Volume 2014 Hindawi Publishing Corporation
http://www.hindawi.com
Journal of
(QJLQHHULQJ
Volume 201
Submit your manuscripts at
https://www.hindawi.com
VLSI Design
Hindawi Publishing Corporation
http://www.hindawi.com Volume 201
-Hindawi Publishing Corporation
http://www.hindawi.com Volume 2014 Shock and Vibration Hindawi Publishing Corporation
http://www.hindawi.com Volume 2014
Civil Engineering
Advances inAcoustics and VibrationAdvances in
Hindawi Publishing Corporation
http://www.hindawi.com Volume 2014 Hindawi Publishing Corporation
http://www.hindawi.com Volume 2014
Electrical and Computer Engineering
Journal of
Advances in OptoElectronics
Hindawi Publishing Corporation
http://www.hindawi.com Volume 2014
The Scientific
World Journal
Hindawi Publishing Corporation
http://www.hindawi.com Volume 2014
Sensors
Journal ofHindawi Publishing Corporation
http://www.hindawi.com Volume 2014
Modelling & Simulation in Engineering
Hindawi Publishing Corporation
http://www.hindawi.com Volume 2014
Hindawi Publishing Corporation
http://www.hindawi.com Volume 2014 Chemical Engineering
International Journal of Antennas and Propagation International Journal of
Hindawi Publishing Corporation
http://www.hindawi.com Volume 2014
Hindawi Publishing Corporation
http://www.hindawi.com Volume 2014
Navigation and Observation International Journal of
Hindawi Publishing Corporation
http://www.hindawi.com Volume 2014