Article
Printed in Brazil - ©2016 Sociedade Brasileira de Química 0103 - 5053 $6.00+0.00
*e-mail: [email protected]
Chemometric Analysis of UV Characteristic Profile and Infrared Fingerprint
Variations of
Coffea arabica
Green Beans under Different Space Management
Treatments
Amélia E. Terrile,a,b Gustavo G. Marcheafave,a Guilherme S. Oliveira,a Miroslava Rakocevic,c Roy E. Brunsd and Ieda S. Scarminio*,a
aLaboratório de Quimiometria em Ciências Naturais, Departamento de Química,
Universidade Estadual de Londrina, CP 6001, 86051-990 Londrina-PR, Brazil
bDepartamento de Química, Universidade Tecnológica Federal do Paraná, Campus Londrina,
Avenida dos Pioneiros 3131, 86036-370 Londrina-PR, Brazil
cEmbrapa Informática Agropecuária, Campus da UNICAMP, Barão Geraldo,
CP 6041, 13083-886 Campinas-SP, Brazil
dInstituto de Química, Universidade Estadual de Campinas, CP 6154,
13083-970 Campinas-SP, Brazil
Ultraviolet characteristic profiles and infrared spectroscopic (FTIR) fingerprints of green bean extracts of Coffea arabica L., cv. IAPAR 59, cultivated in two planting patterns, rectangular and square, and at two different densities, 10,000 and 6,000 plants ha-1, identified as R
10,R6,S10, and S6 were analyzed with principal component and hierarchical cluster analyses. A simplex centroid design for four solvents (ethanol, acetone, dichloromethane, hexane) was used for sample extraction. The largest chlorogenic acid (CGA) contents were found at the lower planting density. The dichloromethane extracts of the S10 treatment showed the highest levels of unsaponifiable lipids (cafestol and kahweol). The R6 treatment showed a slightly higher content of cafestol and kahweol. Cluster analysis of FTIR fingerprints confirmed that the CGA and caffeine levels differentiate the spatial arrangements. The FTIR fingerprints suggest that green beans from S6 and R10 were richer in lipids and the other two treatments had more sugars and proteins.
Keywords: plant architecture, arabica coffee, UV-Vis spectroscopy, FTIR spectroscopy,
chemometric analysis
Introduction
The chemical compositions of Coffea arabica green beans consist of hundreds of different metabolites. The production of these metabolites is influenced by coffee culture managements, soil, climate conditions (temperature and rainfall, solar radiation), plant architecture and harvesting and post-harvesting procedures such as drying, storage and roasting.1-5 Chlorogenic acids (CGA) are related
to sensory characteristics of brewed coffee drink, especially the astringent, acidic and bitter flavors. Significant and positive correlations have been found between the temperature and the formations of 3-caffeoylquinic (3-CQA) and 4-caffeoylquinic acid (4-CQA), whereas
a negative correlations occurs for 5-caffeoylquinic acid (5-CQA), which corresponds to 70-80% of CGA in coffee.6
Altitude has significant and positive correlation with CGA concentration. However, no discussion was provided to prove whether this relationship owes to ground and climate conditions or temperature gradient.7
Coffee tree architecture is characterized by continuous growth and dimorphic axes-orthotropic and plagiotropic. An orthotropic axis follows an opposite-decussate phyllotaxy. At each node, it forms two plagiotropic axes of the 2nd order,
even though sometimes, no branch or just one develops. In Coffea arabica L. (arabica coffee), the plagiotropic axes develop from the 2nd to the 5th orders; the highest branching
orders appearing after three to four years.8
the planting densities from the traditional 700-800 per
hectare to 5,000-10,000. The study of variations in densities and planting patterns in coffee culture studies has involved biological and agronomical analyses, such as fruit production9 as well as ecophysiological explanations
about light access, water stress10-12 and mineral absorption
impacts.13,14
Information about chemical modifications in coffee leaves and beans when subjected to different plant managements can be obtained by metabolomic analysis. It consists on sampling, sample preparation, use of instrumental analytical techniques, processing and interpretation of data.15 It produces metabolic profiles or
fingerprints, providing information about changes in the plant under different growing conditions, soil, climate and other factors.16 During sample preparation, the
extraction process is a key step because it aims isolating the metabolites of the vegetable matrix. The choice of extraction solvent can be made by appropriate statistical mixture designs.17
UV-Vis and infrared spectroscopic analytical techniques have been used in the identification and quantification of metabolome constituents in coffee. Sample preparation is relatively simple and the reagents and equipment are not very expensive. UV-Vis spectroscopy has been applied to caffeine quantification,18-21 simultaneous determination
of methylxanthines,22 determination of chlorogenic
acids and their antioxidant activities23-25 as well as coffee
classification.26 Fourier transform infrared (FTIR) is an
important method for identifying chemical constituents and elucidating their structures and has been considered the best and simplest technique to identify and characterize biomolecules.27 This technique has been used in coffee
samples to estimate methylxanthine amounts in tea and coffee;28 determine the effects of roasting conditions;29
discriminate between defective and non-defective roasted coffees30 and between roasted coffees and their adulterants.31
The spectra subjected to fingerprint analyses contain variance information that can be extracted using a wide variety of chemometric methods.32-34 Multivariate analysis
methods, such as principal component analysis (PCA)35 and
cluster analysis (CA),36 allow dimensionality reduction of
multivariate data and the extraction of essential results from large data sets. These analytical techniques can be associated with adequate methods of multivariate analysis for extracting information about the influence of the space management treatments, such as density and planting patterns, in the production of metabolites in Coffea arabica L. beans. The aim of this work was to investigate ultraviolet (UV) and infrared spectral (FTIR) changes in green bean extracts of
Coffea arabica cv. IAPAR 59 grown in two planting patterns
and at two planting densities. The varying effects of different mixture design solvents on extraction from coffee samples increase the chances of observing the most important spectral changes.
Experimental
Site conditions and coffee plant management
Coffee plants (Coffea arabica L., cv. IAPAR 59) were cultivated in two planting patterns: rectangular (R) and square (S) at two densities: 10,000 and 6,000 plants ha-1 in
experimental fields of the Agronomical Institute of Paraná, in the city of Londrina, Paraná State (23°18’S and 51°17’W), Brazil. The distance between plants was 1 m × 1 m (S10),
3 m × 0.33 m (R10), 1.29 m × 1.29 m (S6) and 3 m × 0.55 m
(R6). Visually mature berries were collected in June of 2010,
defining the first production year after very low pruning (carried out in 2008).
Reagents and sample preparation
The solvents used for extract preparation were ethanol from Exodo (Hortolândia, Brazil), acetone from Fmaia (Cotia, Brazil), dichloromethane and hexane both from Anidrol (Diadema, Brazil). Malic and citric acids were purchased from Synth (Diadema, Brazil). All were of analytical grade quality. The coffee beans were dried in the sun on a concrete yard until reaching 12.5% moisture content. After drying, the beans were cleaned of bark and parchment and all visible defects removed. The beans were frozen with liquid N2 and
were ground to a 0.5 mm particle size (mill Perten 3600). Posteriorly, they were sieved through a Granutest ABNT sieve 25, 071 mm, Tyler 24. The processed samples were packaged into plastic bags and sealed under vacuum in sealant Selovac model 120 BO. The samples were stored in a freezer/cooler Electrolux model 160M, at −18 °C.
Simplex centroid design
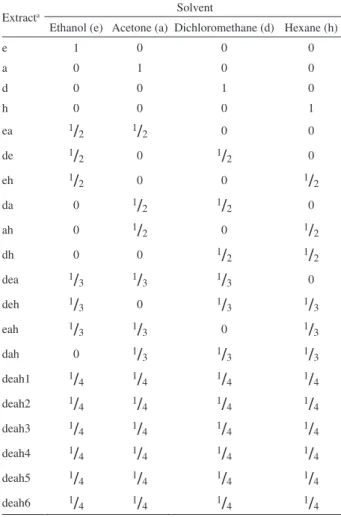
A simplex centroid design for four components was used for obtaining the sample extracts from each treatment. Ethanol, acetone, dichloromethane, hexane and their binary, ternary and quaternary mixtures were investigated (Table 1). Because the coffee bioactive compounds have different polarities, the choice of solvents for extraction was based on this property. Previous studies developed in our laboratory have shown the efficiency of these solvents and their mixtures in the extraction of coffee compounds.21,33,34
(Ultracleaner 1400 Unique), for 120 min and maintained at 15 ± 2 °C with ice. After filtration, the filtrate was collected and the extraction cycle was repeated with the residue. The process was considered exhaustive when a complete overlap occurred between the UV-Vis spectra of two consecutive extractions. The spectrophotometer used was a Thermo Scientific Evolution 60. The solvent was removed in a rotary evaporator (Fisatom model 801) and then the extract was lyophilized at −81.5 ± 0.1 °C and 20 ± 2 mTorr (Lyophilizer SP Scientific Virtis).
Analysis by UV-Vis spectroscopy
UV-Vis spectra were obtained with 50 mg of each extract dissolved in 20 mL of respective extractor solvent. The mixture was placed in an ultrasound bath for 20 min. The spectra were obtained in the 190-800 nm range with the UV-Visible Thermo Scientific model Evolution 60S, using quartz cuvettes with a 1 cm optical path length.
Analysis by infrared spectroscopy (FTIR)
Spectra in the infrared region (4000-675 cm-1) of crude
extracts were obtained with a Thermo Scientific Nicolet iS10 FT-IR spectrometer, using the ATR (attenuated total reflectance) accessory with a Ge window. The measurement was done in the transmittance mode, with 64 scans and 4 cm-1 resolution.
Data processing
Architectural data extraction from the Multiscale Tree Graphs (MTG’s) was performed using AMAPstudio-Xplo software.37 Special attention was paid to berry distribution
along the orthotropic trunk and axes of second order. The extracted number of berries per rank/metamer/axes were used to generate berry distributions.
The Statistica 7.0 software was used in the statistical data analyses for the UV-Vis and infrared spectra. The spectra and loading graphs were plotted using the Origin Pro 8 software.
Results and Discussion
Architecture of or thotropic axis and average berry distribution over the coffee plants
The plant height did not differ between the planting patterns (PPs) and densities, but the metamer number at the orthotropic axes was higher in rectangular PPs than in square ones (Figure 1). In rectangular PP and higher density, the competition between plants in the row promoted apical dominance more than in square PP and lower density.
UV-Vis characteristic profile analysis
The absorptionspectra data were subjected to PCA,
Table 1. Simplex centroid design for four components: ethanol (e), acetone (a), dichloromethane (d) and hexane (h)
Extracta Solvent
Ethanol (e) Acetone (a) Dichloromethane (d) Hexane (h)
e 1 0 0 0
a 0 1 0 0
d 0 0 1 0
h 0 0 0 1
ea 1
/
2 1
/
2 0 0de 1
/
2 0 1
/
2 0eh 1
/
2 0 0 1
/
2da 0 1
/
2 1/
2 0ah 0 1
/
2 0 1/
2dh 0 0 1
/
2 1/
2dea 1
/
3 1/
3 1/
3 0deh 1
/
3 0 1
/
3 1/
3eah 1
/
3 1
/
3 0 1/
3dah 0 1
/
3 1
/
3 1/
3deah1 1
/
4 1
/
4 1/
4 1/
4deah2 1
/
4 1/
4 1/
4 1/
4deah3 1
/
4 1/
4 1/
4 1/
4deah4 1
/
4 1/
4 1/
4 1/
4deah5 1
/
4 1/
4 1/
4 1/
4deah6 1
/
4 1
/
4 1/
4 1/
4aSolvents, binary mixtures, ternary mixtures and quaternary mixtures.
in order to visualize the natural clusters in metabolites from green coffee beans caused by planting densities and patterns. Spectral data (absorbance) were arranged in a matrix of 601 rows and 80 columns, where each row represents a wavelength variable and each column a sample extract (20 simplex design mixtures for four spatial arrangements), to calculate the principal components and cluster analysis. The first three principal components explain 89.40% of the total variance of the data.
Although the scores of 2nd and 3rd principal components
(PC) account for only 30.79% of the total data variance, they provided the important chemical feed-back (Figure 2). The graphical separations of the extraction points were due to the different sample properties and their solvent interactions in the varying solvent media. The separation of extracts along the 2nd factor (PC2) showed two clusters:
on the negative side are the extract points from pure ethanol (e), dichloromethane (d) and hexane (h), the dh, de, eh binary mixtures and the deh ternary mixture. Their UV spectra represent the characteristic profile of the bioactive compounds of coffee (methylxanthines, chlorogenic acids and pentacyclic alcohols). The extracts obtained with acetone (a) and their mixtures with the other solvents are grouped on the positive side of PC2. Their profile indicate the presence of acids and phenolic compounds. Extracts of acetone and hexane:acetone (1:1 v/v) were separated from other solvents in factor 3 (PC3). Some metabolites were identified by their absorption spectra.
The spectra of the ethanol extracts have two peaks: the first at 217 nm with a shoulder at 245 nm and the second peak at 329 nm with shoulder at 298 nm. The minimum was at 264 nm (Figure 3a). The two peaks with their shoulders correspond to HOMO → LUMO (highest occupied molecular orbital to the lowest unoccupied molecular orbital) electronic
transitions. These spectra are typical of chlorogenic acids (CGA) and have been characterized and determined in coffee beans by UV-Vis spectroscopy.38 The low planting density
treatments (S6 and R6) showed higher CGA contents than the
treatments with high planting density (S10 and R10). The larger
space available for each plant at 6,000 plants ha-1 relative to
that at 10,000 plants ha-1 allows an increase in solar radiation
incidence. UV radiation generates free radicals that cause cell damage under this condition, and plants produce antioxidant compounds as defense mechanisms,39 therefore the CGA
Figure 3. Spectra of (a) ethanol; (b) dichloromethane; (c) hexane extracts of green beans of Coffea arabica, cv. IAPAR 59. Plants were cultivated under two planting patterns (S-square and R-rectangular) and two densities (6 and 10 thousand plants ha-1).
level increases. Furthermore, this result indicates that the chlorogenic acid content is related to plant height (Figure 1).
The dichloromethane and hexane extract spectra show the same profile with two peaks: 229-230 nm and 283-290 nm for the dichloromethane extracts (Figure 3b) and 221 and 286 nm, for the hexane extracts (Figure 3c). These peaks are characteristic for unsaponifiable lipids of coffee, cafestol and kahweol. Values for these pentacyclic alcohols were reported at 225 nm for cafestol and 288 nm, for kahweol.40 The S
10
treatment showed higher contents of cafestol and kahweol in the dichloromethane extract. In the hexane extract, the R6
treatment showed a slightly higher kahweol content compared with other treatments. Methylxanthines (caffeine, theobromine and theophylline) also absorb in this spectral region. Studies on caffeine in tea leaves showed that this methylxanthine absorbs between 244 and 300 nm when the solvent extractor was dichloromethane. In this case, the wavelength (λ
max) was
276 nm.19 In water extraction, the methylxanthines showed λ max
between 270 and 280 nm.41 Consequently, the spectra of these
alkaloids could be masked by the kahweol spectrum. In the PC2 × PC3 score plot of Figure 2, the dichloromethane and hexane extracts are grouped very closely, at negative PC2 scores. This confirms that their compositions are similar.
Pairs of extract spectra prepared in a/ah, ea/eah, da/dah and dea/deah exhibited the same spectral profile (Figure 2), indicating the same metabolite class but with higher intensity than those prepared in acetone. The extract spectra obtained
with pure acetone and their mixtures with ethanol and/or hexane exhibited two peaks. The peak at 215 nm is characteristic of citric or malic acid, according to information obtained in our laboratory, having patterns of these acids dissolved in their respective solvent under the same conditions. The peak at 330 nm was not identified.
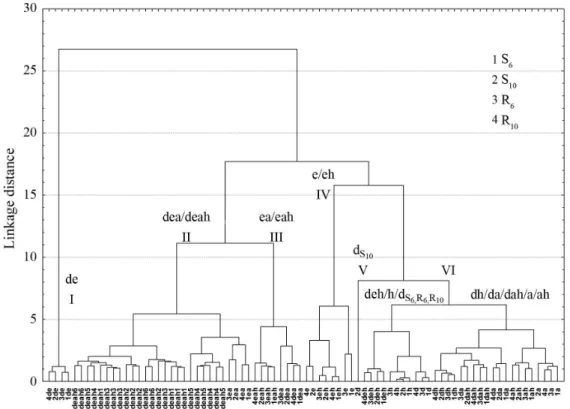
The principal component results were confirmed by cluster analysis (CA) as shown in the dendrogram of Figure 4. The treatments were identified with the numbers 1 (S6), 2 (S10), 3 (R6)
and 4 (R10). When the dendrogram is examined at the point 7.0
(linkage distance), six groups are found. Each group consists of spectra having some similarities. Group I only contains extract spectra obtained with the dichloromethane:ethanol mixture. The profile spectra indicated that this mixture extracted different metabolites than those extracted by their pure solvents. Group II contains extracts obtained from the dea and deah mixtures. Therefore, these mixtures extracted the same types of metabolites having an unidentified peak at 330 nm. Group III corresponds to the spectra of the ea and eah extracts. The 215 nm peak differentiates between the spectra Groups II and III. The extract spectra obtained with ethanol and the ethanol:hexane mixture constitute Group IV, with chlorogenic acid profiles (Figure 3a). Group V is formed only by the S10
dichloromethane extract spectrum. This indicates differences in pentacyclic alcohol (cafestol and kahweol) contents when compared with the other three treatments. The spectra of S6, R10
and R6 dichloromethane extracts are grouped together with the
Figure 4. Dendrogram of the UV spectra of extracts obtained from green grains of C. arabica,cv. IAPAR 59. Plants were cultivated under two planting patterns (S-square and R-rectangular) and two densities (6 and 10 thousand plants ha-1). The treatments were identified with the numbers 1 (S
extract spectra obtained with h, dh, deh, a, ah, and dah, forming Group VI. Figures 3b and 3c show similar profiles for the S6, R10
and R6 dichloromethane and hexane extract spectra. Together
these extracts form a subgroup of Group VI.
FTIR fingerprint analysis
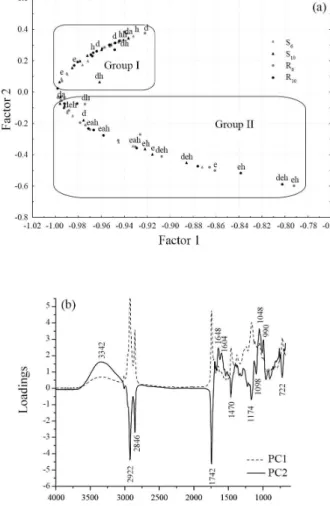
PCA was also conducted on the complete FTIR spectra. The matrix was composed of 80 samples (extracts) and 1678 variables. The first two principal components explained 99.03% of the total data variance. The PC1 × PC2 score plot shows two groups separated on PC2 (Figure 5a), appearing very different from those at Figure 2, where extracts were grouped according to the extractor solvent. The spectral points lay on one of two almost straight lines indicating two major components (Figure 5a). Overlaying points with similar extracts fall at the intersection whereas the more divergent spectra occur at the two extreme limits. The pure hexane and dichloromethane solvents and binary and ternary mixtures containing acetone and dichloromethane (Group I) have positive values of PC2.
The extracts of binary or ternary mixtures containing ethanol and hexane fall at negative PC2 values (Group II). In order to view the points of interest more easily, some symbols identifying the extracts were eliminated.
Figure 5b shows the PC1 and PC2 loading plots. Along PC2, large positive loadings are found at 3342, 1648, 1604, 1048 and 990 cm-1 and correspond to the crude extracts
of Group I (binary or ternary mixtures containing acetone and dichloromethane). The samples of Group II have large negative loadings for frequency values at 2922, 2846, 1742, 1470, 1174, 1098 and 722 cm-1. The bands in 1500-2000 cm-1
range were related to C=C and C=O stretching modes, but depending on the type of C=O bond bands can vary within the 1650-1830 cm-1 region. C=N stretching also occurs in
this region.42 In Group I, bands observed at 3342 (N−H
stretching) and 1648 cm-1, probably correspond to caffeine. The
dichloromethane solvent belongs to this group and has been used to decaffeinate and isolate caffeine from aqueous coffee extracts.43 In Group II, the band at 1742 cm-1 characterizes the
stretching vibration of the carbonyl group of methyl ester and the region between 1179 and 1166 cm-1 is assigned to C−O
stretching of esters.44 The band at 1174 cm-1 is characteristic of
the stretching vibration of the C−O bond of higher esters.45,46
The hexane extract belongs to Group II and this solvent is frequently used in the lipid extraction.47 The bands at 2918
and 2861 cm-1 are attributed respectively to the asymmetric
and symmetric stretching vibrations of sp3 hybridized C−H
bonds. The band at 1464 cm-1 corresponds to the symmetrical
angular deformation of methylene groups.42 These groups are
present in the fatty acids studied in coffee.48
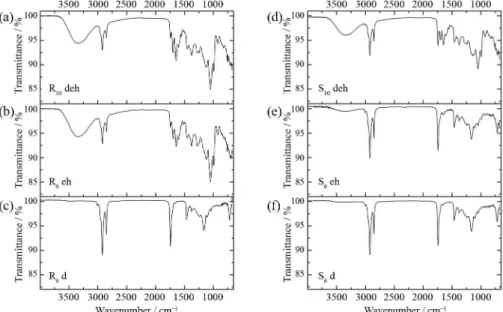
The spectra of the points of Groups I and II (Figure 5a) were plotted to examine their behavior. The dichloromethane extract R6 (R6 d) was chosen to represent the extreme of
Group I. The ethanol:hexane extract of R6(R6 eh) and the
dichloromethane:ethanol:hexane extract of R10 (R10 deh)
represented the extreme of the Group II (Figure 5a). Similarly, their corresponding spectra of the square arrangement S10
deh, S6 eh and S6 d extracts were plotted to search for possible
changes in metabolite production owing to planting pattern. Their FTIR fingerprint are presented in Figure 6.
The R10 deh, R6 eh and S10 deh spectra (Figures 6a, 6b
and 6d) have different characteristics from those provided by the loading plot for Group II (Figure 5b). These spectra have a broad band around 3333 cm-1 and sharper ones at 1644,
1600, 1050 and 993 cm-1. These bands are coincident with the
Group I peaks in the loading plot. Other bands were observed for these extracts at 1747 (fatty acid esters) and 1704 (organic acid) cm-1.49 The region with bands at 1452, 1380, 1260, 1128
and 1059 cm-1 can be attributed to chlorogenic acids.50 The
spectral bands of beans collected from rectangular planting patterns (R10 deh and R6 eh) were more intense than those of Figure 5. (a) PC1 × PC2 score plot; (b) their loading plot for the FTIR
bean extracts of the S10 spectra (S10 deh). The R6 d and S6 d
extract spectra (Figures 6c and 6f) exhibit the same profile but they do not have the characteristic bands of Group I: 3342, 1648, 1604, 1048 and 990 cm-1 as shown on the positive values
of the loading plot (Figure 5b). These spectra present bands at 2920, 2865, 1735, 1459, 1165, 1095 and 721 cm-1, the same
as those of Group II. Other bands characterize these extracts: 3010 (=C−H stretching), 1380 (C−H bending of CH3 group),
and 721 cm-1 (rocking motion of (CH
2)n when n ≥ 4)42 and
the region between 1300 and 1000 (C−O stretching).44 This
information indicates the possible presence of fatty acid esters in the R6 and S6 dichloromethane grain extracts, meaning that
more available soil space for plants leads to the formation of more fatty acids.
The S6 eh spectrum (Figure 6e) has a similar profile to the
R6 d and S6 d spectra (Figures 6c and 6f) and these extracts
were placed in Group I (Figure 5a). The ethanol:hexane extracts of the other three treatments (R6, R10 and S10) are in
Group II. This suggests that the S6 metabolites extracted by
the ethanol:hexane mixture are different from those of the S10,
R6 and R10 metabolites, due to the distribution over the coffee
plant architecture (Figure 1).
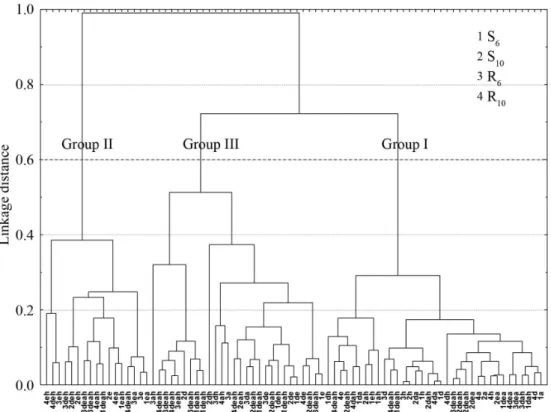
The results of PCA were confirmed by CA. A linkage distance of 0.6 discriminates three groups (Figure 7). Group I (extracts of binary or ternary mixtures of acetone and dichloromethane) (Figure 5a) is located on the right of the dendrogram whereas Group II extracts of binary or ternary mixtures of ethanol and hexane are located on the left while the third group is not clearly characterized. Group III contained extracts obtained with the quaternary mixtures of solvents and those obtained with the ethanol:dichloromethane mixture. Figure 7 also shows that space management treatments are
separated by the pure ethanol and dichloromethane solvents, indicating that levels of chlorogenic acids and cafestol/kahweol or caffeine could discriminate these treatments. These results can be compared with those obtained for the UV-Vis spectra of ethanol and dichloromethane extracts (Figures 3a and 3b). The spectra of the ethanol extracts showed a CGA profile with the S6
treatment having the highest contents of these acids (Figure 3a). In the CA of infrared fingerprint, the S6 ethanol extract is
isolated from the others (S10 e, R6 e and R10 e) in Group III
(Figure 7). In the UV-Vis characteristic profile (Figure 3b), the S10 treatment exhibits the highest content of cafestol and
kahweol and it appears separated from the others in Group III of the infrared dendrogram (Figure 7).
The four FTIR spectra of bean extracts obtained with the ethanol:dichloromethane mixture showed similar spectral profiles (Figure 8a). The bands at 3331 (N−H) and 1695, 1648 and 1604 cm-1 can be attributed to C=C and C=N
stretching. These groups are present in caffeine. The bands at 1742 cm-1 (C=O stretching), 2841 and 2920 cm-1 (C−H
stretching of CH2 and CH3 groups)and1165 cm-1 (C−O
stretching)can be assigned to triacylglycerols.44 The weak
band at 3009 cm-1 can be attributed to C−H stretching in
=C−H.51 This indicates the presence of unsaturated fatty
acids.
The FTIR spectra of ethanol extracts for S10 and R6
showed bands in various regions that were different from those of the S6 and R10 spectra (Figure 8b). Only spectra
from first two have a broad band in the 3100-3600 cm-1
region attributed to the presence of compounds with O−H and N−H groups.46 The band at 1742 cm-1 corresponds to
Figure 7. Dendrogram of the FTIR spectra of extracts obtained from green grains of C. arabica,cv. IAPAR 59. Plants were cultivated under two planting patterns (S-square and R-rectangular) and two densities (6 and 10 thousand plants ha-1). The treatments were identified with the numbers 1 (S
6), 2 (S10), 3 (R6) and 4 (R10).
Figure 8. FTIR spectra of (a) ethanol:dichloromethane; (b) ethanol extracts obtained from green beans of C. arabica,cv. IAPAR 59. Plants were cultivated under two planting patterns (S-square and R-rectangular) and two densities (6 and 10 thousand plants ha-1).
1700 and 1500 cm-1 can be assigned to the peptide bond
(C−NH) absorption of the protein backbone.45 Moreover,
they present several intense bands in the region between 1325 and 950 cm-1. This region can be associated with
carbohydrates.45 The S
6 and R10 spectra have characteristic
triacylglicerols bands: 1742 (intense), the 3000-2800 cm1
region corresponding to C−H stretching, 1463 and 1379 cm1
(CH2 and CH3 scissoring) and 1121 and 720 cm-1 (CH3 and
CH2 wagging).44 This suggests that these space management
treatments may have higher triacylglycerol contents than S10
and R6.This triacylglycerol metabolomic fingerprint could
Conclusions
The PCA of the UV-Vis spectra showed that characteristic profile differences were assigned mainly to ethanol extracts that exhibit a characteristic chlorogenic acid profile. The highest CGA content was found for the lower planting density treatments (S6 and R6). The dichloromethane and hexane
spectra showed cafestol and kahweol peaks. The S10 treatment
showed higher contents of these unsaponifiable lipids in the dichloromethane extract. The hexane extract of the R6 treatment
showed a slightly higher content of these pentacyclic alcohols relative to those of the other treatments. Based in this analysis, bioactive coffee compounds can be extracted using the pure solvents. The cluster analysis of FTIR fingerprints confirmed that the levels of chlorogenic acids and caffeine differentiated these treatments. The FTIR spectra analysis suggests that S6 and
R10 present more lipid contents whereas S10 and R6 treatments
have more content of sugars and proteins.
Acknowledgments
This work was support by CNPq, Fundação Araucária and Consórcio Brasileiro de Pesquisa e Desenvolvimento de Cafés, Brazilian granting agencies.
References
1. da Matta, F. M.; Ramalho, J. D. C.; Braz. J. Plant Physiol. 2006,
18, 55.
2. Thierry, J.; Laffargue, A.; Descroix, F.; Doulbeau, S.; Bertrand, B.; Kochko, A.; Dussert, S.; Food Chem. 2010, 118, 693. 3. Gonzalez-Rios, O.; Suarez-Quiroz, M. L.; Boulanger, R.; Barel,
M.; Guyot, B.; Guiraud, J. P.; Schorr-Galindo, S.; J. Food Compos. Anal. 2007, 20, 289.
4. Selmar, D.; Bytof, G.; Knopp, S. E.; Ann. Bot. 2008, 101, 31.
5. Hečimović, I.; Belščak-Cvitanović, A.; Horžić, D.; Komes, D.;
Food Chem. 2011, 129, 991.
6. Jöet, T.; Laffarge, A.; Descroix, F.; Doulbeau, S.; Bertrand, B.; Kochko, A.; Dussert, S.; Food Chem. 2010, 118, 693. 7. Bertrand, B.; Boulanger, R.; Dussert, S.; Ribeyre, F.; Berthiot,
L.; Descroix, F.; Joët, T.; Food Chem. 2012, 135, 2575. 8. Rakocevic, M.; Androcioli-Filho, A.; Coffee Sci. 2010, 5, 154. 9. Paulo, E. M.; Furlani Jr., E.; Sci. Agric. 2010, 67, 720. 10. Santana, M. S.; Oliveira, C. A. S.; Quadros, M.; Eng. Agric.
2004, 24, 644.
11. Melke, A.; Fetene, M.; Theor. Exp. Plant Physiol. 2014, 26, 225.
12. Nascimento, L. M.; Sphar, C. R.; Sandri, D.; Coffee Sci. 2014,
9, 354.
13. Valadares, S. V.; Neves, J. C. L.; Novais, R. F.; Rosa, G. N. G.
P.; Martinez, H. E. P.; Venegas, V. H. A.; R. Bras. Ci. Solo 2014,
38, 905.
14. Prezotti, L. C.; da Rocha, A. C.; Bragantia 2004, 63, 239. 15. Dunn, W. B.; Ellis, D. I.; TrAC,Trends Anal. Chem. 2005, 24,
285.
16. Villas-Bôas, S. G.; Gombert, A. K.; Biotecnologia Cienc. Desenvolv. 2006, 9, 58.
17. Soares, P. K.; Bruns, R. E.; Scarmínio, I. S.; J. Sep. Sci. 2007,
30, 3302.
18. Belay, A.; Ture, K.; Redi, M.; Asfaw, A.; Food Chem. 2008,
108, 310.
19. Atomssa, T.; Gholap, A. V.; Afr. J. Pure Appl. Chem. 2011, 5, 1.
20. Dobrinas, S.; Soceanu, A.; Popescu, V.; Stanciu, G.; Smalberger, S.; St. Cerc. St. CICBIA 2013, 14, 71.
21. Delaroza, F.; Rakocevic, M.; Malta, G. B.; Bruns, R. E.; Scarminio, I. S.; J. Braz. Chem. Soc. 2014, 25, 1929. 22. Martínez, L. L.; López-de-Alba, P. L.; Campos, R. G.;
Rodríguez, L. M. L.; Anal. Chim. Acta 2003, 493, 83. 23. Atoui, A. K.; Mansouri, A.; Boskou, G.; Kefalas, P.; Food Chem.
2005, 89, 27.
24. Parras, P.; Martínez-Tomé, M.; Jiménez, A. M.; Murcia, M. A.;
Food Chem. 2007, 102, 582.
25. Vignoli, J. A.; Bassoli, D. G.; Benassi, M. T.; Food Chem. 2011,
124, 863.
26. Souto, U. T. C. P.; Pontes, M. J. C.; Silva, E. C.; Galvão, R. K. H.; Araújo, M. C. U.; Sanches, F. A. C.; Cunha, F. A. S.; Oliveira, M. S. R.; Food Chem. 2010, 119, 368.
27. Kumar, J. K.; Prasad, A. G. D.; Drug Invent. Today 2012, 4, 616.
28. Paradkar, M. M.; Irudayara, J.; J. Food Sci. 2002, 67, 2507. 29. Lyman, D. J.; Benck, R.; Dell, S.; Merle, S.; Murray-Wijelath,
J.; J. Agric. Food Chem. 2013, 51, 3268.
30. Craig, A. P.; França, A. S.; Oliveira, L. S.; Food Sci. Technol. 2012, 47, 505.
31. Reis, N.; França, A. S.; Oliveira, L. S.; Food Sci. Technol. 2013,
50, 715.
32. de Souza, R. M. N.; Benassi, M. T.; J. Braz. Chem. Soc. 2012,
23, 1347.
33. Moreira, I.; Scarminio, I. S.; Talanta 2013, 107, 416. 34. Moreira, I.; Scheel, G. L.; Hatumura, P. H.; Scarminio, I. S.;
Quim. Nova 2014, 37, 39.
35. Marques, J. M.; Marques, M. A. M.; Rev. FAECuritiba 2005,
8, 93.
36. Miller, J. N.; Miller, J. C.; Statistics and Chemometrics for Analytical Chemistry, 6th ed.; Pearson: Gosport, UK, 2010.
37. Griffon, S.; de Coligny, F.; Ecol. Modell. 2014, 290, 3. 38. Belay, A.; Gholap, A. V.; Afr. J. Pure Appl. Chem. 2009, 3, 234. 39. Heck, C. I.; Mejia, E. G.; J. Food Sci. 2007, 72, 138. 40. Dias, R. C. E.; de Faria, A. F.; Mercadante, A. Z.; Bragagnolo,
41. Khanchi, A. R.; Mahani, M. K.; Hajihosseini, M.; Maragheh, M. G.; Chaloosi, M.; Bani, F.; Food Chem. 2007, 103, 1062. 42. Pavia, D. L.; Lampman, G. M.; Kriz, G. S.; Introduction of
Spectroscopy: A Guide for Students of Organic Chemistry, 2th ed.;
Saunders College Publishing: Orlando, USA, 1996, pp. 511. 43. Toci, A.; Farah, A.; Trugo, L. C.; Quim. Nova 2006, 29, 965. 44. Chapman, D.; J. Am. Oil Chem. Soc. 1965, 42, 353.
45. Dufour, E. In Infrared Spectroscopy for Food Quality, Analysis and Control; Sun, D.-W., ed.; Academic Press: USA, 2009, pp. 448.
46. Mistry, B. D.; Handbook of Spectroscopy Data: Chemistry-UV, IR, PMR, CNMR and Mass Spectroscopy; Oxford Book Company: Jaipur, India, 2009, pp. 242.
47. Brum, A. A. S.; Arruda, L. F.; Regitano-D’Arce, M. A. B.; Quim. Nova 2009, 32, 849.
48. Nikolova-Damyanova, B.; Velikova, R.; Jham, G. N.; Food Res. Int. 1998, 31, 479.
49. Dimitrić-Marković, J. M.; Mioć, U. B.; Baranac, J. M.; Nedić, Z. P.; J. Serb. Chem. Soc. 2001, 66, 451.
50. Segneanu, A. E.; Grozescu, I.; Sfirloaga, P.; Dig. J. Nanomater. Bios. 2013, 8, 1423.
51. Schulz, H.; Baranska, M.; Vib. Spectrosc. 2007, 43, 13.
Submitted: October 20, 2015 Published online: January 27, 2016