ISSN 0104-6632 Printed in Brazil
www.abeq.org.br/bjche
Vol. 24, No. 04, pp. 597 - 610 October - December, 2007
of Chemical
Engineering
ADSORPTION EQUILIBRIUM OF LIGHT
HYDROCARBON MIXTURES BY
MONTE CARLO SIMULATION
V. F. Cabral, M. Castier and F. W. Tavares
*Escola de Química, Universidade Federal do Rio de Janeiro, Phone: +(55) (21) 2562-7650, Fax: +(55) (21) 25627631, Cx P 68542, CEP 21949-900, Rio de Janeiro - RJ, Brazil.
E-mail: [email protected].
(Received: May 30, 2005 ; Accepted: February 20, 2007)
Abstract - The procedure presented by Cabral et al. (2003) was used to predict the adsorption of
multicomponent mixtures of methane, ethane, propane, and n-butane adsorbed on Silicalite S-115 at 300 K. The methodology employed uses the algorithm of molecular simulation for the grand canonical ensemble as an equation of state for the adsorbed phase. The adsorbent surface is modeled as a two-dimensional lattice in which solid heterogeneity is represented by of two kinds of sites with different adsorption energies. In all cases presented, the simulations described well the adsorption characteristics of the systems.
Keywords: Adsorption; Multicomponent mixtures; Monte Carlo simulation.
INTRODUCTION
In the past few years, separation and purification processes based on adsorption have become, in some cases, economically feasible alternatives to unit operations traditionally used in the chemical industry. For this reason, the development of new methodologies capable of predicting this phenomenon in the case of multicomponent mixtures is important for the design of new processes and for the optimization of existing ones.
Several methodologies have been developed to correlate adsorption data on pure components and to predict gas mixture adsorption. These include the Langmuir model (Langmuir, 1918), the statistical approach (Hill, 1960), the potential model (Grant and Manes, 1966), the vacancy solution model (Suwanayuen and Danner, 1980a, 1980b), the ideal adsorbed solution theory (Myers and Prausnitz, 1965), the heterogeneous ideal adsorbed solution theory (Valenzuela et al., 1988), and two-dimensional equations of state (Hoory and Prausnitz,
For engineering problems, the use of less detailed models, which still address the major aspects of adsorption phenomena, represents a feasible compromise. Several papers have followed this approach. In these publications, the authors supposed that the adsorbent surface is represented by a two-dimensional square lattice of M active sites. Ramirez-Pastor et al. (1995) studied the adsorption of dimers on heterogeneous surfaces, using experimental adsorption isotherms for O2 and N2 adsorbed on zeolites 5A and 10X to test the reliability of their simulation model. The parameters of the simulation model were adjusted to fit the experimental data. Ramirez-Pastor et al. (2000) used Monte Carlo simulations to study the adsorption of noninteracting homonuclear linear k-mers on heterogeneous surfaces. The authors modeled the heterogeneous surface with two kinds of sites. These sites formed square patches distributed at random or in a chessboardlike-ordered domain on a two-dimensional square lattice. Bulnes et al. (2001) studied the adsorption of binary mixtures on heterogeneous solids using Monte Carlo simulations in the framework of the lattice gas model. Cabral et al. (2003) proposed a new methodology for correlating the adsorption of pure components and for predicting the adsorption of binary and ternary mixtures on homogeneous and heterogeneous solids. The methodology proposed by the authors uses the algorithm of molecular simulation in the grand canonical ensemble as an equation of state for the adsorbed phase. In this technique, the chemical potential (P), the total number of adsorption sites (M), and the temperature (T) are specified. In all cases presented, the simulations described the adsorption characteristics of systems. The results obtained for the adsorption of the binary mixtures of propane-CO2 and propane-H2S, which are strongly nonideal, were quite satisfactory, showing the potential of this technique for the description of real systems.
In this paper, the methodology proposed by Cabral et al. (2003) representing the adsorbent surface as a two-dimensional square lattice, is used. The parameters of the simulation model are fitted using experimental data for the adsorption of pure components and a fitting procedure analogous to that performed in the case of a usual equation of state for determination of the PVT properties of a fluid. The model is then used for predicting the adsorption of binary, ternary, and quaternary mixtures of methane, ethane, propane, and n-butane on Silicalite S-115 (Abdul-Rehman et al., 1990).
The outline of the paper is as follows: in the next
section, the Monte Carlo technique is presented briefly. In the third section, we present the simulation model used in this work. Next, we present the strategy used for parameter fitting. We then present our predictions for adsorbed binary, ternary, and quaternary mixtures. Finally, in the last section, we present our conclusions.
MONTE CARLO SIMULATION
The methodology used in this work employs the Monte Carlo method for a grand canonical ensemble (T, M,
P
1,P
2,…, Pncspecified). According to the Metropolis algorithm (Allen and Tildesley, 1987), this technique consists of three basic movements: displacement, insertion, and removal of an adsorbed molecule. The transition probability from a configurational state o to a new state n is expressed by¿
¾
½
¯
®
o o n n oȡ
ȡ
1,
min
P
(1)where o n
U U
is the ratio between the probability
densities of the configurational states o and n. The movement is accepted when the probability
P
oon is higher than a number randomly generated between 0 and 1. In this work, the random numbers are generated using the routine ran2 from Press et al. (1992). More details about each movement can be found in Cabral et al. (2003).SIMULATION MODEL
The chainlike molecule used in this work is modeled as m interaction centers at a fixed separation, which is equal to the horizontal and vertical distances between neighbor sites on the lattice. In the adsorption process, we assume that each molecular segment occupies a single adsorption site. Each molecular segment interacts with at most four neighboring sites, i.e., the number of neighboring sites of each site on the lattice is four. This parameter is named coordination number (Z). Figure 1 shows a chainlike molecule composed of four segments in three possible configurations.
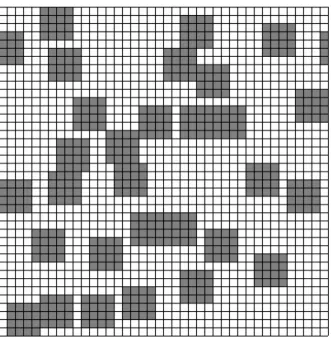
which the solid heterogeneity is represented by two kinds of sites, characterized by the energies Ha and
b
H
. The sites that have a stronger bond (higher energy: Ha) to the adsorbate are called active sites and the fraction of active sites is Qa. For each fraction of active sites, several topologies can be generated, each of them characterized by a random distribution of square grains with a specific number of sites. To visualize this statement, Figure 2 shows a solid square lattice (M = 1600) with a fraction of 30% of its active sites and clusters (grains) of sites having dimension Dg 4. In order to minimize the effectof the solid size, periodic boundary conditions are considered, both for distributing the grains of active sites on the solid and for moving molecules on the lattice. The square lattice is replicated throughout space to mimic an infinite solid. In the course of a simulation, if a molecule moves in the central lattice, its periodic image in each of the neighboring lattices moves in the same way. Thus, if a segment leaves the central lattice from one face, one of its images will enter the central lattice through the opposite face. More details of the periodic boundary conditions can be found elsewhere (Allen and Tildesley, 1987).
Figure 1: Chainlike molecule model.
PARAMETER FITTING
The parameters of the model are the Henry constant (Kbi); the amount adsorbed at infinite pressure (
N
if); the side-interaction energy between two adsorbed segments of a molecule “i” at neighboring sites (Z
ii/
kT
); and the parameter rai, which is related to the surface heterogeneity. The equation for parameter rai is»¼ º «¬
ª H H kT exp
r ai bi
ai (2)
Once the values of parameters
H
bi and rai are known, the adsorption energy between an active site and a segment of molecule i (H
ai) is determined using Equation (2). In the case of homogeneous solids,ai bi
H
H
, and therefore parameter rai is 1.In order to fit all these parameters, we use an algorithm that finds a minimum point of the objective function of n variables (parameters). For a complete description of this algorithm, see Nelder and Mead (1965) or Gill et al. (1981). We use the nonweighted least-square function related to deviations in the amount adsorbed as the objective function. Thus, in the procedure for fitting the model parameters, pressure is used as the independent variable. Therefore, we assume deviations only in the measurements of the amount adsorbed. More details about the numerical aspects of this procedure can be found in Cabral et al. (2003).
In order to use the model, it is necessary to establish a strategy to characterize the adsorbent and the adsorbates at the microscopic level. Next, we present the strategies used to obtain model parameters from pure component adsorption data.
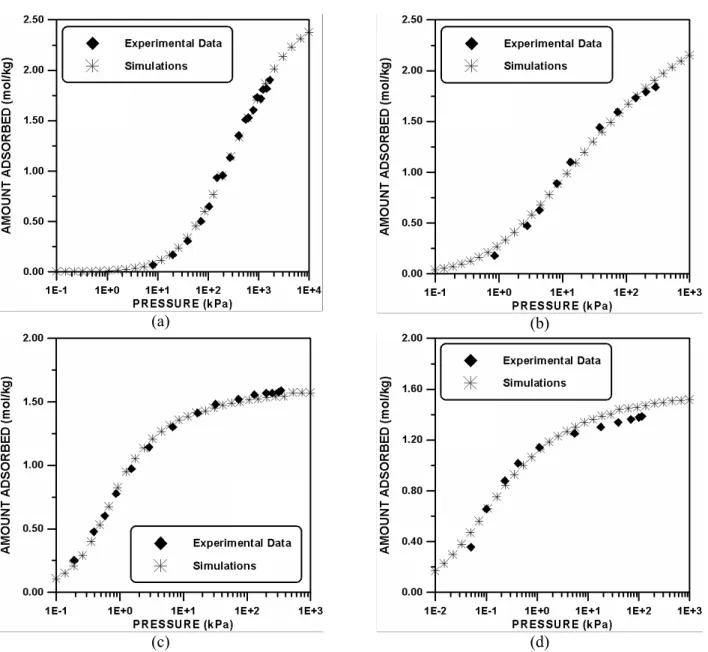
Methane, Ethane, Propane, and n-Butane Adsorbed on Silicalite S-115
The molecules of methane and ethane are modeled with three segments (
m
methane3
,m
ethane3
), whereas the remaining components (propane and n-butane) are modeled with five segments, i.e.,5
mpropane and
m
nbutane5
. These values are chosen in such a way that the amount adsorbed at infinite pressure of each component (N
fi ) would become compatible with the experimental value of this variable, because both variables (N
fi and mi) must obey the following equation:methane methane ethane ethane
propane propane bu tan e bu tan e
N m N m
N m N m
f f
f f (3)
Silicalite S-115 is a sister material to zeolite ZSM-5 (Abdul-Rehman, 1990). This kind of solid has two types of channels straight and zigzag channels which are connected via intersections. The zigzag channels have a diameter of 5.4 Å, while the straight channels are elliptic and with the larger and the smaller axes being 5.75 and 5.15 Å, respectively.
Vlugt et al. (1999) studied the adsorption of linear and branched alkanes on this kind of solid through molecular simulation using a three-dimensional solid and a complete force field for the alkanes. At low pressures, the authors observed that the molecules are located at the intersections. Interestingly, at high pressures this scenery changes and the molecules are adsorbed uniformly throughout the solid. Vlugt et al. (1999) determined that the maximum capacity of the intersections occurs with the loading of four molecules per unit cell (
F
*A4
). The solid is modeled here as a lattice with two kinds of site. The active sites correspond to the intersections that can be occupied. The fraction of active sites (Q
a) is calculated using information about the adsorption of n-butane. This molecule has a maximum capacity of nine molecules per unit cell (F
max9
). Therefore, the fraction of active sites is calculated using the following equation: * A a max 0.44 F QF (4)
The active sites are arbitrarily grouped in square grains with the dimension Dg=4.
Using propane as a reference substance, four parameters (Kbi,
Z
ii/
kT
, rai, andf i
N ) are fitted. Next, three parameters (Kbi,
Z
ii/
kT
, and rai) of the remaining substances are fitted. The amounts of these molecules adsorbed at infinite pressure are calculated using Equation (3).Table 1: Parameters for methane, ethane, propane, and n-butane adsorbed on Silicalite S-115 at a temperature of 300K.
Parameters
Substances Kb(kPa
-1
) ra Z/kT Nf(mol/kg)
Methane 2.2034
u
10-4 2.4296 0.3339 2.7500Ethane 8.7942
u
10-2 0.5400 -0.1266 2.7500Propane 0.1575 0.8212 0.5213 1.6500
n-Butane 5.4071 0.6190 0.2367 1.6500
(a) (b)
(c) (d)
PREDICTIONS FOR MIXTURES
Results of the predicted behavior of adsorbed binary mixtures are presented in two diagrams. In the first the mole fraction of component 1 in the gas phase, Y(1), is shown as a function of the mole fraction of component 1 in the adsorbed phase, X(1), and in the second diagram presents the adsorbed amount versus the mole fraction of component 1 in the adsorbed phase, X(1) is shown.
For each simulated point, 6.106 Monte Carlo steps are performed to allow the system to reach equilibrium. The average properties of the system are computed after the performance of 105 Monte Carlo steps. This procedure is repeated ten times, for different randomly generated solids with the same fraction of active sites and the same grain dimension. The overall average and the standard deviation of the properties at each point are then calculated with 100 averaged values. Each Monte Carlo step is composed of one attempt to move, insert, and remove different molecules in the system.
The proposed simulation model needs combining and mixing rules, in the same way that an equation of state applied to determine the PVT properties of a gas mixture does. The following mixing rule is used to determine the amount of mixture adsorbed at infinite pressure (
N
fmix):¦
f f nc 1 i i i mixN
x
N
1
(5)where
x
i is the mole fraction of component i in the adsorbed phase. The following combining rule, suggested by Romanielo (1991), is used to calculate the cross-contact energy (Z
ki/
kT
):¸¸
¹
·
¨¨
©
§
Z
Z
Z
i k ii kk 2 1 i k kim
m
kT
m
m
kT
(6)Binary Mixtures
Abdul-Rehman et al. (1990) studied the binary mixtures of ethane(2), methane(1)-propane(2), methane(1)-n-butane(2), and ethane(1)- propane(2) adsorbed on Silicalite S-115 at 345 and 655 kPa and a temperature of 300 K. All mixtures have nearly ideal behavior.
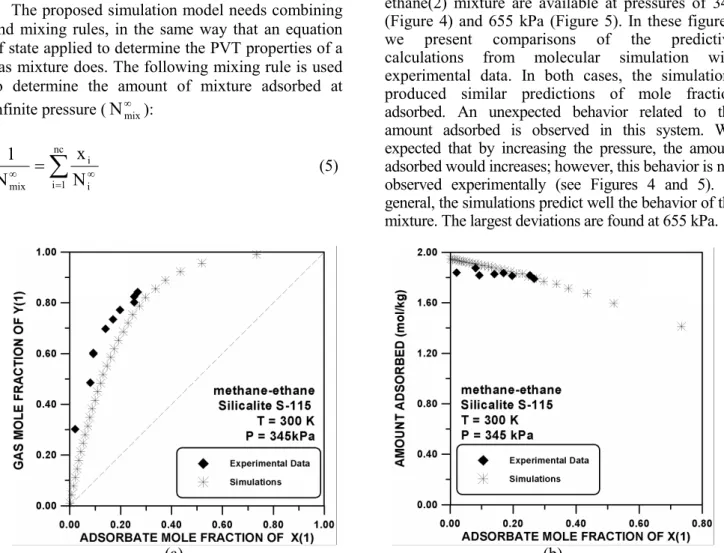
Methane(1)-Ethane(2) at 345 and 655 kPa
The experimental data for the methane(1)-ethane(2) mixture are available at pressures of 345 (Figure 4) and 655 kPa (Figure 5). In these figures, we present comparisons of the predictive calculations from molecular simulation with experimental data. In both cases, the simulations produced similar predictions of mole fraction adsorbed. An unexpected behavior related to the amount adsorbed is observed in this system. We expected that by increasing the pressure, the amount adsorbed would increases; however, this behavior is not observed experimentally (see Figures 4 and 5). In general, the simulations predict well the behavior of the mixture. The largest deviations are found at 655 kPa.
(a) (b)
(a) (b)
Figure 5: Phase-equilibrium diagram (a) and total amount adsorbed (b) for methane(1)-ethane(2) on Silicalite S-115 at 655 kPa and 300 K. Straight dotted line is for X(1)=Y(1).
Methane(1)-Propane(2) at a pressure of 345 kPa
In this mixture, propane is adsorbed preferentially on Sicalite S-115. This behavior can be confirmed by analyzing the experimental data on pure components at the same pressure as that of the mixture. As in the case of the previous mixture, the experimental data show an increase in the amount of mixture adsorbed when compared to the amount of pure components adsorbed at the same temperature. This behavior is not predicted by simulations that show systematic deviations in the prediction of amount adsorbed. Indeed the simulations are consistent with the amount adsorbed at the limit of the pure component.
However, in general, the simulations satisfactorily represent this system. In Figure 6 a comparison of the experimental data with those obtained by simulations is presented.
Methane(1)-n-Butane(2) at a pressure of 345 kPa
In Figure 7 results of adsorption are presented for the methane(1)-n-butane(2) mixture. In this system, there is a strong preference for adsorption of n-butane in this mixture. The simulations predict well the behavior of this system. However, the simulations slightly overpredict the adsorption capacity of the mixture.
(a) (b)
(a) (b)
Figure 7: Phase-equilibrium diagram (a) and total amount adsorbed (b) for methane(1)-n-butane(2) on Silicalite S-115 at 345 kPa and 300 K. Straight dotted line is for X(1)=Y(1).
Ethane(1)-Propane(2) at a Pressure of 345 kPa
The results for the ethane(1)-propane(2) mixture are presented in Figure 8. This mixture seems to have a maximum on the curve of adsorbed moles. This behavior should indicate a deviation from ideality by the adsorbed solution. However, this behavior is not confirmed by the phase diagram of
this system, which does not show inversions in the selectivity of components. The simulations predict well the behavior of this system in terms of mole fraction adsorbed. In the case of the amount adsorbed, the simulations do not predict the maximum on the curve of adsorbed moles, but rather a continuous increase in this variable with the increase in gas mole fraction of ethane Y(1).
(a) (b)
In Figure 9 the average deviations of adsorbed mole fraction ( X(i)% ) and the average relative
deviations of amount adsorbed (NRads%) are presented for each binary mixture. The definitions of these deviations are respectively given by:
np
exp cal j j
j 1
100
X(i)% X(i) X(i)
np
¦
(7)exp cal
np
jads jads
R
ads exp
j
j 1 ads
N N
100 N %
np N
¦
(8)where np is the experimental number of points of each set of experimental data;
X(i)
expj andX(i)
calj are respectively the experimental adsorbed mole fractions of species i and those obtained from simulations; andexp ads
N and Ncalads are the experimental adsorbed mole numbers and those obtained from simulations. The number allocated for each binary mixture corresponds to the order in which that mixtures appear in the text. Therefore, the numbers from 1 to 5 are related to the mixtures of methane-ethane at 345 and 655 kPa, mpropane, mbutane, and ethane-propane, respectively.
Figure 9: Average deviations of adsorbed mole fraction ( X(i)% ) and the average relative deviations of amount adsorbed (NRads%), calculated for each binary mixture. Each number holds for a mixture, i.e., 1 for methane-ethane at 345 and 2 for methane-ethane at 655 kPa, 3 for methane-propane, 4 for methane-butane, and 5 for ethane-propane.
Ternary Mixtures
Abdul-Rehman et al. (1990) also presented experimental data on three ternary mixtures: ethane(2)-propane(3), methane(1)-ethane(2)-n-butane(3), and methane(1)-propane(2)-n-butane(3). Here, we show that our procedure can describe well the adsorption of these mixtures.
Methane(1)-Ethane(2)-Propane(3) at 345 kPa and 300 K
In Figures 10 and 11 present the performance of simulations in predicting the adsorption of this ternary mixture are presented. In Figure 10 the adsorbed mole fraction of methane and ethane as a function of the gas mole fraction of methane is shown, specifying that the ratio of the gas mole fractions of ethane to propane is 2.77, i.e., Y(2)/Y(3) = 2.77. In this figure, the profile for
adsorbed mole fraction of ethane intercepts the straight line Y(2)=X(2). Thus, an increase in the gas mole fraction of ethane produces an inversion in adsorption selectivity for this system. In the situation where there is low concentration of methane in the gas phase, the adsorbed mole fraction of ethane is smaller than in the gas phase. His behavior is inverted for a high concentration of methane in the gas phase. In Figure 11 the adsorbed mole fraction of propane and the amount adsorbed as functions of gas mole fraction of methane are presented. In general, the simulations describe well the features of this ternary mixture. For these predictions, the average deviations of adsorbed mole fraction (X(i)%) of methane, ethane, and propane are determined to be 8.3, 4.4, and 12.7% respectively, whereas the average relative deviations as a function of amount
(a)
(b)Figure 10: Profile for adsorbed mole fraction of methane (a) and ethane (b) as functions of the gas mole fraction of methane for the methane(1)-ethane(2)-propane(3) ternary mixture on Silicalite S-115 at 345 kPa and 300 K and at a fixed ratio of Y(2)/Y(3) = 2.77. Straight dotted lines are for X(1)=Y(1).
(a) (b)
Figure 11: Profile for adsorbed mole fraction of propane (a) and the amount adsorbed (b) as functions of the gas mole fraction of methane for the methane(1)-ethane(2)-propane(3) ternary mixture on Silicalite S-115 at
345 kPa and 300 K and at a fixed ratio of Y(2)/Y(3) = 2.77. Straight dotted line is for X(1)=Y(1).
Methane(1)-Ethane(2)-n-Butane(3) at 345 kPa and 300 K
Results of this ternary system are presented in Figures 12 and 13. The average deviations of the adsorbed mole fraction (X(i)%) of each component are determined to be 6.2, 6.5, and 12.7% respectively. The average relative deviation as a
function of amount adsorbed (NadsR %) is calculated
as 16.7%. Figures 12 and 13 show the adsorbed mole fraction of every component and the amount of
(a) (b)
Figure 12: Profile for adsorbed mole fraction of methane (a) and ethane (b) as functions of the gas mole fraction of methane for the methane(1)-ethane(2)-n-butane(3) ternary mixture on Silicalite S-115 at 345
kPa and 300 K and at a fixed ratio of Y(2)/Y(3) = 3.76. Straight dotted lines are for X(1)=Y(1).
(a)
(b)
Figure 13: Profile for adsorbed mole fraction of n-butane (a) and the amount adsorbed (b) as functions of the gas mole fraction of methane for the methane(1)-ethane(2)-n-butane(3) ternary mixture on Silicalite S-115 at 345
kPa 300 K and at a fixed ratio of Y(2)/Y(3) = 3.76. Straight dotted line is for X(1)=Y(1).
Methane(1)-Propane(2)-n-Butane(3) at 345 kPa and 300 K
The adsorbed mole fraction of each component and the amount of mixture adsorbed as a function of gas mole fraction of methane are presented in Figures 14 and 15. In this case, the ratio Y(2)/Y(3) is fixed at 1.27. The average relative deviation of the
amount adsorbed (NadsR %) is calculated as 5.5%,
whereas the average deviations of adsorbed mole
the gas phase, the adsorbed mole fraction of propane is smaller than in the gas phase. An increase in the gas mole fraction of methane to values higher than approximately 0.60 inverts the selectivity. The simulations predict this phenomenon very well. For
n-butane, the experimental data shows that the adsorbed mole fraction of n-butane is larger than its gas mole fraction for every composition of methane in the gas phase (Figure 15). The simulations also predict this phenomenon.
(a) (b)
Figure 14: Profile for adsorbed mole fraction profile of methane (a) and propane (b) as functions of the gas mole fraction of methane for the methane(1)-propane(2)-n-butane(3) ternary mixture on Silicalite S-115 at 345 kPa
and 300 K and at a fixed ratio of Y(2)/Y(3) = 1.27. Straight dotted lines are for X(1)=Y(1).
(a)
(b)Figure 15: Profile for adsorbed mole fraction profile of n-butane (a) and the amount adsorbed (b) as functions of the gas mole fraction of methane for the methane(1)-propane(2)-n-butane(3) ternary mixture on Silicalite S-115
Quaternary Mixtures
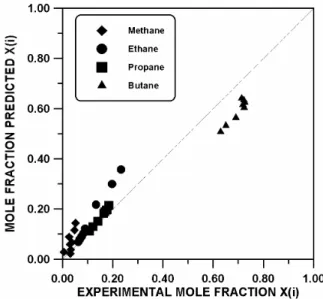
Figure 16 shows a comparison between experimental and calculated values of mole fraction of each component adsorbed on Silicalite S-115 for different vapor compositions. The average deviations of adsorbed mole fraction
( X(i)% ) of each component are determined to be 4.1 (methane), 4.9 (ethane), 1.8 (propane), and 10.5% (n-butane). For this quaternary mixture, the average relative deviation of amount adsorbed (NRads%) is calculated as 4.5 %. In general, the simulations are in good agreement with the experimental data.
Figure 16: Quaternary mixture of methane(1)-ethane(2)-propane(3)-n-butane(4) adsorbed on Silicalite S-115 at 300 K; data of Abdul-Rehman et al. (1990).
CONCLUSIONS
In this work, we used the methodology proposed by Cabral et al. (2003) for correlating the adsorption of pure components and for predicting the adsorption of binary, ternary, and quaternary mixtures on Silicalite S-115. This methodology uses the Monte Carlo algorithm for a grand canonical ensemble as an equation of state for the adsorbed phase.
In the case of pure components, the simulations correlated the experimental data on methane, ethane, propane, and n-butane adsorbed on Silicalite S-115 at 300 K very well. In the case of the adsorption of multicomponent mixtures, the simulations showed good agreement with the experimental data. In these predictions we used solid structure information on the absorbent to obtain insights into the macroscopic behavior of the systems studied. In the near future, this kind of strategy can become a common “workhorse” for calculating thermodynamic properties for engineering applications, due to progress in computer science and in hardware technology.
ACKNOWLEDGMENTS
The authors acknowledge the financial support of the Brazilian agencies CNPq and FAPERJ.
REFERENCES
Abdul-Rehman, H. B., Hasanain, M. A., and Loughlin, K. F., Molecular Simulations of Adsorption Isotherms for Linear and Branched Alkanes and their Mixtures in Silicalite, Industrial & Engineering Chemistry Research, 29, No. 7, 1525 (1990). Allen, M. P. and Tildesley, D. J., Computer Simulation
of Liquids. Oxford University Press, Oxford (1987). Bulnes, F., Ramirez-Pastor, A. J., and Pereyra, V. D.,
Study of Adsorption of Binary Mixtures on Disordered Substrates, Journal of Molecular Catalysis A: Chemical, 167, No. 1-2, 129 (2001). Cabral, V. F., Tavares, F. W., and Castier, M., Monte
Gill, P. E., Murray, W., and Wright, M., Practical Optimization. Academic Press, New York (1981). Grant, R. J. and Manes, M., Adsorption of Binary
Hydrocarbon Gas Mixtures on Activated Carbon, Industrial & Engineering Chemistry Fundamentals, 5, No. 4, 490 (1966).
Hill, T. L., Introduction to Statistical Thermodynamics. Addison-Wesley, London (1960).
Hoory, S. E. and Prausnitz, J. M., Monolayer Adsorption of Gas Mixture on Homogeneous and Heterogeneous Solids, Chemical Engineering Science, 22, No. 7, 1025 (1967).
Langmuir, I., The Adsorption of Gases on Plane Surfaces of Glass, Mica and Platinum, Journal of the American Chemical Society, 40, No. 9, 1361 (1918).
Macedonia, M. D., and Maginn, E. J., Pure and Binary Component Sorption Equilibria of Light Hydrocarbons in the Zeolite Silicalite from Grand Canonical Monte Carlo Simulations, Fluid Phase Equilibria, 160, 19 (1999).
Myers, A. L. and Prausnitz, J. M., Thermodynamics of Mixed-Gas Adsorption, AIChE Journal, 11, No. 1, 121 (1965).
Nelder, J. A. and Mead, R., A Simplex-Method for Function Minimization, Computer Journal, 7, No. 4, 308 (1965).
Press, W. H., Teukolsky, S. A., Vetterling W. T., and Fiannery, B. P., Numerical Recipes in Fortran – The Art of Scientific Computing. Cambridge
University Press, Cambridge (1992).
Ramirez-Pastor, A. J., Nazzarro, M. S., Riccardo, J. L., and Zgrablich, G., Dimer Physisorption on Heterogeneous Substrates, Surface Science, 341, 249 (1995).
Ramirez-Pastor, A. J., Pereyra, V. D., and Riccardo, J. L., Adsorption of Linear k-mers on Heterogeneous Surfaces with Simple Topographies, Langmuir, 16, No. 2, 682 (2000). Romanielo, L. R., Adsorção de Gases
Multicomponentes, M. Sc. Thesis, Federal University of Rio de Janeiro, Brazil (1991).
Steele, W., Computer Simulations of Physical Adsorption: A Historical Review, Applied Surface Science, 196, No. 2, (2002).
Suwanayuen, S. and Danner, R. P., A Gas Adsorption Isotherm Equation Based on Vacancy Solution Theory, AIChE Journal, 26, No. 1, 68 (1980a).
Suwanayuen, S. and Danner, R. P., Vacancy Solution Theory of Adsorption from Gas Mixtures, AIChE Journal, 26, No. 1, 76 (1980b). Valenzuela, D. P., Myers, A. L, Talu, O., and
Zwiebel, I., Adsorption of Gas-Mixtures-Effect of Energetic Heterogeneity, AIChE Journal, 34, No. 3, 397 (1988).