INTRODUCTION
Measuring temperature accurately is extremely important in different processes in the chemical, manufacturing, food, automotive, aeronautical, and other industries. The materials used for this purpose are called temperature sensors or thermistors. Known sensors such as thermocouples are metallic and, depending on the different metals that are formed, they measure variations in temperature in the range of + -270 to +2300 oC [1, 2]. Another example of a metal sensor is platinum, which measures temperatures in the range of -260 to +1060 oC. In the class of ceramics [3], measured variations range from -50 to +1200 oCand in integrated circuits [4]from -50 to +150 oC. The physical parameter of variation as a function of temperature differs among different classes of materials, and changes have been found, for example, in thermocouple voltages, in platinum resistors, in ceramics, and in the voltage or current of integrated circuits [4]. Although the dependence of electrical resistance on temperature is common in platinum and ceramics, this property increases in platinum according to temperature, while in ceramics it may increase or decrease.
When the electrical resistance decreases, ceramics are classiied as NTC type (Negative Temperature Coeficient), whereas when the resistance increases with temperature, they are classiied as PTC type (Positive Temperature Coeficient) [3].
The precision of thermocouples ranges from ±0.5 to ±5 oC, while that of integrated circuit sensors is lower, i.e., ±1 oC. In platinum and NTC thermistors, this precision is much higher, i.e., from ±0.001 to ±1 oC, but the response time of ceramic thermistors, which ranges from 0.1 to 10 s, is signiicantly faster than that of platinum, which may vary from 1 to 50 s. For this reason, ceramic thermistors are considered to be fast response thermistors while platinum ones are considered slow response thermistors [5]. The temperature coeficient of the NTC thermistor, α, which provides the percent variation of electrical resistance/oC, is also much higher than that of platinum, -2%/oC to -4%/oC compared to ~0.4%/oC in platinum [6]. On the other hand, the operating range of NTC thermistors is much narrower than that of platinum, since the latter exhibits a wide variation in resistance within a narrow temperature interval, so that their compositions must be designed for speciic desired
Construction and testing of a system for the electrical characterization of
ceramic thermistors at low temperatures
(Construção e teste de um sistema para caracterização elétrica de
termistores cerâmicos em baixas temperaturas)
F. C. S. Luz1, S. A. Pianaro1, C. E. Yurk1, G. Capobianco, A. J. Zara1, S. M. Tebcherani2
1Department of Materials Engineering, 2Department of Chemistry
Interdisciplinary Laboratory of Ceramic Materials, State University of Ponta Grossa – UEPG, 84030-900 Ponta Grossa, PR, Brazil
Abstract
A high-precision and low cost system was built for the electrical characterization of ceramic thermistors at low temperatures, using components readily available in materials research laboratories. The system presented excellent reproducibility in the electrical
characterization of NTC ceramic sensors from -75 oC (195 K) to 23 oC (296 K). The behavior of the NTC sensor was comparable to
that of commercial thermistors only below room temperature (α = -3.2%/K), demonstrating the importance of fully characterizing these materials at both low and high temperatures.
Keywords: electrical characterization, low temperature system, temperature sensor.
Resumo
Um sistema de alta precisão e baixo custo foi construído para a caracterização elétrica de termistores cerâmicos em baixas temperaturas, usando componentes facilmente disponíveis em laboratórios de pesquisa de materiais. O sistema apresentou excelente
reprodutibilidade na caracterização elétrica de sensores cerâmicos NTC de -75 oC (195 K) a 23 oC (296 K). O comportamento do
sensor NTC foi comparável aos termistores comerciais somente abaixo da temperature ambiente (α = -3,2%/K), demonstrando a
importância da caracterização completa destes materiais tanto em altas quanto em baixas temperaturas.
temperature intervals.
The majority of commercial ceramic thermistors are manufactured from compositions based on transition metal oxides of the NiO-MnO2-CuO-CoO system [5, 7].The electrical conductivity of these semiconductor ceramics is attributed to electron hopping between species in the structure [8]. For example, in the inverse spinel structure with the general formula B3+[A2+B3+]O
4, electron hopping occurs between the A2+ and B3+ ions in tetrahedral site (represented between brackets). This characteristic of NTC type thermistors based on spinel structures occurs when the electrons move to the conduction band through temperature activation [6] reducing the electrical resistance (R) according to equation A:
R(T) = R∞e (A)
where R∞ is approximately independent on temperature and b is the thermistor constant (activation energy divided by Boltzmann constant). This constant can be expressed as follows:
b= In R11 - In R2 T1
1 T2
(B)
where R1 and R2are the electrical resistivities measured at T1 and T2, respectively. From expression B, it can be concluded that the higher is the value of b, the better its temperature coeficient will be, i.e., the greater the thermistor’s sensitivity to temperature variations will be. The typical values of b of commercial spinel type structure NTC thermistors range from 2.000 to 5.000 K-1 [5] and in other thermistors, considered of high temperature, these values range from 15.000 to 18.000 K-1 [1-6].
The temperature coeficient α, or the sensor’s sensitivity parameter [5, 6], can be determined by equation C:
α=1 =
R dR
dT Tb2 (C)
The coeficient α provides the measure of sensitivity of the sensor to a given temperature. If α is high, more charge carriers are generated with the same increase in temperature when compared with lower α. Due to the inverse relationship with the square root of absolute temperature, this coeficient is not uniform; therefore, it presents narrower ranges of high sensitivity activation.
Normally, thermistors are characterized electrically from above room temperature up to around 300 oC. To this end, very eficient sample holders have been developed for electrical characterization in direct and alternating current [9, 10]. The lack of knowledge about electrical properties at low temperatures causes many compositions to be discarded for not presenting satisfactory properties. This is due to
the dificulty in setting up systems for characterization at low temperatures. Commercial sensors for cryogenic temperatures include various types of resistors, capacitors, thermocouples and junction semiconductor devices such as diodes and transistors, and the selection of a speciic sensor for a given speciic application depends on the required conditions of precision of the measurement and the environment [2]. Measuring devices with good precision at low temperatures have already been developed, but these devices are highly complex and are fabricated from components that are not readily available [11-13]. In an attempt to extend the range of electrical characterization of these materials, this study aimed to assemble and test a system for high-precision electrical measurements at low temperatures, using components that cost little and are readily available in research laboratories of materials.
EXPERIMENTAL
Assembly of the electrical measurement system and simulation of the temperature gradient
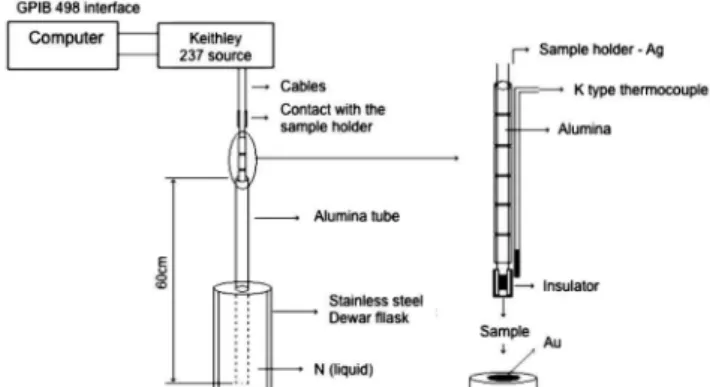
Fig. 1 shows the design of the low temperature measuring system, which comprises: a stainless steel dewar lask, alumina tube, silver wire sample holder coated with alumina beads, K type thermocouple, and Keithley 237 high-voltage source coupled to a PC via GPIB 498 interface.
The dewar lask was illed with liquid nitrogen up to ¾ of its volume. The alumina tube was then immersed in it and held there for 30 min to ensure temperature equilibrium. The volume of nitrogen was monitored continually to ensure that it remained constant, due to its evaporation.
Previously, in order to determine the temperature gradient along the alumina tube immersed in liquid nitrogen, a computer simulation was conducted using ANSYS software, considering the following parameters: the thermal conductivity of the alumina, the boiling point of the liquid nitrogen (-199 ºC), to verify that the temperature and pressure conditions at a distance equal to approximately two diameters of the steel dewar lask were 22 ºC and 1
Figure 1: Schematic representation of the low temperature electrical measurement system.
bar, and to ensure that no mass exchange occurred in the system. The results provided input for the assembly of the experimental apparatus, providing important information on the temperature gradient of the alumina tube immersed in liquid nitrogen, along a distance of 60 cm.
Details of the sample holder
The sample holder illustrated in Fig. 2 is composed of two silver wires and two rings of the same material with a thickness of 2 mm and diameter of 13 mm, which were welded to the ends of the wires. These wires were coated with alumina beads having two holes to give the set the necessary rigidity. A cold-junction K type thermocouple was connected to this system, whose its end was positioned as close as possible to the sample.
Preparation of the sample and electrical measurement conditions
The surfaces of the samples were ground and gold electrodes were deposited on them via sputtering. They were then ixed to the sample holder by encapsulation with a self-curable polymeric insulator. After the set was mounted, it was immersed inside the alumina tube containing liquid nitrogen and the cables of the voltage source were connected to the terminals of the sample holder. The voltage/current as a function of temperature was then measured by moving the sample holder upwards over a distance of 60 cm inside the alumina tube, i.e., from the region of lowest temperature to the highest, considering the temperature gradient along the
tube (note that a large part of the tube remains outside the liquid nitrogen bath). Thus, with this set, it was possible to take electrical measurements ranging from -90 oC to room temperature. The electrical measurements at temperatures above room temperature were performed in another sample holder already developed [9].
V x I measurements were taken as a function of temperature, using the programmable Keithley 237 voltage source. The voltage varied from 0 to 50 V, with a time interval of 0.1 s between measurements. The set was tested using a ceramic thermistor with NTC properties developed in our laboratory.
RESULTS AND DISCUSSION
Fig. 2a illustrates the model of the dewar lask + alumina tube system considered for the simulation. Fig. 2b shows the result of the simulation of the system containing liquid nitrogen. The color gradient shows the temperature ranges that were obtained inside the alumina tube as the sample holder was raised (black color, minimum temperature -199 oC, dark grey color, maximum temperature 22 oC). With this simulation, it was possible to predict the range of regions with negative and positive temperatures as a function of the distance along the tube.
The system was tested experimentally by introducing the sample holder into the alumina tube up to the region of the temperature of interest. In this experiment, temperature measurements were taken from -75 oC (195 K) to 23 oC (296 K), using the low-temperature sample holder. Measurements above 23 oC and up to 255 oC (528 K) were taken using another sample holder developed for high temperatures [9]. Thus, a broad range of temperature was measured to characterize the thermistor.
Conventionally, measurements of the electrical behavior of ceramic thermistors as a function of temperature are done by applying a constant voltage on a 5 V sample, for example, and taking pointwise measurements of the current for each value of temperature. The electrical resistance value is calculated and the R (electrical resistance) x T (temperature) plots are built considering Ohm’s law, V = I R. The problem with this methodology is that minor temperature oscillations can lead to incorrect current values, impairing the quality of the experiment, since the measurements are taken pointwise. In order to minimize such experimental errors, more precise method of measurement was used in this work, i.e., a programmable Keithley voltage source, which provided highly accurate measurements of voltage x current, at intervals of tenths of seconds (delay time). Considering that the scanning voltage applied to the sample was 0 to 50 V and that each point was obtained at voltage intervals of 2 at 2 V, with a delay time of 0.1 s, the total time to obtain each curve was 2.5 s. A linear regression was made from these points, using the Origin version 7.0 software program, and the angular coeficient obtained corresponded to the electrical resistance of the ceramic thermistor.
Fig. 3 shows the graph of the current - voltage Figure 2: (a) Model of the alumina tube and the stainless steel dewar
lask. (b) result of the simulation with temperature scale, minimum
temperature -199 oC (black color), maximum temperature 22 oC
(dark grey color).
[Figura 2: (a) Modelo do tubo de alumina e do frasco “dewar” de aço inoxidável. (b) Resultado da simulação com a escala de temperatura, - 199 oC temperatura mínima (cor preta), 22 oC
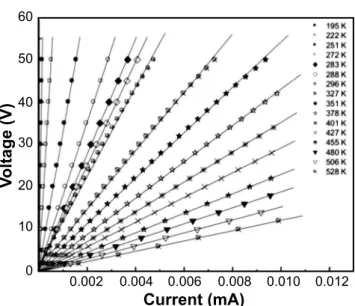
measurements of a NTC thermistor developed in our laboratory. These measurements were taken for temperatures varying from -75 oC (198 K) to 255 oC (528 K).
To ascertain the reproducibility of the measurements, a thermal cycle was performed to check if hysteresis was formed between measurements, whose curve is depicted in Fig. 4.
Excellent reproducibility between measurements was achieved. Nevertheless, a small deviation occurred as the voltage was increased, which caused a slight difference in the calculated values of resistance, which were 17.312 kΩ and 16.878 kΩ and corresponded, respectively, to the measurements taken before and after the thermal cycle. However, the difference between the resistances was only 2.5%, thus lying within the parameters of acceptable error in experimental measurements. Table I lists the values of electrical resistance and the linear correlation coeficient R, for the different temperatures.
A highly linear behavior was found at all the temperatures studied, i.e., the ceramic presented purely ohmic behavior, characterizing the excellent linear correlation between the points on the line. Using the values of resistance (R) for each particular temperature (T), a graph characteristic of NTC type thermistors was built and is presented in Fig. 5.
From the region of low temperature (195 K) to room temperature (296 K), the variation of the electrical resistance of the ceramic was 342.626 kΩ. On the other hand, from room temperature up to 528 K, this variation was only 9.310 kΩ, indicating the greater sensitivity of the sensor in the low
temperature range. Applying ln to both sides of equation A and building the graph of R x 1/T (T in K) shown in Fig. 6, two straight lines were drawn by linear regression of the
Temperature
(K) resistance (kΩ)Electrical R
195 353.148 0.9996
222 95.502 0.9997
251 32.082 0.9998
272 17.311 0.9998
283 288 296 327 351 378 401 427 455 480 506 528
13.572 12.241 10.522 6.894 5.357 4.280 3.512 2.913 2.295 1.884 1.527 1.212
0.9998 0.9998 0.9989 0.9994 0.9997 0.9999 0.9999 1.0000 1.0000 1.0000 1.0000 1.0000 Figure 4: Voltage-current measurements taken at the temperature of 272 K, showing the reproducibility between the measurements of the same sample after applying a thermal cycle. R is the linear correlation coeficient between the points of the curve.
[Figura 4: Medidas tensão-corrente obtidas na temperatura de
272 K, mostrando a reprodutibilidade entre as medidas da mesma amostra após realização de ciclagem térmica. R é o coeiciente de correlação linear entre os pontos da curva.]
60
50
40
30
20
10
0
0.0005 0.0015 0.0025
Current (mA)
V
oltage (V)
0.0010 0.0020 0.0030
Figure 3: V x I curves obtained at different temperatures under the following conditions: variation of the applied voltage of 0 – 50 V for intervals of 2 at 2 V, with a delay time of 0.1 s. The solid lines correspond to the linear regression of the points for each speciic temperature.
[Figura 3: Curvas V x I obtidas em diferentes temperaturas sob as seguintes condições: variação da tensão aplicada de 0 a 50 V para intervalos de 2 em 2V, com um tempo de atraso de 0,1 s. As linhas sólidas correspondem a regressão linear dos pontos para
cada temperatura especíica.] 60
50
40
30
20
10
0
0.002
Current (mA)
V
oltage (V)
0.006 0.010
0.004 0.008 0.012
Table I - Values of electrical resistance of the thermistor at different temperatures and linear correlation coeficient R of the data points.
[Tabela I - Valores da resistência elétrica do termistor em
points, one corresponding to the low temperature range and the other to the higher temperature range. The values of the b constants of the thermistor in each range were then calculated from the respective angular coeficients of the straight lines, and were found to be equal to 2022 K-1 and 1445 K-1, respectively, for low and high temperature ranges. The activation energy Ea for electron transport was calculated from the values of b and equation D, knowing that:
b = Ea
k (D)
where k is Boltzmann constant. Considering the two slopes observed in Fig. 6, two values of activation energy were calculated, one corresponding to low temperatures (198 to
296 K) and the other to higher temperatures (323 to 523 K), with the values of Ea equal to 0.12 and 0.17 eV , respectively.
The percentage of negative variation in the sensor’s electrical resistance to each one-degree increment in temperature, known as parameter α of the NTC thermistor (-%dR/K), expresses its sensitivity. This coeficient can be considered as the thermistor’s quality factor, since higher values of α will result in more accurate temperature measurements. Fig. 6 shows that two slopes were obtained; in this case, the temperature adopted should lie within the region of validity of the thermistor equation. A temperature of 251 K was adopted for the region below room temperature, while 427 K was adopted for the region above room temperature, resulting in values of α equal to -0.032 and -0.008, i.e., the variation of resistance as a function of temperature was -3.2%/K below room temperature and only -0.8%/K above room temperature.
Commercial NTC thermistors have values of α between 3 and 4% at close to room temperature and values of b between 3000 and 4000 K-1. In the thermistor under study, it was found that good electrical properties typical of NTC thermistors were characterized only below ambient temperature, since the value of 3.2% obtained for coeficient α lies within the range in which commercial thermistors are used. On the other hand, at temperatures above room temperature, due to the low value of α (-0.8%), its application is compromised. This illustrates the importance of electrically characterizing these materials also at lower temperatures, since many ceramic thermistor compositions may have speciic applications, as in refrigerated chambers, for example, and are discarded because they are inadequately characterized.
CONCLUSION
The electrical measuring system built here allowed for highly accurate and reproducible measurements to be taken at temperatures close to that of liquid nitrogen. Furthermore, the system is inexpensive and easy to build, since it is made of components that are readily available in materials research laboratories. The NTC type temperature sensor tested here showed optimal characteristics only for temperatures below room temperature, reinforcing the importance of characterizing these materials completely at temperatures below and above room temperature, since many speciic low temperature applications may be suggested for these materials.
ACKNOWLEDGEMENTS
The authors thank the Brazilian research funding agencies CNPq, CAPES and Fundação Araucária for their inancial support.
REFERENCES
[1] T. D. McGee, “Principles and Methods of Temperature
Figure 5:R(kΩ) x T(K) curve of a typical NTC sensor developed
in our laboratory and used to test the sample holder of this work.
[Figura 5: Curva R(kΩ) x T(K) de um sensor NTC típico
desenvolvido em nosso laboratório e utilizado para testar o porta
amostra deste trabalho.] 400000
300000
200000
100000
0 350000
250000
150000
50000
150
Temperature (K)
Resistance (k
W
)
350
250 450 550
200 300 400 500
Figure 6: ln R x 1/T with two slopes resulting in different values
of b for the range of 195 to 296 K (2022 K-1)and of 296 to 528K
(1445 K-1).
[Figura 6: ln R x 1/T com duas inclinações resultando em diferentes valores de b de 195 a 296 K (2022 K-1) e de 296 to 528 K (1445 K-1).]
13
12
11
10
9
8
0.0015
1/T (k-1)
In R
0.0035 0.0055
Measurement”, Wiley-IEEE, New York (1988) pp. 45-60. [2] J. Shieh, J. E. Huber, N. A. Fleck, M. F. Ashby, Progr. Mater. Sci. 46 (2001) 461.
[3] R. C. Buchanan, “Ceramic Material for Electronics. Processing, Properties, and Applications”, Marcel Dekker, Inc., New York, (1986) pp. 35-47
[4] L. Michalsky, K. Eckersdorf, J. McGhee, “Temperature Measurement”, Wiley Publ. (2001).
[5] A. Feteira, J. Am. Ceram. Soc.92 (2009) 967. [6] N. Ichinose, “Introduction to Fine Ceramics”, John Wiley & Sons, New York (1987) pp. 90-92.
[7] A. J. Moulson, J. M. Herbert, “Electroceramics:
Materials, Properties Applications”, John Wiley & Sons, England (2003) pp. 50-63.
[8] E. J. W. Verwey, P. W. Haayman, Physica 8 (1941) 979. [9] E. C. Pereira, S. A. Pianaro, E. Almeida, L. O. S. Bulhões, E. Longo, J. A. Varela, Química Nova 18 (1995) 301. [10] M. C. Steil, F. C. Fonseca, Y. V. França, J. F. Q. Rey, E. N. S. Muccillo, R. Muccillo, Cerâmica 48 (2002) 146. [11] B. Bireckoven, J. Wittig, J. Phys. E: Instrum. 21 (1988) 841.
[12] M. Fouaidy, N. Hammoudi, Physica C 441 (2006) 137. [13] Y. Melman, S. Baltianski, Y. Tsur, Instrum. Sci. Techn. 33 (2005) 279.