313
Abstract
Urban growth around mining areas has brought problems such as neighbor-hood’s discomfort due to blasting vibrations, which can cause structural damage to the houses, dust and atmospheric overpressure. In Brazil, environmental restrictions are increasingly rigorous and seismic monitoring is required as an environmental con-trol measure. This study aims to analyze a methodology for application of iso-velocity maps in quarries located in urban areas and evaluate options for building iso-velocity maps. This work was performed in a quarry located in the State of São Paulo and four blastings were monitored. All blastings had similar features and they were evaluated in the same bench. For each equation, directional, scaled-distance parameters were es-timated and different iso-velocity maps were made and compared. It is concluded that geophone disposition must adjust to the monitoring purposes. Eight to ifteen aligned geophones are adequate for a scaled-distance curve. Sixty-four or more geophones, spatially and homogeneously distributed, can generate an iso-velocity map concerning a single blasting. High variability of rock mass features seems to prevent obtaining good results when the seismographs are not homogeneously distributed surrounding the blasting.
Keywords: Iso-velocity map, environmental control, scaled-distance equations, ground vibrations, seismic monitoring.
Giselle Ramirez Canedo
Professora Doutora Universidade Federal do ABC São Paulo – São Paulo - Brazil [email protected]
Sérgio Médici de Eston
Professor titular,
Universidade de São Paulo,
Departamento de Engenharia de Minas, São Paulo – São Paulo - Brazil [email protected]
Wilson Siguemasa Iramina
Professor associado Universidade de São Paulo
Departamento de Engenharia de Minas São Paulo – São Paulo - Brazil [email protected]
Michiel Wichers Schrage
Professor Assistente
Universidade Federal de Alfenas Alfenas – Minas Gerais – Brazil [email protected]
Iso-velocity maps. A vibration
control tool in quarries
Mining
Mineração
1. Introduction
http://dx.doi.org/10.1590/0370-44672014680163
In the past, mining areas were gener-ally located far from urban conglomera-tions. However, over the years the occupa-tion of new locaoccupa-tions has been required, resulting in daily coexistence between city inhabitants and the mining area.
Urban growth around mining areas has led to new problems due to discom-fort that may be caused to the neighbor-hood and structural damage resulting from propagation of terrain vibrations, atmospheric overpressure and ly rocks. Dispersion of particulate matter may also occur (Bacci et al., 2006).
There are regulations limiting vibra-tion and noise levels in order to protect the
neighborhood and such environmental restrictions are becoming more rigorous (Bacci et al., 2003). Seismic monitoring
is increasingly required to aid in legal dis-putes between mining companies and the population. In this context, seismic moni-toring aims to improve blasting perfor-mance regarding costs and productivity, as well as to help attenuate environmental effects and reduce social conlicts.
Geosonics Inc. (Rudenko, 1998; Froedge, 1990 and Froedge et al, 1994) was
the irst company to use the methodology of iso-velocity maps. More than a hundred of triaxial sensors may be positioned around a blasting site and the effect of an explosive
charge is tracked as the vibration wave moves away from the site. Iramina (2002) developed a hybrid method with eight scaled-distance equations simulating an iso-velocity map.
Multidirectional trends of vibrations propagation related to a single blasting can be detected using the iso-velocity map (Khaled et al., 2007). It compares favorably
with measurements using only one or two seismographs, which is the usual practice in most quarries and mining areas in Bra-zilian urban areas.
This study aims to analyze a method-ology for application of iso-velocity maps in quarries located in urban areas and evalu-ate options for building iso-velocity maps.
2. Materials and methods
In this study, four blastings were monitored, each one of them with four different directions selected, using a total of 20 SSU 3000EZ+ and SSU
3000LC seismographs. All blastings were evaluated in the same bench, presenting similar blasting plans. For each equation, the directional,
scaled-distance parameters were estimated and different iso-velocity maps were generated and compared.
314
activation at a lower sensitivity limit (trigger) between 0.18 and 5 mm/s de-pending on the proximity to the blast-ing site and considerblast-ing the possibility
of activation by any other event, like a passing truck. Record time was set between 5 and 7 seconds, according to ISEE’s recommendations (2009).
The blasting distribution in the bench and the location of monitored points are presented in Figure 1.
7410800
7410600
7410400
7410200
7410000
7409800
7409600
323000 323200 323400 323600 323800 324000 324200 324400 324600
Legend Blasting 1 Blasting 2 Blasting 3 Blasting 4
Figure 1
Blasting distribution
and location of monitored points
3. Results and discussions.
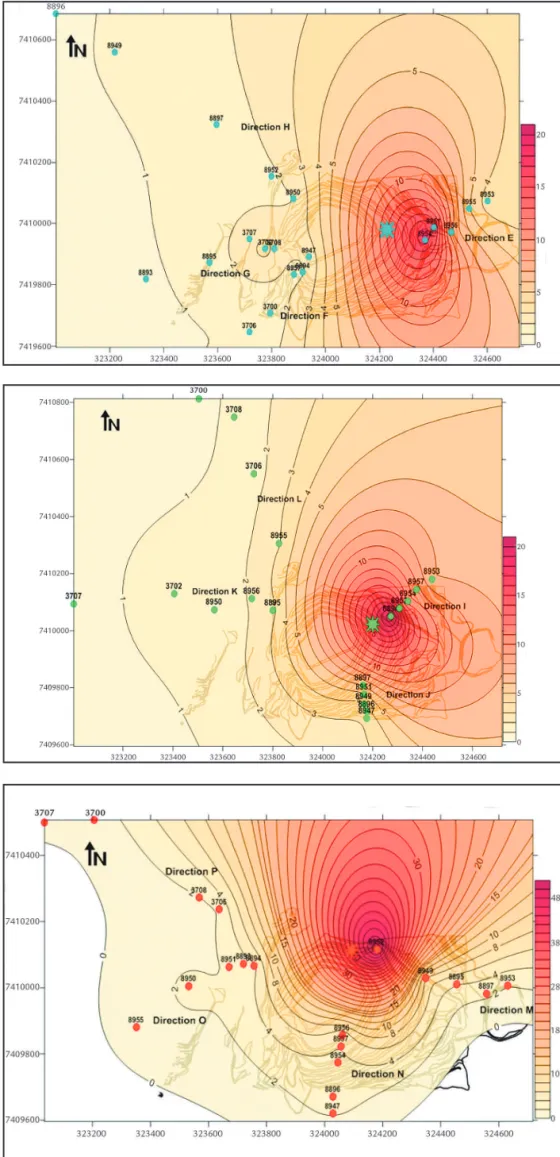
Iso-velocity maps were generated for each one of four collected blastings using PPV values and the location of monitored points (Figures 2 to 5). Surfer 8.0, a pro-gram from Golden Software, was used to create grid-based maps from irregularly spaced values (XY or XYZ data iles) into an evenly-spaced grid one. The gridding method used was Kriging, a geostatistical gridding method that can express vibra-tion trends in an accurate way (Golden Software, 2011).
It is worth noting the dificulty in placing the geophones in ideal position, i.e., ive per line in 4 orthogonal directions.
As observed in Figure 4, while a line distribution was visually obtained in one of the directions, its (line) orthogonality compared to the others was not reached.
In other situations, both linearity and orthogonality were deeply compro-mised, as shown in Figures 3 and 5.
The greatest practical dificulties for ideal location resulted from access and
topography issues.
It can be concluded that attenuations strongly depend on topography variations, lithology, positioning in the bench and blasting site.
While during the early days, Geo-sonics’ maps used approximately 100 geo-phones, currently this number is as high as 150 geophones. This quantity of points may possibly increase the interpolations’ precision and map similarity, since using only 20 geophones yields diverging results.
Figure 2
315 Figure 3
Second blasting’s Iso-velocity Map
Figure 4 Third blasting’s Iso-velocity Map
316
3.1 Maps simulating Iramina’s methodology (2002).
Iramina (2002) developed a meth-odology based on a hybrid model apply-ing the velocity vs. scaled-distance equa-tions and the iso-velocity map concepts. There was an equipment limitation in order to generate a map based on the Geosonics model because it would have required the installation of at least one hundred sensors to obtain a good ap-proximation for the ground vibration behavior in all directions. In fact, there was the availability of up to eight seismo-graphs for monitoring. Eight blasts were monitored in similar conditions, and for each blast, up to eight geophones (points) were aligned towards the direction of one of the eight sectors surrounding the quarry. The results were eight equations representing vibrational behavior. These points were then plotted in a map using computer programs that interpolated
and generated new waypoints of values. The result was the generation of a graphi-cal tool with the same functionality of a true iso-velocity map that uses only eight geophones instead of more than a hundred.
The values of coeficients k and b for each of the scaled-distance equations (Table 1) and their correlating coefi-cients were estimated by using the values of peak particle velocity (PPV) recorded by the seismographs, distances among monitored points, blasting sites and the maximum charge weights per delay. Using a regression model, k and b can be obtained by a plotting line in log-log paper and the value of k is given by the intercept of the vertical axis, while the constant b is given by the slope of the curve. Both coeficients are site speciic and therefore represent local geological
rock mass characteristics.
The correlating coeficients varied from 0.72 to 0.99. Values higher than 0.80 can be considered satisfactory, and those higher than 0.90 are good. Thir-teen out of 16 values are higher than 0.8 and 9 values are higher than 0.9. Jimeno
et al. (1995) stated that 8 points would
be an appropriate number, and that 5 points seem not to be enough for a reli-able scaled-distance curve.
Average lines were plotted in each one of the directions monitored from a common origin, and 50 m apart points were generated on these lines following the determination of scaled-distance curves’ coeficients. PPV values were then recalculated in these points us-ing scaled-distance equations of each one of the directions, as proposed by Iramina (2002).
Direction Equation Coefficient of correlation
A y = 650.01 x -1.488 0.90
B y = 12681 x -2.445 0.99
C y = 1958.6 x -1.702 0.72
D y = 53.304 x -0.874 0.85
E y = 1651.7 x -1.697 0.98
F y = 71.455 x -1.018 0.93
G y = 1683.7 x -1.676 0.90
H y = 25.172 x -0.691 0.82
I y = 90.484 x -0.757 0.98
J y = 492.76 x -1.436 0.87
K y = 3768.6 x -1.906 0.73
L y = 2685 x -1.75 0.90
M y = 1805.6 x -1.688 0.99
N y = 83.056 x -0.893 0.76
O y = 386.94 x -1.324 0.80
P y = 3395.1 x -1.882 0.95 Table 1
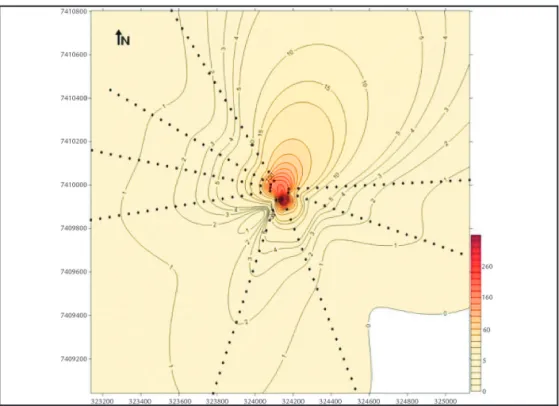
317 Then, iso-velocity maps with 8
directions were generated (Figures 6
and 7), selecting two directions per map quadrant.
Figure 6 Iso-velocity Map with a combination
of directions C, D, E, F, H, I, J and O
One can notice that maps made with points distributed in octants allow a better interpolation, although Figure 6 still shows a region with no sequence of iso-lines.
Figure 7 presents a better iso-line distribution in spite of considering the presence of a quadrant with no
moni-tored point.
Map quality requires at least 8 points in every direction, i.e., iso-velocity maps must be created by collecting a minimum of 64 points.
Iso-velocity map usefulness de-pends on its reliability, which strongly depends on mathematical interpolation.
Therefore, interpolation quality strongly depends on the number of collection points and their spatial distribution. Again, for the purpose of this study, Kriging gridding has proven to be useful by generating visually appealing maps from the irregularly and not so numerous spaced data set.
Figure 7 Iso-velocity Map with a combination of directions A, B, G, K, L, M, N and P
Geosonics Inc. has started mak-ing maps with 100 points and cur-rently uses 150 (or more) points. This study demonstrates the real need for
approximately a hundred points for a quality-bearing map. However, using a hundred geophones demands a high budget for application and equipment
318
Main conclusions may be stated here. Scaled-distance curves must be ob-tained using 8 or more geophones. Their correct alignment yields better correlation and a value higher than 0.9 means that the resulting line is well it to analyze the attenuation of vibrations through the rock mass. Eight geophones provide an accept-able result, i.e., 20, 30 or 40 geophones are not required.
Iso-velocity maps must be built for a single blasting, using several geophones. The minimum acceptable quantity is ap-proximately 64 geophones (8 octants, with 8 points per octant).
Iramina’s technique (2002) should work for any kind of topography as long as the seismographs are homoge-neously distributed.
The geographic geophone distribu-tion depends on the collecdistribu-tion purposes. In order to obtain a scaled-distance curve for a speciic direction, 8 to 15 geophones must be positioned with the best pos-sible alignment. In order to obtain an iso-velocity map, at least 64 geophones must be placed in a regular grid. A wide spatial coverage is intended, i.e., no point linearity is aimed.
Care must be taken regarding the
results from mathematical interpolation. Many points within a few zones tend to distort the reality due to effects from the use of a purely mathematical technique. It is preferable to have a smaller number of spatially spread points than many points concentrated in only a few zones.
Iso-velocity maps with about 20 points can give a macro view of the real iso-lines, provided that there is a good spatial distribution. If possible, the maps must be made using more than 64 points, allowing interpolation, in order to provide maps well itted to the rock mass when considering its anisotropy.
5. Acknowledgement
The authors would like to thank the engineers and technicians from Juruaçu
Quarry, for the opportunity and collabo-ration in the development of this research.
6. References
BACCI, D. C., LANDIM, P. M. B., ESTON, S. M., IRAMINA, W. S. Principais normas e recomendações existentes para o controle de vibrações provocadas pelo uso de explosivos em áreas urbanas - Parte II. REM: Rev. Esc. Minas, Ouro Preto, v.56, n.2, Apr./June, 2003.
BACCI, D. C., LANDIM, P. M. B., ESTON, S. M. Aspectos e impactos ambientais de pedreira em área urbana. REM: R. Esc. Minas, Ouro Preto, v.59, n. 1, p. 47-54, jan./mar. 2006.
FROEDGE, D. T. Mapping of vibrations patterns around a blast with the Iso-seismic System. In: SECOND HIGH-TECH SEMINAR. Blasting technology, instrumen-tation, and explosives applications. Orlando, Florida, USA, 1990.
FROEDGE, D. T., GOULD, J., DAVIS, H. Case study of an iso-seismic survey in an East Pennsylvania Quarry. In: EXPLOSIVES 94 CONFERENCE. The Institute of Explosives Engineers. The European Federation of Explosives Engineers. Universi-ty of Leeds, Sept. 1994.
GOLDEN SOFTWARE. Surfer –gridding methods. Available at:
http://www.goldensoftware.com/pdfs/gallery/surfer/S10GriddingMethods.pdf. Ac-cessed: July, 2014.
INTERNATIONAL SOCIETY OF EXPLOSIVE ENGINEERS/ISEE. ISEE Field practice guidelines for blasting seismographs. Cleveland, 2009.
IRAMINA, W. S. O mapa de iso-velocidades como ferramenta de controle ambiental. São Paulo: Escola Politécnica da Universidade de São Paulo, 2002. 223 p. (Ph.D. Thesis).
JIMENO, C. L., JIMENO, E. L., CARCEDO, F. J. A. Drilling and blasting of rocks. London: Taylor & Francis, 1995.
KHALED, M., RAHMAN, K. A., BAGY, E. Safe blasting near the historical caves, Tourah, Cairo Egypt. In: EFEE WORLD CONFERENCE ON EXPLOSIVES AND BLASTING, 4., 2007. Proceedings... Vienna, Austria, v. l, p. 365.
RUDENKO, D. Understanding blast vibrations – a key to gaining control. In: 2nd ANNUAL BLASTING VIBRATION TECHNOLOGY CONFERENCE, 2. Pro-ceedings... Key West, FL, 1998.
Received: 28 August 2014 - Accepted: 20 April 2015