DOI: 10.1590/S1516-14392011005000054
1. Introduction
Several electrode materials (Ti/RuO2, Ti/IrO2, Pt, Ti/PbO2, boron-doped diamond - BDD and Ti/SnO2-Sb) have been used for the electrolytic treatment of effluents containing organic compounds1-11.
Among them, the Ti/SnO2-Sb electrode is reported to present high efficiency for the oxidation of such compounds due to its high oxygen evolution overpotential, which favors the generation of ·OH radicals that act in the indirect oxidation of the organic compounds at the electrode surface2,6,8,12-14.
A number of process for manufacturing dimensionally stable anodes (DSA) have been reported in the literature: sol-gel14,15, spray
pyrolysis16, electrodeposition12,17, thermal decomposition13,18-20 and
precursor solution, known as the Pechini method3,4,20-24. The last one
is useful to prepare electrode films with controlled stoichiometry due to the formation of hydroxicarboxylic acids allied to their ability to form chelates with many cations. When these acids are heated in the presence of polihydroxylic alcohols an esterification reaction takes place and the cations are incorporated in the polymeric net, avoiding metal losses by volatilization during film calcination3.
Oliveira-Souza et al.25 have shown that the Ti/IrO
2 electrode
prepared by the Pechini’s method presented a longer life than those prepared by sol-gel and thermal decomposition methods. Alves1
studied the electrocatalytic properties of Ti/MxS(1-x)O2 dimensionally stable anodes (where M is Ru or Ir; S is Ti or Sn and x is 0.3, 0.5 or
0.7) obtained by the polymeric precursor method (the inorganic precursors were dissolved in isopropanol) for the electrooxidation of ethanol in chloride media. The electrodes prepared by the polymeric precursor method presented better electrocatalytic properties for the generation of oxidizing agents26.
Rodrigues and Olivi3 studied the influence of two different
temperatures (400 and 500 °C) on the structure of Ti/SnO2-Sb electrodes prepared by Pechini’s method. They observed that the film on the electrode calcined at 400 °C presented a cracked surface, while the one calcined at 500 °C, presented a less cracked surface, lower roughness and higher particle dispersion on its surface. Grimm et al.23
used the sol-gel method to prepare a Ti/SnO2-Sb electrode, which was calcined at 600 °C (with a heating rate of 1 °C/min) and observed that the antimony doping was an important feature for phenol oxidation with Ti/SnO2 electrodes.
It is reported in the literature several methods and calcination temperatures employed to prepare electrode materials8-10,12,14-16,20,27;
however, it is known that their corrosion resistance depends on the method used. Then, the objective of this paper was investigating the resistance to corrosion of Ti/SnO2-Sb electrodes, for phenol oxidation in a saline medium, prepared by Pechini’s method with different calcination temperatures.
Preparation and Characterization of Ti/SnO
2-Sb Electrode
by Pechini’s Method for Phenol Oxidation
Iranildes Daniel Santosa,b*, Sinara Borborema Gabriela,
Júlio Carlos Afonsoc, Achilles Junqueira Bourdot Dutraa
a
Programa de Engenharia Metalúrgica e de Materiais – PEMM,
Instituto Alberto Luiz Coimbra de Pós-graduação e Pesquisa de Engenharia – COPPE,
Universidade Federal do Rio de Janeiro – UFRJ, CP 68.505, CEP 21941-972,
Rio de Janeiro, RJ, Brazil
b
Departamento de Engenharia de Materiais – DEMa,
Pontifícia Universidade Católica do Rio de Janeiro – PUC-Rio,
CEP 22451-900, Rio de Janeiro, RJ, Brazil
c
Departamento de Química Analítica – DQA,
Instituto de Química – IQ,
Universidade Federal do Rio de Janeiro – UFRJ,
CP 68.563, CEP 21949-900, Rio de Janeiro, RJ, Brazil
Received: April 19, 2011; Revised: May 30, 2011
In this paper the influence of calcination temperature on the corrosion resistance of a Ti/SnO2-Sb electrode prepared according to Pechini’s method and its efficiency for phenol oxidation in chloride medium were investigated. When calcination was performed at 600 °C tin distribution throughout the film was more uniform, providing a more homogeneous film structure. Electrolysis of a 0.34 mol.L-1 NaCl solution containing 100 mg.L-1
phenol at 10 mA.cm-2 for 30 minutes lead to corrosion of the electrodes calcined at 400 and 500 °C, whereas
the one calcined at 600 °C remained practically unchanged, indicating that the coating structure, which is dependent of calcination temperature, plays an important role on the structural integrity of electrode material. Phenol concentration was reduced in 90% with the Ti/SnO2-Sb electrode calcined at 600 °C after 60 minutes of electrolysis at 10 mA.cm-2.
Keywords: Ti/SnO2-Sb electrode, calcination temperature, corrosion, phenol removal
The counter electrode was a pure titanium plate28,32 and the reference
was Ag/AgCl in saturated KCl solution (Eo = 0.198V vs. SHE). Unless
otherwise stated all the tests were carried out at room temperature (around 25 °C) and without stirring. The electrochemical tests were carried out in 0.34 mol.L-1 NaCl solution containing from 30 to
2. Experimental
2.1. Electrodes preparation
The electrodes were prepared from 1.0 mm thick pure titanium plates with 25 mm wide and 110 mm long. They were previously polished with 600-mesh emery paper and treated in a boiling solution of 10% (w/w) oxalic acid for 10 minutes28. Then, the plates were
washed with deionized water, dried with a hot air blown and then stored in a vacuum sealed dissecator before being coated with the Sb doped SnO2 film.
The titanium electrodes were coated with an antimony doped SnO2 film prepared by Pechini’s method29. The precursor solutions
were obtained from the following analytically pure reagents: citric acid, ethyleneglycol, potassium antimony tartarate, tin(II) chloride dihydrate, sodium hydroxide and concentrated nitric acid. Tin citrate was prepared according to the procedure described by Besso30. The
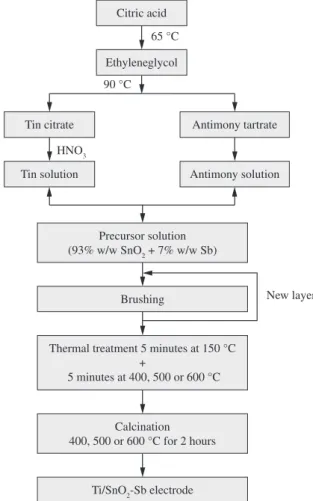
anhydro-citric acid:ethyleneglycol:tin citrate molar ratio for the film preparation was 3:10:1. The same ratio was adopted for the antimony precursor solution. The final precursor solution was obtained by mixing the two precursor solutions rendering a composition of 93% SnO2 and 7% Sb. A flow sheet of the experimental procedure used for preparation of the anode film, including the calcination step, is shown in Figure 1.
The microstructure of the titanium plate and electrodes calcined at 400, 500, 600 °C, before and after electrolytical tests, were analyzed by SEM and EDS. Additionally, the detection of Sb3+ and Sb5+ species
in the electrode coat was performed by classical qualitative chemical analysis31. The analysis by Fourier transform infrared spectroscopy
(FTIR) of the films was carried out with a Nicolet spectrometer, model IR-760 using the KBr pellet technique.
The change on the films structure obtained for the different temperatures tested was verified by X-ray diffraction (XRD) with a Shimadzu diffractometer, model XRD-6000, using Cu-Kα radiation.
2.2. Electrochemical tests
An EG&GPAR model 273A potentiostat/galvanostat connected to a microcomputer with the M270 software was used in the voltammetric tests. The cell was a 250 mL beaker with an acrylic cover and the working electrode was a 4.5 cm2 Ti/SnO
2-Sb calcined plate.
Figure 1. Experimental flowsheet used for the preparation of the Ti/SnO2-Sb
anode. Adapted from Rodrigues and Olivi3.
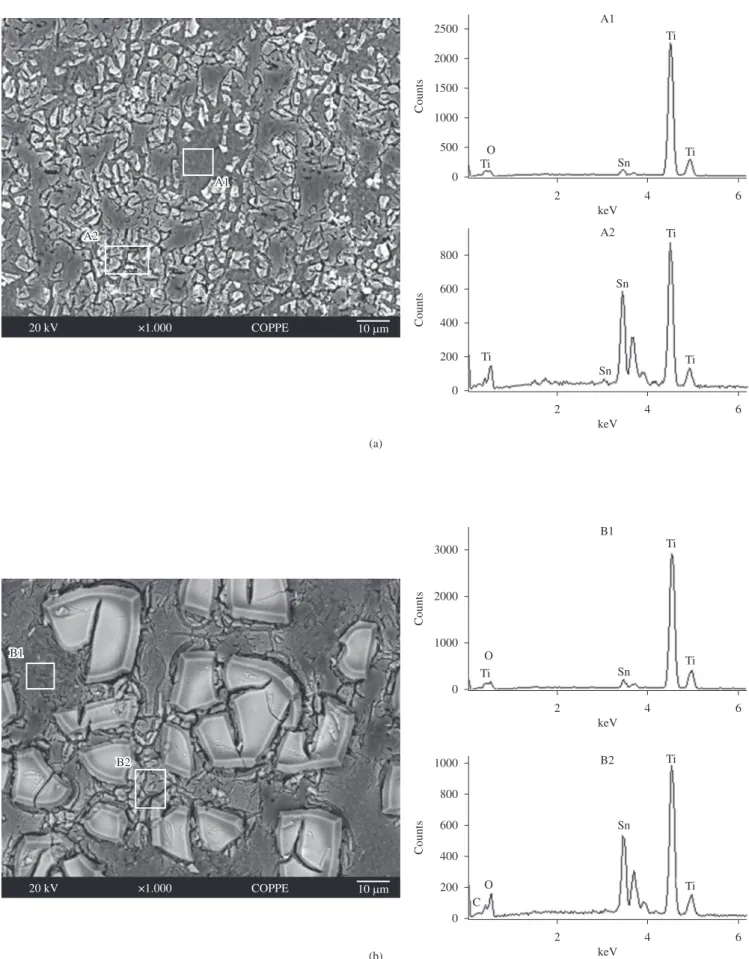
Figure 3. SEM micrographs and EDS spectra of Ti/SnO2-Sb electrode calcined for 2 hours at different calcination temperatures. a) 400 °C; b) 500 °C; and
100 mg.L-1 phenol. An initial solution volume of 200 mL was used
for all the voltammetric tests. The anodic potential was measured at the beginning and at the end of each test, and the current density was set at 10 mA.cm-2.
The electrolytic tests were conducted in the same cell used for the voltammetry, but under constant moderate stirring. For these tests, 230 mL of a 0.34 mol.L-1 NaCl solution containing 100 mg.L-1 of
phenol was used. The anode area was 27 cm2 and the current density
was fixed at 10 mA cm2. The anodic potential was monitored during
the tests.
Samples for chemical analysis were collected periodically from 5 to 60 minutes of electrolysis. Phenol degradation was monitored by UV/Vis28,33,34 at 269.5 nm. As hypochlorite band absorbs at the
same wavelength region of phenol, its presence after electrolysis was suppressed by the addition of 0.1 mol.L-1 NaHSO
3, according
to Reaction 1:
NaClO + NaHSO3→ NaCl + NaHSO4 (1)
3. Results and Discussion
SEM micrographs of the titanium surface before and after treatment with oxalic acid are presented in Figure 2a and b respectively. A drastic modification of the titanium surface, due to dissolution of the titanium oxide, was observed, rendering a moderate smooth surface, which favors the film adhesion29.
SEM micrographs along with the EDS spectra of the Ti/SnO2 anode doped with 7 wt. (%) Sb and calcined at 400, 500 and 600 °C, are shown in Figures 3a, 3b and 3c, respectively. It can be observed that the surface structure presents a cracked-clay appearance. At 400 °C, this structure is composed by dispersed small blocks, while at
500 °C a smaller number of bigger blocks was observed. At 600 °C, an aspect of broken blocks was observed, possibly due to the mechanical stress caused by the different thermal expansion coefficients of the film and substrate3, giving rise to a more homogeneous distribution
of the blocks throughout the surface. Furthermore, the temperature increase led to a more homogeneous antimony-doped tin oxide distribution on titanium surface, since the presence of spots with very low tin counts was detected by EDS only at 400 and 500 °C.
The absence of antimony in the EDS spectra can be attributed to its low concentration in the precursor solution, around 7 wt. (%). Another possibility may be related to the Sn and Sb ionization energies, which are close to each other, being 3.4 keV for Sn and 3.6 keV for Sb. In this way, Sn spectrum may mask the Sb one23.
The presence of Sb3+ and Sb5+ was identified by chemical
analysis according to procedure described by Vogel31. The qualitative
results indicate that Sb3+ and Sb5+ ions are present in all samples,
regardless the calcination temperature utilized. On the other hand, it was noticed, by visual observation of the color intensity increase of the solution during the qualitative chemical analysis and also by the EDS spectra , that the amount of Sb3+ and Sb5+ in the electrode
increased in the following sequence: 600 °C > 500 °C > 400 °C and 400 °C > 500 °C > 600 °C, respectively. This behavior can be attributed to decomposition of Sb2O5 to form Sb2O3 (Sb3+) at
temperatures above 340 °C35, indicating that the proportion of Sb3+ and
Sb5+ present in the material may be responsible for the morphological
behavior of the electrode calcined at 600 °C.
The FT-IR absorption spectra associated with stretching and bending vibrations at 400-4000 cm-1 of the powder precursor
(SnO2-Sb film) and its decomposition products after calcination at 400, 500 e 600 °C is shown in Figure 4. The spectra profile for the three calcination temperatures examined is similar. There are adsorption
Figure 4. IR spectra obtained from precursor solution used on the SnO2-Sb
film calcined at 400, 500 or 600 °C for 2 hours. Film composition: 93 wt. (%)
SnO2 and 7 wt. (%) Sb.
Figure 5. XRD spectra of the SnO2 film doped with 7 wt. (%) antimony and calcined at a) 400 °C; b) 500 °C; and c) 600 °C.
Figure 6. Cyclic voltammograms on Ti/SnO2-Sb anodes, calcined at different
temperatures, in a 0.34 mol.L-1 NaCl. ν = 100 mV s-1; anodic area: 4.5 cm2;
temperature: 25 °C.
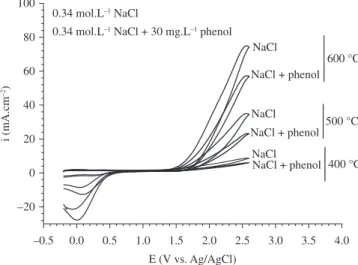
Figure 7. Cyclic voltammograms on Ti/SnO2-Sb anode, calcined at different
temperatures, in a 0.34 mol.L-1 NaCl in the absence and presence of 30 mg.L-1
phenol. ν = 100 mV. s-1; anodic area: 4.5 cm2; temperature: 25 °C.
bands at 3405 cm-1 (Figure 4) due to water (OH-stretching)36,37. The
bands between 400-1300 cm-1 can be attributed to the formation of
Sn-O and carbonate species during the calcination process38,39. The
small peak at 1627 cm-1 can be ascribed to the presence of H 2O in the
precipitated phase, as verified by Acarbas et al.38 during preparation
of nanosized tin oxide (SnO2) powder by homogeneous precipitation. The XRD spectra of the Ti/SnO2 anode doped with 7 wt. (%) of Sb and calcined at 400, 500 and 600 °C are shown in Figure 5. The profile is the same for all calcination temperatures but peak intensities increased as calcination temperature was increased. This behavior suggests a better formation and growing of SnO2 crystals at the more elevated temperature. Similar results were found by Ding et al.11 with electrodes prepared by electrodeposition method.
The peak at 2θ = 37.8o, which corresponds to Sb 2O3
28, increased as
calcination temperature was increased. This behavior is probably due to the decomposition of Sb2O5 to Sb2O3, suggesting that the presence of Sb2O3 may account for the morphology of the electrode calcined
at 600 °C, as shown in Figure 3c. The peaks at 2θ = 26.6o; 33.8o;
51.7o; 54.8o and 57.9o may be ascribed to SnO
2 with a cassiterite-type
tetragonal structure3,4,11,28,37,40. The slight displacement of the peaks
when compared to the standard SnO2 file may be a consequence of the formation of a solid solution due to the presence of antimony11,28.
The polarization behavior of Ti/SnO2-Sb anodes in 0.34 mol.L-1
NaCl calcined at 400, 500 and 600 °C is presented in Figure 6. It can be observed that as the calcination temperature is increased the anodic current became higher, indicating a more intense chlorine/ hypochlorite generation. The voltammetric behavior observed for the electrode calcined at 600 °C is probably, due to the morphologic characteristics of the material which presents higher superficial area, favoring the formation of oxidizing agents, when compared with the electrodes calcined at 400 and 500 °C10,20,41.
The polarization behavior of Ti/SnO2-Sb anodes in a 0.34 mol.L-1
NaCl with and without phenol (30 mg.L-1) calcined at 400, 500 and
Figure 8. SEM micrographs of Ti/SnO2-Sb anode calcined at different temperature, after electrolysis of a 0.34 mol.L-1 NaCl solution containing 100 mg.L-1
phenol. Anodic area: 27 cm2; temperature: 25 °C; i = 10 mA.cm-2. a) 400 °C; and b) 500 °C after 30 minutes of electrolysis; and c) 600 °C after 60 minutes
the coating erosion. As the electrode calcined at 600 °C presents a more uniform cracked clay structure, it seems to be less affected by the aggressive conditions necessary to phenol oxidation in chloride solutions. However, for electrolysis time longer than 60 minutes (Figure 8c), under a current density of 10 mA.cm-2 a slight loss of
the SnO2-Sb coating was detected.
The anode degradation can be minimized by keeping pH between 7 and 10, through controlled HCl additions, avoiding the domain of soluble tin species in the Eh vs. pH diagram42. However, anode
degradation still persists due to electrolyte penetration and gas evolution, especially for the anodes calcined at 400 and 500 °C, which do not present a very uniform and adherent coating. The aspect of the SnO2-Sb coating of the anodes calcined at 400, 500 and 600 °C, after 60 min of electrolysis under a current density of 10 mA.cm-2,
with pH kept in the range of 7 to 10, is presented in Figure 9. In this way, a smaller coating loss was observed for the anodes calcined at 400 and 500 °C, while no coating loss was detected in the anode calcined at 600 °C.
The influence of electrolysis time on the phenol removal in chloride medium using the anode calcined at 600 °C is presented in Figure 10. Phenol removal increased with the increase of electrolysis time43. The low phenol removal in the first minutes can be attributed
to the formation of organic intermediate compounds, such as chlorophenols. During electrolysis, the hypochlorite concentration increased due to the NaCl oxidation, after which phenol removal rate increased substantially. When most phenol was oxidized, its removal rate remains constant because phenol concentration was lower and the effect of the excess of hypochlorite used in the indirect oxidation mechanism was less noticeable. The phenol removal after 60 minutes of electrolysis with current densities of 10 mA.cm-2 reached 90%.
of phenol inhibited the anodic current density and displaced the curves to slightly higher potentials. This behavior can be attributed to the formation of chlorophenols via organic intermediate products reactions with the hypochlorite ions generated on the anode; the chlorophenols tend to adsorb on the anode surface, blocking it partially and causing a decrease on the current density19.
The anodic potential of the Ti/SnO2-Sb anodes calcined at 400, 500 and 600 °C rose from 2.0 to respectively 9.8 V, 12.8 V and 2.4 V, vs. Ag/AgCl (Eo = 0.198V in saturated KCl solution) after 30 minutes
of electrolysis, indicating a strong degradation of the anodes calcined at 400 and 500 °C, while the anode calcined at 600 °C remained almost unattacked. This behavior can be better understood when the anodes surface micrographs before (Figure 3) and after (Figure 8) electrolysis are compared. In Figure 8a (anode calcined at 400 °C), after the electrolysis, the aspect was changed due to the loss of SnO2-Sb coating in some spots, which is corroborated by the EDS microanalysis, where no Sn was detected after electrolysis. A similar behavior can be observed in Figure 8b, for the sample calcined at 500 °C; however, the coating loss was more severe. Probably, the absence of tin can also be associated to the anodic growth of the insulating TiO2 layer. When the anode was calcined at 600 °C less coating loss was observed after 30 minutes of electrolysis, and the aspect is similar to the electrode presented in Figure 3c. Furthermore, the EDS microanalysis did indicate the presence of tin, which did not occur on most of the electrodes surface calcined at 400 and 500 °C. The more intense coating loss may be associated to the less uniform structure of the anodes calcined at 400 and 500 °C and also to the pH raise during the electrolysis, which can bring the anode to the domain of tin corrosion in the Eh vs. pH diagram42. Moreover, the
cracked clay structure of the electrodes can allow the penetration of the electrolyte, which allied to anodic gases evolution, may favor
Acknowledgements
The authors are grateful to CNPq and FAPERJ for the financial support.
References
1. Andrade AR, Alves PDP, Fidellis CHV, Donate PM and Boodts JFC. Ethanol eletrooxidation in ruthenium-oxide-coated titanium electrodes. Journal of The Electrochemical Society. 1998; 145(11):3839-3843. http:// dx.doi.org/10.1149/1.1838882
2. Andrade, LS, Rocha-Filho RC, Bocchi N and Biaggi SR. Estudo do efeito dos sais precursores sobre as propriedades eletrocatalíticas de eletrodos de
Ti-SnO2/Sb preparados por decomposição térmica. Química Nova. 2004;
27(6):866-872. http://dx.doi.org/10.1590/S0100-40422004000600005
3. Rodrigues ECPE and Olivi P. Preparation and characterization of
Sb-doped SnO2 films with controlled stoichiometry from polymeric
precursors. Journal of Physics and Chemistry of solids. 2003;
64:1105-1112. http://dx.doi.org/10.1016/S0022-3697(03)00003-9
4. Bernardi MIB, Soledade LE, Santos IA, Leite ER, Longo E and Varela
JA. Influence of the concentration of Sb2O3 and the viscosity of the
precursor solution on the electrical and optical properties of SnO2 thin
films produced by the Pechini method. Thin Solid Films. 2002;
405:228-233. http://dx.doi.org/10.1016/S0040-6090(01)01770-9
5. Santos MRG, Goulart MOF, Tonholo J and Zanta CLPS. The application of electrochemical technology to the remediation of oily wastewater. Chemosphere. 2006; 64:393-399. PMid:16473394. http://dx.doi. org/10.1016/j.chemosphere.2005.12.036
6. Borras C, Berzoy C, Mostany J Herrera JC and Scharifker BR. A
comparison of the electrooxidation kinetics of p-methoxyphenol and
p-nitrophenol on Sb-doped SnO2 surfaces: concentration and temperature
effects. Applied Catalysis B: Environmental. 2007; 72:98-104. http://
dx.doi.org/10.1016/j.apcatb.2006.09.017
7. Chen G. Electrochemical technologies in wastewater treatment. Separation and Purification Technology. 2004; 38:11-41. http://dx.doi. org/10.1016/j.seppur.2003.10.006
8. Chen G, Chen X and Yue PL. Electrochemical behavior of novel Ti/IrOx
-Sb2O5-SnO2 anodes. Journal of Physical Chemistry B. 2002;
106:4364-4369. http://dx.doi.org/10.1021/jp013547o
9. Comninellis C. Electrocatalysis in the electrochemical conversion/
combustion of organic pollutants for waste water treatment. Electrochimica
Acta. 1994; 39(11):1857-1862.
http://dx.doi.org/10.1016/0013-4686(94)85175-1
10. Correa-Lozano B, Comninellis C and Battisti A. Service life of Ti/SnO2
-Sb2O5 anodes. Journal of Applied Electrochemistry. 1997; 27:970-974.
http://dx.doi.org/10.1023/A:1018414005000
4. Conclusions
The efficiency and resistance of the Ti/SnO2-Sb anode prepared according to Pechini’s method for phenol oxidation in chloride environment depend strongly on its calcination temperature. SEM micrographs allied to EDS spectra indicated that calcination at 600 °C led to a more uniform tin distribution throughout the film, rendering a more homogeneous film structure.
After a 30 min-electrolysis of a 0.34 mol.L-1 NaCl solution,
containing 100 mg.L-1 phenol at 10 mA.cm-2, the anodes calcined at
400 and 500 °C were corroded, while the anode calcined at 600 °C remained practically unchanged.
Results indicated that the Pechini’s method seem to be appropriate for the manufacturing of the Ti/SnO2-Sb electrode. It was necessary to keep the pH between 7 and 10 to avoid tin dissolution and consequent film degradation. Results also indicated that the coating structure, which depends on the calcination temperature, play an important role on its integrity. By keeping the pH between 7 and 10, a reduction of 90% of the phenol concentration was obtained after a 60 minutes of electrolysis, at 10 mA.cm-2, with the Ti/SnO
2-Sb anode calcined
at 600 °C.
Figure 10. Influence of electrolysis time on the phenol removal using
Ti/SnO2-Sb calcined at 600°C. Solution: 100 mg.L
-1 phenol, 0.34 mol.L-1
NaCl; anodic area: 27 cm2 i: = 10 mA cm-2; temperature: 25 °C. Phenol UV
absorbency wavelength: 269.5 nm.x
Figure 9. SEM micrographs of a Ti/SnO2-Sb calcined at different temperatures, after 60 minutes of electrolysis of 0.34 mol.L-1 NaCl solution containing
26. Lassali TAF, Boodts JFC and Bulhões LOS. Effects of Sn-precursor on
the morphology and composition of Ir0,3Sn0,7O2 oxide films prepared by
sol-gel process. Journal of Non-Crystalline Solids. 2000; 273:129-134.
http://dx.doi.org/10.1016/S0022-3093(00)00152-6
27. He D and Mho S. Electrocatalytic reactions of phenolic compounds at ferric
íon co-doped SnO2:Sb
5+ electrodes. Journal of Electroanalytical Chemistry.
2004; 568:19-27. http://dx.doi.org/10.1016/j.jelechem.2003.12.030
28. Yang X, Zou R, Huo F, Cai D and Xiao D. Preparation and characterization
of Ti/SnO2-Sb2O3-Nb2O5/PbO2 thin film as electrode material for the
degradation of phenol. Journal of Hazardous Materials. 2009;
164:367-373. PMid:18799264. http://dx.doi.org/10.1016/j.jhazmat.2008.08.010
29. Pechini MP. Method of preparing lead and alkaline earth titanates and
niobates and coating method using the same to form a capacitor. US 3330697. 1967.
30. Besso MM. Tin salts of citric acid and method of preparation. US Patent.
3.213.120. 1965.
31. Vogel AI. Química Analítica Qualitativa. Rio de Janeiro: Mestre Jou;
1981.
32. Iniesta J, Gonzalez-Garcia J, Expósito E, Montiel V and Aldaz A. Influence of chloride ion on electrochemical degradation of phenol in
alkaline medium using bismuth doped and pure PbO2 anodes. Water
Research. 2001; 35(14):3291-3300. http://dx.doi.org/10.1016/S0043-1354(01)00043-4
33. Li M, Feng C, Hu W, Zhang Z and Sugiura N. Electrochemical degradation
of phenol using electrodes of Ti/RuO2-Pt and Ti/IrO2-Pt. Journal of
Hazardous Materials. 2009; 162:455-462. http://dx.doi.org/10.1016/j. jhazmat.2008.05.063
34. Amlathe S, Upadhyay S and Gupta VK. Spectrophotometric determination
of trace amounts of phenol in waste water and biological fluids. Analyst.
1987; 112:1463-1465. PMid:3434826. http://dx.doi.org/10.1039/ an9871201463
35. Kubaschewski O and Alcock CB. Metalurgical Thermochemistry. Great
Britain: Pergamon Press; 1977. v. 24.
36. Silverstein RM, Bassler GC and Morril TC. Identificação espectrométrica
de compostos orgânicos. 5th ed. Rio de Janeiro: Guanabara Dois; 1994.
37. Costa GCC and Muccillo R. Synthesis of lanthanum beta-alumina
powders by the polymeric Precursor technique. Ceramics International.
2008; 34:1703-1707. http://dx.doi.org/10.1016/j.ceramint.2007.05.009
38. Acarbas O, Suvaci E and Dog A. Preparation of nanosized tin oxide
(SnO2) powder by homogeneous precipitation. Ceramics International.
2007; 33:537-542. http://dx.doi.org/10.1016/j.ceramint.2005.10.024
39. Pillai SK, Sikhwivhilua LM and HillieTK. Synthesis, characterization
and photoluminescence properties of Dy3+-doped nano-crystalline SnO
2.
Materials Chemistry and Physics. 2010; 120:619-624. http://dx.doi. org/10.1016/j.matchemphys.2009.12.010
40. Kong J, Shi S, Zhu X and Ni J. Effect of Sb dopant amount on the
structure and electrocalytic capability of Ti/Sb-SnO2 electrodes in the
oxidation of 4-chlorophenol. Journal of Environmental Science. 2007;
19(11):1380-1386. http://dx.doi.org/10.1016/S1001-0742(07)60225-3 41. Zhang R, Lee JY and Liu ZL. Pechini process-derived tin oxide and
tin oxide-graphite composites for lithium-ion batteries. Journal of
Power Sources. 2002; 112:596-605. http://dx.doi.org/10.1016/S0378-7753(02)00483-4
42. Pourbaix M. Atlas of electrochemical equilibrium in aqueous solutions.
Brussels: National Association of Corrosion Engineers; 1974.
43. Kim K, Lee E, Kim J, Shinb K and Jung B. A study on performance improvement of Ir oxide-coated titanium electrode for organic destruction. Electrochimica Acta. 2002; 47:2525-2531. http://dx.doi.org/10.1016/ S0013-4686(02)00129-9
11. Ding H, Feng Y and Liu J. Preparation and properties of Ti/SnO2-Sb2O5
electrodes by electrodeposition. Materials Letters. 2007; 61:4920-4923.
http://dx.doi.org/10.1016/j.matlet.2007.03.073
12. Comninellis C. Electrochemical oxidation of organic pollutants
for wastewater treatment. Lausanne, Switzerland: Elsevier; 1994. Environmental Oriented Electrochemistry.
13. Comninellis C and Pulgarin C. Electrochemical oxidation of phenol for
waste treatment using SnO2 anodes. Journal of Applied Electrochemistry.
1993; 23:108-112. http://dx.doi.org/10.1007/BF00246946
14. Comninellis C and Vercesi GP. Characterization of DSA®-type
oxygen evolving electrodes: choice of a coating. Journal of Applied
Electrochemistry. 1991; 21:335-345. http://dx.doi.org/10.1007/ BF01020219
15. Costa CR, Botta CMR, Espindola ELG and Olivi P. Eletrochemical
treatment of tannery wastewater using DSA® electrodes. Journal of
Hazardous Materials. 2008; 153:616-624. PMid:17931769. http://dx.doi. org/10.1016/j.jhazmat.2007.09.005
16. Coteiro RD and De Andrade AR. Electrochemical oxidation of
4-chlorophenol and its by-products using Ti/Ru0,3M0,7O2 (M = Ti or
Sn) anodes: preparation route versus degradation efficiency. Journal of
Applied Electrochemistry. 2007; 37:691-698. http://dx.doi.org/10.1007/ s10800-007-9301-9
17. Feng YJ, Cui Y, Logan B and Liu Z. Perfomance of Gd-doped
Ti-based Sb-SnO2 anodes for electrochemical destruction of phenol.
Chemosphere. 2008; 70:1629-1639. http://dx.doi.org/10.1016/j. chemosphere.2007.07.083
18. Feng Y and Li X. Electro-catalytic oxidation of phenol on several
metal-oxide electrodes in aqueous solution. Water Research. 2003;
37:2399-2407. http://dx.doi.org/10.1016/S0043-1354(03)00026-5
19. Ferreira M, Varela H, Torresi RM and Tremiliosi-Filho G. Electrodes passivation caused by polymerization of different phenolic compounds. Electrochimica A-cta. 2006; 52:434-442. http://dx.doi.org/10.1016/j. electacta.2006.05.025
20. Forti JC, Olivi P and De Andrade AR. Characterization of DSA
-type
coatings with nominal composition Ti/Ru0.3Ti(0.7-x)SnxO2 prepared via
a polymeric precursor. Electrochimica Acta. 2001; 47:913-920. http://
dx.doi.org/10.1016/S0013-4686(01)00791-5
21. Freitas RG, Oliveira RTS, Santos MC, Bulhões LOS and Pereira EC. Preparation of Pt thin film electrodes using the Pechini method. Materials Letters. 2006; 60:1906-1910. http://dx.doi.org/10.1016/j. matlet.2005.12.050
22. Gomes L, Freitas RG, Malpass GRP, Pereira EC and Motheo AJ. Pt film electrodes prepared by the Pechini method for electrochemical
decolourisation of reactive orange 16. Journal of Applied Electrochemistry.
2009; 39:117-121. http://dx.doi.org/10.1007/s10800-008-9649-5
23. Grimm J, Bessarabov D, Maier W, Storckb S and RD. SandersonSol-gel film-preparation de novel electrodes for the electrocatalytic oxidation
of organic pollutants in water. Desalination. 1998; 115:295-302. http://
dx.doi.org/10.1016/S0011-9164(98)00048-4
24. Panic VV, Dekanski A, Milonjic, SK, Atanasoski RT, and Nikoli BZ.
RuO2-TiO2 coated titanium anodes obtained by the sol-gel procedure
and their electrochemical behavior in the chlorine evolution reaction. Colloids and Surfaces A: Physicochemical and Engineering Aspects. 1999; 157:269-274. http://dx.doi.org/10.1016/S0927-7757(99)00094-1
25. Oliveira-Souza A, Silva MAS, Machado SAS, Avaca LA and De Lima-Neto P. Influence of the preparation method on the morphological and
electrochemical properties of Ti:IrO2-coated electrodes. Electrochimica
Acta. 2000; 45:4467-4473.