Diferentials in vital information
in the state of Pernambuco,
Brazil, 2006-2008
Diferenciais na adequação das
informações de eventos vitais nos
municípios de Pernambuco,
2006-2008
Mirella Rodrigues
I,VCristine Bonim
IIPaulo Germano de Frias
III,IVCynthia Braga
III,VIdê Gomes Dantas Gurgel
VIZulma Medeiros
V,VIII Secretaria de Saúde do Estado de Pernambuco. Recife, PE, Brasil
II Diretoria de Pesquisas Sociais da Fundação Joaquim Nabuco. Recife, PE, Brasil III Instituto de Medicina Integral Prof. Fernando Figueira. Recife, PE, Brasil IV Secretaria de Saúde do Recife. Recife, PE, Brasil
V Departamento de Parasitologia do Centro de Pesquisas Aggeu Magalhães. Recife, PE, Brasil.
VI Departamento de Saúde Coletiva do Centro de Pesquisas Aggeu Magalhães. Recife, PE, Brasil.
VII Instituto de Ciências Biológicas. Universidade de Pernambuco. Recife, PE, Brasil.
Correspondence: Mirella Rodrigues. Centro de Pesquisas Aggeu Magalhães, Departamento de Parasitologia, Laboratório de Doenças Transmissíveis. Av. Moraes Rego, s.n. Recife, PE, Brasil, CEP 50670-420. E-mail: [email protected]
Abstract
Objective: To assess differentials in official birth and death data for estimating infant mortality. Methods: An ecological study was conducted based on data obtained from birth and death information systems in the state of Pernambuco, northeastern Brazil, between 2006 and 2008. The following indicators were used: age-standardized mortality rate, relative mean deviation of mortality rate, ratio of reported to estimated live births, relative mean deviation of birth rate and proportion of deaths of unknown cause. These indicators were grouped into three dimensions: mortality, fertility and ill-defined causes. Based on predetermi-ned criteria, municipalities were classified as follows: consolidated vital data; vital data in the consolidation phase; and non--consolidated data. The data were analyzed using EpiInfo and Terraview for map
prepa-ration. Results: Of the 185 municipalities
in the state of Pernambuco, 141 (76.2%) were classified as having consolidated vital data, accounting for about 85% of the state population, and 17 (9.2%) were classified as having non-consolidated data, accoun-ting for only 4.9% of the population. Larger municipalities (50,000 inhabitants or more) showed better data quality. Conclusion: The approach studied proved itself valuable to assess the quality of vital information and identify inequalities in Pernambuco. Reduction of inequalities is a challenge in this state in the sense of enabling vital in-formation to be analyzed directly from data systems at the local level. It will also allow assessing the effectiveness of initiatives to reduce infant mortality in Pernambuco.
Resumo
Objetivo: Avaliar os diferenciais da ade-quação das informações de nascimentos e óbitos do Ministério da Saúde para o cálculo da mortalidade infantil nos municípios do Estado de Pernambuco, 2006-2008. Métodos: Estudo ecológico, cujas fontes de dados foram os sistemas de informação sobre nascidos vivos e mortalidade. Foram utilizados os indicadores: coeficiente de mortalidade geral padronizado por idade, desvio médio relativo do coeficiente de mortalidade geral, razão entre nascidos vivos informados e estimados, desvio médio relativo da taxa de natalidade e proporção de óbitos sem definição de causa básica. Estes indicadores foram agregados em três dimensões: mortalidade, natalidade e mal definidos. Utilizando critérios pré-estabe-lecidos, os municípios foram classificados como: informações vitais consolidadas, em fase de consolidação e não consolidadas. Os dados foram analisados através do progra-ma Epiinfo e do Terraview para elaboração dos mapas. Resultados: Dos 185 municípios do Estado, 141 (76,2%) foram classificados como informações vitais consolidadas, agregando aproximadamente 85% da po-pulação residente e 17 (9,2%) como não consolidadas, categoria na qual reside ape-nas 4,9% da população. Os municípios com 50.000 habitantes ou mais têm informações de melhor qualidade. Conclusão: O método utilizado mostrou-se potencial para classi-ficar a qualidade das informações vitais em Pernambuco, identificando as desigualda-des, que se constituem em desafios para o Estado, no sentido de possibilitar a análise destas informações a partir de dados diretos dos sistemas no âmbito municipal. Apenas dessa forma torna-se possível avaliar os investimentos realizados para a redução da mortalidade infantil em Pernambuco de forma realística.
Palavras-chave: Sistemas de Informação. Óbito. Nascido Vivo. Mortalidade Infantil. Estatísticas Vitais.
Introduction
The adequacy of health information has been considered a challenge to the health sector, regarding the need to assess the fulfillment of the millennium goals, such as the reduction of infant mortality (IM) in the
Americas.1 It is well known that precise and
safe monitoring of the event is performed only by calculating the coefficients by the
direct method.2
Since the implementation of the Information Systems on Mortality and Live Births, an increasing coverage of the
national territorry3,4,5 has been observed,
having reached approximately 90% in 2006.6
However, large variations occur when these coverage percentages are analyzed in the Unit of the Federation (UF), particularly in the states of the North and Northeast regions of Brazil3
Delayed civil registration and under-reporting of births and deaths are viewed as the major factors that hamper the attainment of the IM estimates and their
components.4,7 When it is not possible to
measure the IM coefficients by the direct method, indirect demographic techniques are used, and the coefficients are calculated based on data from the census of population and from the National Household Sample
Survey (Pesquisas Nacionais por Amostra
de Domicílios - PNADs), conducted by the Brazilian Institute of Geography and
Statistics (Instituto Brasileiro de Geografia
e Estatística - IBGE)2.
In order to assess the adequacy of vital information of the municipalities, a metho-dology was developed, which used five indi-cators of mortality and natality2. This
propo-sal, refined in 20073, allows the identification
of weaknesses in the information systems at a local level8 and the development of specific
actions to improve adequacy, in order to obtain reliable measures of the IM using the direct method.
The state of Pernambuco has experien-ced considerable progress in coverage and
quality of information of these systems.5
Health Information Network (Ripsa), it is estimated that in 2006, the Sinasc recor-ded 93.7% of births and the SIM, 80% of
the expected deaths in the population6.
Pernambuco is considered the state with best quality of vital statistics records in the Northeast. 4 However, it is possible that some
variation in the adequacy of the system still persist because of peculiarities in the local network of health services regarding regis-tration and processing of vital information. The knowledge of the adequacy of information on births and deaths in the municipalities of the state of Pernambuco will enable the identification of the locali-ties most in need of investments aimed at improving the adequacy of vital statistics and will obtain more precise IM indicators, calculated by the direct method, which provides subsidies for the formulation of
specific public health policies1. The goal
of this paper is to assess the adequacy of information on births and deaths in order to calculate the IM in the municipalities of the state of Pernambuco.
Methods
Between 2006 and 2008 we conducted an ecological study in the municipalities of Pernambuco, a state in Northeastern Brazil, with an area of 98,311,616 Km² and a population of 8,485,386, predominantly urban (76.5%). Pernambuco has 185 muni-cipalities distributed in five mesoregions: Metropolitana do Recife, Mata, Agreste,
Sertão and São Francisco.9 We chose this
reference period because of the availability of data and because studies had already been conducted on the previous 2
trien-niums5. We used data from SIM and Sinasc,
made available by the Health Departament
of Pernambuco (Secretaria de Saúde de
Pernambuco (SES-PE)).
To assess the adequacy of information, we used the method proposed by Andrade
e Szwarcwald3, which consists of five
indi-cators, calculated per municipality (Table 1). All the municipalities were classified as: satisfactory, non-satisfactory or deficient,
for each indicator studied. For classification purposes, the municipalities were catego-rised into two groups, according to popu-lation size: size I (municipalities with less than 50,000 inhabitants) and size II (muni-cipalities with 50,000 or more inhabitants). 3
The parameters used to classify the municipalities according to the indicators of adequacy of information were calcula-ted based on the confidence limits of the average of the indicators of the 8 Ufs, with information deemed appropriate by Ripsa’s
criteria5. The classification parameters for
the satisfactory, non-satisfactory and
defi-cient categories were measured by the 10th
and 1st percentiles by the indicators total
mortality coefficient standardised by age
and ratio between reported and estimated live births, and the 90th and 99th
percenti-les by the other indicators5 (Table 1). The
classification of municipalities according to each indicator permitted the analysis of three dimensions – mortality, natality and ill-defined causes – and the overall adequacy of vital information.3
To assess the dimensions we made use of three categories5:
• Consolidated:whentheindicatorsofthe
dimension are satisfactory.
• Consolidating:whenatleastoneofthe
dimension indicators is not satisfactory and none is deficient.
• Non-consolidated:whenatleastoneof
the dimension indicators is deficient. Similarly, the municipalities were clas-sified according to the overall adequacy of vital information5:
• Consolidatedvitalinformation:whenall
the indicators are satisfactory.
• Consolidating vital information: when
at least one of the indicators is not sa-tisfactory and none is deficient.
• Non-consolidated vital information:
when at least one of the indicators is deficient.
We carried out the mapping of the muni-cipalities according to the three dimensions and the overall adequacy of vital
informa-tion. The software used was TerraView,
Chart 1 - Criteria for classiication of municipalities according to the appropriateness of vital information at the local level.
Quadro 1 - Critérios para classiicação dos municípios segundo a adequação das informações vitais.
Dimension Indicators
< 50.000 inhabitants ≥ 50.000 inhabitants
Satisfactory
Non-satisfactory Deicient Satisfactory
Non-satisfactory Deicient
M
or
talit
y
Coeiciente geral de mortalidade padronizado por idade
≥ 4.39 ≥ 3.42 e <
4.39 < 3.42 ≥ 5.29
≥ 4.72 e <
5.29 < 4.72
Desvio médio relativo do coeiciente geral de mortalidade
< 21.92 > 21.92 e ≤
36.37 > 36.37 ≤ 6.98
> 6.98 e <
9.98 > 9.98
Na
talit
y
Razão entre nascidos vivos informados e estimados
≥ 0.64 ≥ 0.47 e <
0.64 < 0.47 ≥ 0.76
≥ 0.65 e <
0.76 < 0.65
Desvio médio relativo da taxa de natalidade
≤ 16.27 > 16.27 e ≤
29.58 > 29.58 ≤ 5.14
> 5.14 e ≤
8.80 > 8.80
Ill-deined causes
Proporção de óbitos sem deinição da causa básica
≤ 17.35 > 17.35 e ≤
29.37 > 29.37 ≤ 16.33
> 16.33 e ≤
22.02 > 22.02
Fonte/Source: Frias et al., 2010.5
was shapefile (*.shp), anextension required to read the georeferencing program. The other data was analysed by Epi Info for Windows, version 3.5.1.
This study was approved by the Research
EthicsCommiteeoftheCentro de Pesquisas
Aggeu Magalhães(CPqAM/FIOCRUZ),un
-
derregistrationCAAENo.0079.0.095.000-10, and we declare that there are no conflicts of interests.
Results
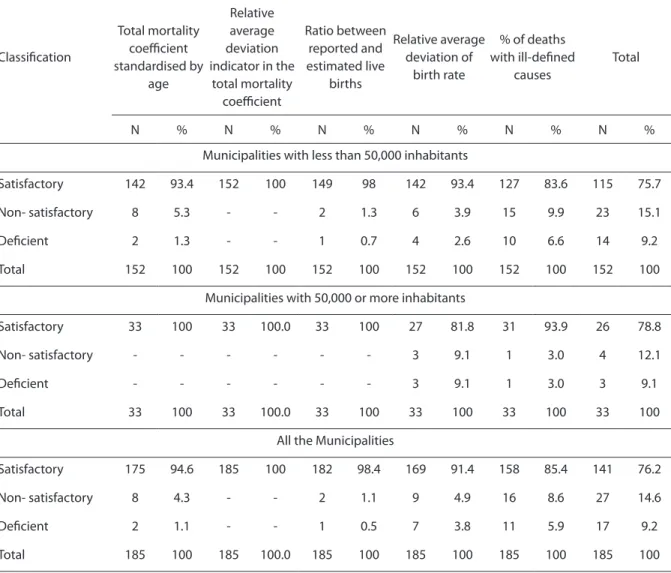
Of the total number of municipalities, 152 (82.1%) have less than 50,000 inhabi-tants (size I). All municipalities in the state were classified as satisfactory by the relative average deviation indicator in the total
mortality coefficient (CGM). Also all those categorized as size II were rated as
satisfac-tory by the CGM Standardized Indicators
and in the Ratio between reported and
estimated live births. The relative average deviation of birth rate was considered sa-tisfactory in 93.4% of municipalities of size I, and in 81.8% of municipalities of size II.
By the indicator percentage of deaths with
ill-defined causes, 93.9% of municipalities of size II were rated satisfactory (Table 1).
In the mortality dimension, all munici-palities of size II and 93.4% of those of size I were classified as consolidated. In the na-tality dimension, 91.4% of municipalities of size I and 81.8% of size II were also classified as consolidated (Table 2).
municipalities (76.2%) were classified as consolidated vital information. These muni-cipalities have 85% of the state population. 17 municipalities (9.2%) were classified as non--consolidated vital information and there re-sides 4.9% of the population of Pernambuco. Stratifying the overall adequacy of information according to size, we conclu-ded that both sizes belong to the category
consolidated vital information: 75.7% of the municipalities with less than 50,000 inhabitants and 78.8% of municipalities of size II. The percentage of municipalities with non-consolidated vital information
was similar in both population strata, 9.2% and 9.1%, respectively (Table 2).
Figure 1 shows the spatial distribution of the adequacy of information in the munici-palities of Pernambuco. It shows that only two municipalities are non-consolidated in the dimension mortality (Figure 1A). In contrast, in the dimension natality, we notice that among the non-consolidated municipalities, 4 (50%) are located in the Sertão mesoregion (Figure 1B). In the di-mension ill-defined causes, 100% of the municipalities of the Metropolitana do Recife and Mata mesoregions were classified
Table 1 - Classiication of the appropriateness of vital information according to selected indicators. Pernambuco, northeastern Brazil, 2006–2008.
Tabela 1 - Classiicação da adequação da informação segundo indicadores utilizados. Pernambuco, 2006-2008.
Classiication
Indicators
Total mortality coeicient standardised by
age
Relative average deviation indicator in the
total mortality coeicient
Ratio between reported and estimated live
births
Relative average deviation of
birth rate
% of deaths with ill-deined
causes
Total
N % N % N % N % N % N %
Municipalities with less than 50,000 inhabitants
Satisfactory 142 93.4 152 100 149 98 142 93.4 127 83.6 115 75.7
Non- satisfactory 8 5.3 - - 2 1.3 6 3.9 15 9.9 23 15.1
Deicient 2 1.3 - - 1 0.7 4 2.6 10 6.6 14 9.2
Total 152 100 152 100 152 100 152 100 152 100 152 100
Municipalities with 50,000 or more inhabitants
Satisfactory 33 100 33 100.0 33 100 27 81.8 31 93.9 26 78.8
Non- satisfactory - - - 3 9.1 1 3.0 4 12.1
Deicient - - - 3 9.1 1 3.0 3 9.1
Total 33 100 33 100.0 33 100 33 100 33 100 33 100
All the Municipalities
Satisfactory 175 94.6 185 100 182 98.4 169 91.4 158 85.4 141 76.2
Non- satisfactory 8 4.3 - - 2 1.1 9 4.9 16 8.6 27 14.6
Deicient 2 1.1 - - 1 0.5 7 3.8 11 5.9 17 9.2
as consolidated, whereas in the Agreste, 41% of municipalities were classified as
non--consolidated(Figure1C).
The analysis of the overall adequacy of in-formation reveals that in the Metropolitana do Recife and Mata mesoregions almost all municipalities have consolidated vital information, while of the 15 municipalities of São Francisco mesoregion, 8 (53%) were classified as belonging to the consolidating or non-consolidated catagories (Figure 1D).
Discussion
Consideringthemethodweused,itcan
be stated that the majority of the population
of Pernambuco lives in municipalities with consolidated vital information, whereas less 5% lives in localities with non-consolidated information. The municipalities with 50,000 or more inhabitants have higher quality in-formation when compared to municipalities with less than 50,000.
This evidence5,10,11,12 is confirmed by
other studies, which acknowledge that in Pernambuco there was improvement on coverage and regularity of information5,10, as
well as advance in quality, both in the per-centage of filled in variables in a declaration of birth11,12 and in a declaration of death13,14
and in the percentage of deaths with
ill--defined causes.10 Such improvements were
Table 2 - Classiication of the appropriateness of vital information according to the three dimensions assessed. Pernambuco, northeastern Brazil, 2006–2008.
Tabela 2 - Classiicação da adequação da informação segundo as três dimensões avaliadas. Pernambuco, 2006-2008.
Classiication
Dimensions
Mortality Natality Ill-deined causes Overall adequacy
N % N % N % N %
Municipalities with less than 50,000 inhabitants
Consolidated 142 93.4 139 91.4 127 83.6 115 75.7
Consolidating 8 5.3 8 5.3 15 9.9 23 15.1
Non-consolidated 2 1.3 5 3.3 10 6.6 14 9.2
Total 152 100 152 100 152 100 152 100
Municipalities with 50,000 or more inhabitants
Consolidated 33 100 27 81.8 31 93.9 26 78.8
Consolidating - - 3 9.1 1 3.0 4 12.1
Non-consolidated - - 3 9.1 1 3.0 3 9.1
Total 33 100 33 100 33 100 33 100
All the Municipalities
Consolidated 175 94.6 166 89.7 158 85.4 141 76.2
Consolidating 8 4.3 11 5.9 16 8.6 27 14.6
Non-consolidated 2 1.1 8 4.3 11 5.9 17 9.2
superior to those attained in the Northeast and in Brasil.5
In the spatial distribution of the ade-quacy of information, we observed that, of the three dimensions, mortality is the most homogeneous in Pernambuco and natality is disparate.
In regard to the latter, the number of mu-nicipalities classified as non-consolidated increases as we move away from the capital. The Sertão mesoregion concentrates most of these municipalities.
The percentage of municipalities classi-fied as consolidating or non-consolidated in the mortality dimension is greater than or equal to the percentage of municipalities, with the same classification as above, in the natality dimension.
This fact is noted both in small and large towns but other studies have found that the
natality rate is greater than the mortality rate.6,15 However, Sinac’s coverage has come
down, even in areas where there are states considered by Ripsa as possessing adequate vital information.
Between the years 1997 and 2002, the South, Southeast and Mid-West witnessed a decrease in coverage. This fact may be associated with fertility decline and the resulting birth rate.16
Death with ill-defined causes refers to cases where the person did not receive any medical assistance, cases where the cause of death was not established, or cases whe-re the physician only described a sign or a
sympton17. This indicator can elucidate
as-pects that go beyond adequacy of informa-tion, providing elements to make us reflect on the living conditions and the inadequacy of access to health services.18,19,20
Figure 1 – Spatial distribution of the criteria for appropriateness of vital information by municipality. A) Magnitude of mortality, B) Magnitude of birth rates, C) Ill-deined causes and D) Overall appropriateness of vital information. 1 – Mesoregion of Greater Recife (capital city); 2 – Mesoregion of Mata; 3 – Mesoregion of Agreste Pernambucano; 4 – Mesoregion of Sertão Pernambucano; 5 – Mesoregion of São Francisco.
In this study, we found that municipali-ties with fewer than 50,000 inhabitants have difficulties in determining the causes of de-ath of their residents. Approximately 17% of the municipalities were classified as belon-ging to consolidating or non-consolidated dimensions, which compromise specific analysis of the main causes of death.
Although between 2000 and 2005 some improvements were made to identify under-lying causes of death, some municipalities in Pernambuco still have a high percentage of deaths with ill-defined causes5. It is well
known that as the health care and the access to it improves, particularly in a hospital environment, where diagnostic resources are readily available, ill-defined causes of death decrease21,22.
In Brazil, of the overall number of ill-de-fined causes of death in 2002, 53% happened
without medical assistence17, and in 2003,
in Pernambuco, 81.7%, which reflects the difficulty of access to health care.23 As for the
overall adequacy of information, it is clear that it is heterogeneous. Almost all munici-palities in the mesoregions Metropolitana do Recife and Mata have consolidated vital information. But as we move away from the capital, more municipalities are classified as consolidating and non-consolidated vital information. In the mesoregion São Francisco, most municipalities were classi-fied in the latter two categories. This hete-rogeneity may be related to social inequality and the availability of goods and health services, which are reflected in the conti-nuation of the existence of municipalities with inadequate information. Overall, there is a direct relationship between the distance from the capital, insufficient health services and skilled professionals that can promote appropriate care in a timely manner and the need for adjustments to consolidate vital
information.3
With respect to the method used to evaluate the adequacy of information, there are limitations previously descri-bed.3,2,5 Here are some of the limitations
that resulted from the application of this method in Pernambuco. The first refers
to the CGM Standardised indicators and
Ratio between reported and estimated live births, covered by SIM and Sinasc, respec-tively. These indicators are more useful to classify than quantify, as they identify the municipalities that have problems gathe-ring information on death and birth, but do not accurately measure the coverage of the above-mentioned systems. The need to use population estimates, based on the 2000 census, creates limitations for the calcula-tion of the indicators. As an example, we can cite the population estimate for the less than one year-olds, which is affected by the undercount of this age group in the census demographics and by the steady decline of fertility and birth rate.
Another limitation is the use of criteria to classify the adequacy of information, based on the results of a previous triennium. However, since these criteria were calcula-ted based on vital information of the 8 Ufs classified by Ripsa as adequate, and these showed no major changes in a short period, we believe that the use of previous infor-mation does not compromise the analysis nor the classification of the municipalities of Pernambuco.
The last limitation is that the death with ill-defined causes indicator is not linked to the dimension that assesses mortality. Even though it is an indicator that belongs to SIM, in this method it is used to assess the quality of information of death, as it is admittedly a potential assessment parameter.
The use of indicators proved to be a potential method for classifying the quality of information in Pernambuco, insofar as it enabled assessment of the state’s vital infor-mation systems, identification of inequali-ties, thus leading to the proposal of specific actions to improve the SIM and Sinasc at a local level, such as active research.24,25,26
References
1. TorresC,MujicaOJ.Health,equity,andthemillennium
development goals. Rev Panam Salud Pública 2004; 15: 430-9.
2. SzwarcwaldCL,LealMC,AndradeCLT,SouzaJr.PRB.
Estimação da mortalidade infantil no Brasil: o que dizem as informações de óbitos e nascimentos do Ministério da Saúde? Cad Saúde Pública 2002; 18: 1725-36.
3. AndradeCLT,SzwarcwaldCL.Desigualdades
sócio-espaciais da adequação das informações de nascimentos e óbitos do Ministério da Saúde, Brasil, 2000-2002. Cad Saúde Pública 2007; 23: 1207-16.
4. SchrammJMA,SzwarcwaldCL.Sistemahospitalar
como fonte de informações para estimar a mortalidade neonatal e a natimortalidade. Rev Saúde Pública 2000; 34: 272-9.
5. FriasPG,PereiraPMH,AndradeCLT,LiraPIC, SzwarcwaldCL.Avaliaçãodaadequaçãodas
informações de mortalidade e nascidos vivos no Estado de Pernambuco, Brasil. Cad Saúde Pública 2010;26: 671-81.
6. Rede Interagencial de Informações para a Saúde.
Indicadores básicos para saúde no Brasil: conceitos e aplicações (2ª ed.). Brasília: Organização Pan-Americana da Saúde; 2008.
7. Almeida MF, Alencar GP, Novaes HMD, Ortiz, LP. Sistemas de informação e mortalidade perinatal: conceitos e condições de uso em estudos
epidemiológicos. Rev Bras Epidemiol 2006; 9: 56-68.
8. Whitman S, Silva A, Shah A, Ansell D. Diversity and
disparity:GISandsmall-areaanalysisinsixChicago
neighborhoods. J Med Syst 2004; 28: 397-411.
9. IBGE (Instituto Brasileiro de Geografia e Estatística), 2009. Estados@ - Tema – Síntese de Indicadores Sociais 2009.Disponívelemhttp://www.ibge.gov.br.[Acessado
em 27 de dezembro de 2010]
10. Paes N. Avaliação da cobertura dos registros de óbitos dos estados brasileiros em 2000. Rev Saúde Pública 2005; 39: 882-90.
11. FriasPG,PereiraPMH,VidalAS,LiraPIC.Avaliação
da cobertura do Sistema de Informações sobre Nascidos Vivos e a contribuição das fontes potenciais de notificação do nascimento em dois municípios de Pernambuco, Brasil. Epidemiol Serv Saúde 2007; 16: 93-101.
12. CostaJMBS,FriasPG.Avaliaçãodacompletitudedas
variáveis da Declaração de Nascido Vivo de residentes em Pernambuco, Brasil, 1996 a 2005. Cad Saúde Pública
2009, 25: 613-24.
13. CostaJMBS,FriasPG.Avaliaçãodacompletitudedas
variáveis da declaração de óbitos de menores de um ano residentes em Pernambuco, Brasil, 1997-2005. Ciência e Saúde Coletiva 2011, 16: 1267-1274
14. RomeroDE,CunhaCB.Avaliaçãodaqualidadedas
variáveis sócio-econômicas e demográficas dos óbitos de crianças menores de um ano registrados no Sistema de Informações sobre Mortalidade do Brasil
(1996/2001).Cad Saúde Pública 2006; 22: 673-84.
15. SchrammJMA,SzwarcwaldCL.Sistemahospitalar
como fonte de informações para estimar a mortalidade neonatal e a natimortalidade. Rev Saúde Pública 2000; 34: 272-9.
16. Almeida MF, Alencar GP, Schoeps D. Sistema de Informações sobre Nascidos Vivos – Sinasc: Uma Avaliação de sua Trajetória. In: A Experiência Brasileira em Sistemas de Informação em Saúde – Produção e Disseminação de Informações sobre Saúde no Brasil (Vol I). Brasília; Ministério da Saúde; 2009. 148p. Ilust.
17. MelloJorgeMHP,LaurentiR,GotliebSLD.Análiseda
qualidade das estatísticas vitais brasileiras: a experiência
deimplantaçãodoSIMedoSINASC.Ciência & Saúde Coletiva 2007; 12: 643-54.
18. MathersCD,FatDM,InoueM,RaoC,LopezAD. Countingthedeadandwhattheydidfrom:an
assessment of the global status of cause of death data.
Bull World Health Organ 2005; 83: 171-7.
19. SetelPW,SankohO,RaoC,VelkoffVA,Mathers C,GonghuanY,etal.Sampleregistrationofvital
events with verbal autopsy: a renewed commitment to measuring and monitoring vital statistics. Bull World Health Organ 2005; 83: 611-7.
20. TeixeiraCLS,KleinCH,BlochKV,CoeliCM.
Reclassificação dos grupos de causas prováveis dos óbitos de causa mal definida, com base nas Autorizações de Internação Hospitalar no Sistema Único de Saúde,
EstadodoRiodeJaneiro,Brasil.Cad Saúde Pública 2006; 22: 1315-24.
21. CostaMR,MarcopitoLF.Mortalidade por causas mal definidas, Brasil, 1979-2002, e um modelo preditivo para idade. Cad Saúde Pública 2008; 24: 1001-12.
22. RozmanMA,ElufNetoJ.Necropsiaemortalidadepor
causa mal definida no Estado de São Paulo. Rev Panam Salud Publica 2006; 20: 307-13.
23. SantoAH.Causasmaldeinidasdemorteeóbitossem
assistência. Rev Assoc Med Bras 2008; 54: 23-8.
24. FriasPG,PereiraPMH,AndradeCLT,SzwarcwaldCL.
25. Viacava, F. Informações em saúde: a importância dos inquéritos populacionais. Ciência & Saúde Coletiva
2002; 7: 607-21.
26. FriasPG,VidalSA,PereiraPMH,LiraPIC,VanderleyLC.
Avaliação da notificação de óbitos infantis ao Sistema de Informações sobre Mortalidade: um estudo de caso. Rev Bras Saúde MaternInfant 2005; 5(1): 43-52.