AbstrAct: The aim of this study was to apply methodological procedures to determine the prevalence of adequacy of Iron and vitamin C in children’s diets. It was included 238 children aged 2 to 3 years enrolled in 2009 in 25 day care centers in the municipality of Rio de Janeiro. Dietary intake was assessed by weighing the food and food record. Assessing the prevalence of nutrient adequacy took into consideration the individual and the group. The best estimate of the needs of the individual is given by the estimated average requirement (EAR), since we do not know the true needs of the individual who is being evaluated. To estimate the need of the group method was used EAR as the cutof. The prevalence of adequacy of iron and vitamin C in children’s diets was 91.2 and 62.2%, respectively. All necessary to achieve the method EAR as the cutof were used, but became unviable the adjustment of the observed consumption data to estimate the distribution of usual intake in this group. We conclude that the study of probability of adequacy of habitual diet in iron and vitamin C in the age group in question was only possible with the use of procedures for the individual.
Keywords: Anemia, Iron-Deiciency. Child, preschool. Food consumption. Iron. Ascorbic acid. Dietary reference intake. Day care center.
A study on the prevalence of adequacy of Iron
and Vitamin C in children’s diets
Estudo de prevalência de adequação de Ferro e Vitamina C em dietas infantis
Roseane Moreira Sampaio BarbosaI, Natasha Gabrille de Araujo PeixotoII, Alessandra da Silva PereiraII, Cristiane Bastos Leta VieiraIII, Eliane Abreu SoaresIV, Haydée Serrão LanzillottiII
IEmília de Jesus Ferreiro School of Nutrition, Universidade Federal Fluminense - Niterói (RJ), Brazil. IIUniversidade do Estado do Rio de Janeiro – Rio de Janeiro (RJ), Brazil.
IIIUniversidade Federal do Rio de Janeiro – Rio de Janeiro (RJ), Brazil.
IVJosué de Castro Institute of Nutrition, Universidade Federal do Rio de Janeiro – Rio de Janeiro (RJ), Brazil.
Corresponding author: Roseane Moreira Sampaio Barbosa. Rua Correia Dutra, 117/402, Ipanema, CEP: 22210-050, Rio de Janeiro, RJ, Brazil. E-mail: [email protected]
INTRODUCTION
The prevalence of iron deiciency anemia in preschoolers is one of the concerns in public health. A study conducted in daycare centers with children under ive years of age in the city of Rio de Janeiro presented a prevalence of 47.3%1.
The Ministry of Health2 has implemented, among others, the National Program for Iron
Supplementation, along with the mandatory fortiication of wheat and corn lour with Iron and Folic Acid, and nutritional orientation, which constitute the set of strategies that aim at controlling and reducing iron deiciency anemia in the country. The main point of this nutritional orientation is the concern with the bioavailability of Iron from vegetables, as its absorption is favored in the presence of Vitamin C and hindered in dairy foods due to the presence of Calcium, and also in foods that are rich in phytates3. The Ministry of Health4
also recommends that children be breastfed at least until six months of age.
Data from the 2002 – 2003 Family Budget Survey (FBS) point to an increase in the consumption of industrialized products, which are rich in saturated fat and monosaccharaides, and to a decrease in the intake of greens, fruits, legumes and cereals. Legumes, a source of Iron from vegetables, need to be ingested with Vitamin C in order to make Iron bioavailable3.
However, upon observing the consumption of black beans in the FBSs, a reduction of 30% was veriied between the periods of 1974 – 1975 and 2002 – 20035,6.
resumO: O objetivo deste estudo foi aplicar procedimentos metodológicos para determinar a prevalência de adequação de ferro e vitamina C em dietas infantis. Foram incluídas na amostra 238 crianças de 2 e 3 anos matriculadas no ano de 2009 em 25 creches no município do Rio de Janeiro. O consumo alimentar foi avaliado por pesagem de alimentos e registro alimentar. Para avaliação da prevalência de adequação de um nutriente levou-se em consideração o indivíduo e o grupo. A melhor estimativa das necessidades do indivíduo é dada pela necessidade média estimada (EAR), já que não se conhece a necessidade verdadeira do indivíduo que se está avaliando. Para estimar a necessidade do grupo foi utilizado o método da EAR como ponto de corte. A prevalência de adequação de ferro e vitamina C nas dietas infantis para cada criança foi de 91,2 e 62,2%, respectivamente. Foram utilizadas todas as premissas necessárias à consecução do método da EAR como ponto de corte, porém tornou-se inviável o ajustamento dos dados de consumo observado para estimar a distribuição do consumo habitual neste grupo. Conclui-se que o estudo de probabilidade de adequação da dieta habitual em ferro e vitamina C no grupo etário em apreço só foi possível com a utilização dos procedimentos destinados ao indivíduo.
Evaluating food consumption among children is a fundamental tool to plan initiatives of health promotion and prevention of iron deiciency anemia in groups at risk.
A document of the Institute of Medicine7 presents two methods to apply the DRI
(Dietary Reference Intake) in dietary assessments, with calculations of the probability of adequacy/inadequacy for groups in Appendix E, and also for individuals. However, there is a more marked scarcity of works produced with the purpose of showing the distribution curves of these nutrients with gross and adjusted data, thus indicating the probability of adequacy/inadequacy in population groups. The purpose of this study was to determine the prevalence of adequate ingestion of Iron and Vitamin C in the diets of preschoolers by considering both methods described above.
METHODOLOGY
This study is part of a project linked to the line of research Nutrition and Life Quality, conducted at Universidade do Estado do Rio de Janeiro. It was approved by the Ethics Committee of Pedro Ernesto University Hospital (794-CEP/HUPE), and it complies with Resolution 196/96 of the National Health Council8. The participants were children whose
legal guardians signed the informed consent form.
This is a cross-sectional study carried out in 2009. We included in the sample 238 children from 2 to 3 years of age, enrolled for the same school period in 25 full-time daycare centers — 21 private and 4 public — in the city of Rio de Janeiro. The inclusion criterion was the absence of chronic diseases that could interfere with their nutritional status. The initial proposal was to include all the children enrolled in the daycare centers. However, this was not possible due to the refusal of some legal guardians to keep a food journal that would complement the dietary survey. For this reason, the participants composed a pilot sample for which we calculated precision by considering the average of Iron and Vitamin C intake9.
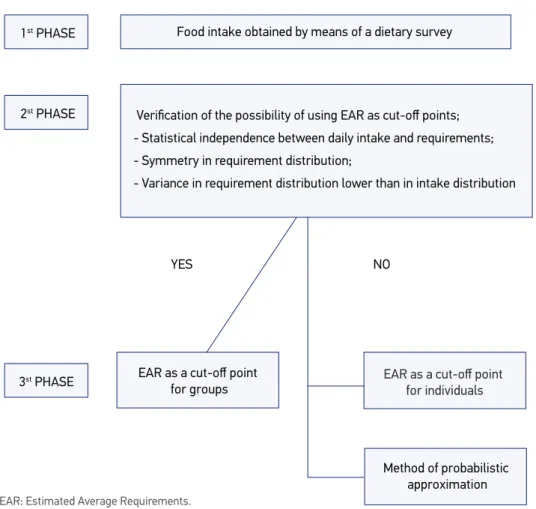
Figure 1 displays our methodological procedures.
During phase 1, the food consumption of the preschoolers while at the daycare centers was obtained by means of directly weighing their food on three nonconsecutive days and analyzing the nutritional composition of the meals.
In order to quantify the foods and preparations consumed at the daycare centers, the solids were weighed with a digital scale that had a maximum capacity of 2 kg, graduation of 1 g, tare function, and automatic actuation. The liquids were measured with the aid of graded containers and registered on a specific form before being offered to the children. The foods that had their quantity or volume stated on their labels/ packages were not weighed.
When there were leftovers at the end of each meal, we weighed what was left on the plate or cup of each child. To obtain the amount of each component of the meals ofered, we considered the weight of the leftovers in proportion to the weight of the foods initially portioned and included in the meal. In case the children selected which components were part of the meal ofered, the leftovers were calculated by the diference between the total weight of the meal and the foods selected. Next, we calculated the percentage of each component’s participation in the mix. The individual food ingestion of each preparation was obtained through the formula:
Individual food ingestion = portion ofered – leftovers
With the purpose of complementing the assessment of the children’s daily ingestion, their legal guardians kept a food journal. They were oriented to write down the foods and
Food intake obtained by means of a dietary survey 1st PHASE
2st PHASE
EAR as a cut-of point for groups
YES NO
Method of probabilistic approximation 3st PHASE
Veriication of the possibility of using EAR as cut-of points; - Statistical independence between daily intake and requirements; - Symmetry in requirement distribution;
- Variance in requirement distribution lower than in intake distribution
EAR as a cut-of point for individuals
Figure 1. Architecture of the methodological procedures.
beverages ingested by the children before and after daycare. These foods were described in household measurements and later converted into grams and milliliters. The parents or legal guardians were contacted whenever we had doubts about the foods recorded.
A quantitative evaluation of the nutritional composition of the children’s diets was conducted with the aid of the program Diet Pro version 4.010, information displayed on
labels, and the Brazilian Food Composition Table11.
Phase 2 comprised the veriication of the possibility of using the procedures listed on the Estimated Average Requirements (EAR) as a cut-of point of adequacy of Iron and Vitamin C in the group of children, according to the presuppositions displayed on Figure 1. In case all the presuppositions were conirmed, the EAR method would be used as a cut-of point for the groups. Otherwise, we would opt for the “EAR as the cut-of point for individuals”.
With the purpose of verifying whether the nutrients’ consumption and requirements were independent statistically, we opted for the graphic method proposed by Bland & Altman12.
This method is based on the premise that there is no obvious relation between the diferences of values obtained from two matrices yielded by the application of diferent procedures. Under these circumstances, a lack of concordance can be identiied by calculating potential biases estimated through the average of the diferences and their respective standard deviation. The authors argue that what is sought is a concordance between the matrices, and not an association. According to this proposal, the diference between the matrices’ values show the distance between the latter, which represent concordance or independence13.
The symmetry in the distribution of requirements was veriied by asymmetry coeicient percentiles14. Regarding the last premise — namely that variances in the distribution of requirements
would be small in relation to consumption distribution — our point of departure was the coeicient of variation (CV) established for the age range from 1 to 8 years15 at 40% and 10% for Iron and
Vitamin C, respectively. Next, we calculated the standard deviation using the EAR and the variances. The use of the EAR method as a cut-of point for the groups followed the sequence explained below16:
a) We veriied the Gaussian behavior of the consumption distribution of the nutrients in question using Kolmogorov-Smirnov’s test (K test). If normal, we carried on the procedure; if not, the variables were transformed into Napierian logarithms. The K test was again applied to the converted variables. The gross values of the variables with normal distribution were used; for those with normal distribution after the aforementioned transformation, we used logs;
b) Estimates of intrapersonal (S2w) and interpersonal (S2b) variances, calculated through
the analysis of the variance (one-way ANOVA) of consumption per individual during three days.
Ratios:
Intrapersonal variance: S2
W = QMw
Interpersonal variance: QMb=S2
b = (QMb –S 2
In which:
QMw: Intrapersonal quadratic mean S2
W: Intrapersonal variance
QMb: Interpersonal quadratic mean S2
b: Interpersonal variance
K: number of days of dietary survey of each individual;
c) Calculation of the ratio between interpersonal and observed standard deviations:
Sb / Sobs = 1 / [(1 + S2
W / K * S 2
b)] 1/2;
d) Calculation of the mean ingestion of the nutrients, considering the K days of survey for each individual;
e) Adjustment of the observed mean ingestion of the nutrients for each individual:
Adjusted variable of the nutrient = mean + (xi – mean) * Sb / Sobs
In which:
Mean: represents the group’s consumption average Xi: the value observed for each individual.
This adjustment in the observed consumption distribution was necessary so as to remove day-to-day consumption variability (intrapersonal variability). The results estimated the habitual consumption distribution, thus better relecting interindividual variability within the group;
f ) Reconversion of log variables into original units;
g) Adjusted distribution of the nutrients;
h) Calculation of the prevalence of inadequacy in the population group: proportion of individuals in the group whose habitual intake was below the EAR established for the nutrient;
i) Calculation of the probability of inadequacy given by the area under the normal curve, which corresponds to the proportion of individuals with consumption adequacy/inadequacy12:
Z = (mean – EAR) / sd; in which sd: standard deviation.
The needs varied among the individuals, even when they were in the same stage of life and were of the same gender. Therefore, it is important to take this variability into account, given by the nutrient’s CV. For analytical purposes, in the present study we opted for using a CV of 10% for the nutrients, as suggested by the Food and Nutrition Board of the Institute of Medicine (IOM/DRI)16,17.
In order to calculate the “apparent adequacy”18 of the nutrients, we used a statistical
approach that enables estimates of the degree of conidence at which the intake of nutrients fulills the individual’s needs. With this approach, we compared the diference between the average of “n” days of consumption (the best estimate of habitual intake) and the EAR. The equation devised also takes into account the variability of the individuals’ necessities (Vnec) and day-to-day intrapersonal variation (Vint). The result is a Z score through which the probability that a diet is adequate is determined. We considered an individual “apparent ingestion”18 adequate when the probability was higher than 0.717.
Z= D / DPp = Mean of “n” days of consumption – EAR / root (Vnec + Vint / n)
In which:
Vnec: variability of the individuals’ necessities;
Vint: interpersonal variance, obtained from North American population studies7;
n: number of days in which the individual’s ingestion was assessed.
In the third phase, we used the method of probabilistic approximation only for Iron, since the requirements for Vitamin C distribution were unavailable. The statistical method of probabilistic approximation (risk curve) combines the requirements for distribution and the individual’s ingestion in order to verify the probability of risk for iron deiciency anemia.
In the construction of the risk curve, the requirements for Iron were given by the ordinate, and the probability of risk for iron deiciency anemia by the abscissa. Iron deiciency anemia was outlined here based on the estimated percentiles of distribution of the requirements for iron (mg/d) for children, adolescents and adults, available in Appendix I, table I-315, where the estimated percentiles are P
2,5; P5,0; P10; P20; P30; P40; P50 (EAR); P60; P70;
P80; P90; P95 (Recommended Dietary Allowance – RDA), and the intervals follow a succession in tens. The last two percentiles are allocated at 95 and 97.5. Each percentage point is followed by the required amount of Iron in milligrams. The risk expressed on the abscissa created in the present study corresponds to each percentile cut-of point divided by 100, as the probability of occurrence had to be described between 0.00 and 1.00.
RESULTS
The mean amount of Iron and Vitamin C consumed during the three days of observation was 6.25 mg and 18.52 mg, respectively. The relative error of the estimates of mean Iron consumption reached 4.37% (CV = 34.43%); for Vitamin C, it reached 8.64% (CV = 67.99%). These indings denote a high variability for both nutrients, more expressively for Vitamin C.
It was only possible to verify the presupposition about the independence between consumption and requirements in the case of Iron15,19, as there were no available data
regarding Vitamin C. For this purpose, we used the children’s mean Iron intake.
As displayed on Figure 2 — Bland and Altman’s dispersion diagram12 — we veriied that
all diferences rested below -1, with an expressive distance from 0, thus indicating dependence between consumption and daily requirements.
Upon veriication of the symmetry of Iron requirements, the percentile coeicient of asimmetry14 reached 0.22, which indicates that its distribution is approximately symmetrical.
The variance of the distribution of Iron requirements (1.44 mg) was small in relation to the distribution of consumption (4.20 mg). The only presupposition that was rigorously met pertained to the variance of the distributions.
Diference versus mean
1 2 3 4 5 6 7 8 9 10
-5 -4 -3 -2 -1 0 1
Diference
Mean
-0.89
-4.59
Figure 2. Diference versus mean, considering Iron consumption and requirements.
Table 1. Proile of food intake of the children at the daycare centers during three non-consecutive days.
Nutrients Statistics Minimum – Maximum Median Mean (SD) Variance of varianceCoeicient 95%CI
Iron
Intake 1 0.70 – 13.63 6.86 6.23 (2.15) 4.64 34.56 0.27
Intake 2 0.60 – 16.61 7.10 6.20 (2.28) 5.19 36.72 0.29
Intake 3 0.80 – 15.95 6.95 6.30 (2.20) 4.86 35.00 0.28
Mean of
the 3 days 0.70 – 15.39 6.73 6.25 (2.15) 4.62 34.43 0.27
Vitamin C
Intake 1 3.80 – 78.31 15.04 17.33 (9.88) 97.71 57.03 1.26
Intake 2 2.80 – 128.09 15.12 18.46 (15.18) 230.34 82.22 1.93
Intake 3 3.10 – 155.17 14.96 19.76 (17.38) 302.05 87.96 2.21
Mean of
the 3 days 3.23 – 106.36 15.00 18.52 (12.59) 158.51 67.99 1.60
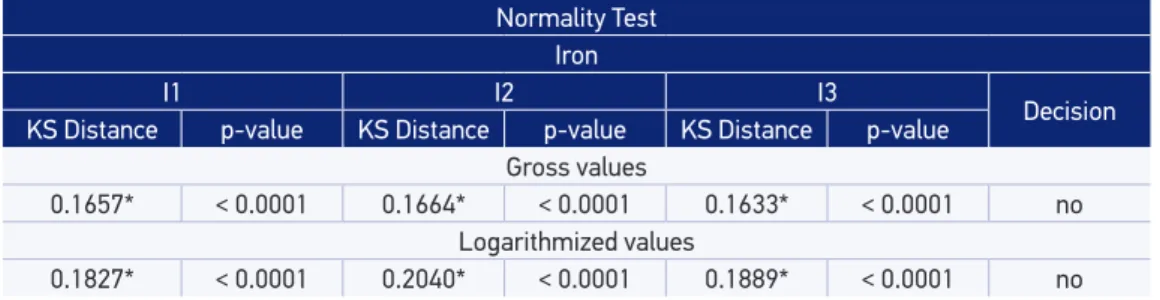
We initiated the procedure of applying the EAR as a cut-off point for groups by verifying the Gaussian behavior of the distribution of Iron intake (Table 2). The results show that the intake distribution during the three days of observation did not meet the requirements of the method, even though we attempted to convert the distributions into logarithms.
In light of this, we proceeded to establish adequacy individually. Considering a cut-of point higher than 0.70 as the probability of adequacy17, we found that 70.0% and 7.9% of
the children had adequate intakes of Iron and Vitamin C, respectively.
Figure 3. Risk curve for Iron.
Iron
0 1 2 3 4 5 6 7 8
0.00 0.25 0.50 0.75 1.00
Daily requirement
Riskvalue
Table 2. Statistical procedures inherent to the method.
Normality Test Iron
I1 I2 I3
Decision
KS Distance p-value KS Distance p-value KS Distance p-value
Gross values
0.1657* < 0.0001 0.1664* < 0.0001 0.1633* < 0.0001 no
Logarithmized values
0.1827* < 0.0001 0.2040* < 0.0001 0.1889* < 0.0001 no
*signiicant; KS: Kolmogorov-Smirnov.
Table 3. Prevalence of adequacy and inadequacy of Iron and Vitamin C in the children’s diets (n = 238).
Probability of adequacy Discrimination
Nutrients %
Vitamin C Iron
Recommended Dietary Allowances (p ≥ 0.98)
Adequate 0.4 2.5
Estimated Average Requirements (p = 0.50 to p < 0.98) 61.8 88.7
Table 3 presents the prevalence of adequacy and inadequacy according to the EAR and the RDA. Considering the latter, the prevalence of adequacy was expressively low both for Vitamin C and Iron.
Figure 3 displays the risk curve for Iron. To verify this probability of risk, the intake was placed on the ordinate that expresses requirements, and a perpendicular line was traced until it touched the curve. At this point, a line was traced in parallel to the ordinate. The point that touches the abscissa indicates the probability of risk.
Drawing on the graphic (Figure 3), it was possible to estimate the risk for Iron consumption by tracing up a perpendicular line that started at the abscissa until it touched the curve and a parallel line was drawn from this intersection point to the ordinate. For instance, a child in the group studied who presented a mean Iron consumption of 2.73 mg in three days of observation had a probability of inadequacy of 0.625.
DISCUSSION
In the present study, the mean Iron and Vitamin C intake in the three days of observation was 6.25 mg (CV = 34.43) and 18.52 mg (67.66), respectively. In an interventional study carried out with data from a large transversal survey in the city of São Paulo between September 1995 and September 1996, the authors found an Iron intake of 7.7 mg in the control group and of 7.6 mg in the intervention group before the intervention, as recorded on food journals, both with CV = 5%20. Comparing these indings, it is possible to verify a
high variability in Vitamin C consumption17. In another study, of a longitudinal nature, in
which the participants were 35 children between 2 and 3 years of age of both sexes, enrolled in a philanthropic daycare center in Ilha de Paquetá, Rio de Janeiro from 2003 to 2004, the authors found an Iron intake of 5.1 ± 1.7 mg (p < 0.001; CV = 33%) and a Vitamin C intake of 31.5 ± 25.5 mg (p < 0.001; CV = 81%)21. These values are approximate to the ones found
in the present study, and reairm the variability in the consumption of both nutrients. The guidelines of the Subcommittee for DRI Interpretation and Use alert that the RDA should not be used as a cut-of point to assess nutrient intake in groups, as this level of consumption exceeds the requirements of 97 to 98% for all individuals whenever the requirements within a group have normal distribution. This recommendation aims at avoiding overestimates of the proportions in groups at risk for inadequacy19.
In this sense, it is necessary to use the methods in question, probabilistic approximations, and the EAR as cut-of points to assess the prevalence of inadequacy of nutrient intake.
Both methods demand independence between daily ingestion and requirements. In order to evaluate this premise, in the case of Iron, we used Bland & Altman’s method12,
as its advantage is that the matrices of the data are exempt from Gaussian behavior, and a minimum of 10 measurements in pairs can be used22. The requirement measurements
It is observable that all diferences are within the interval ranging from -4.59 to -0.89, which is quite distant from a null diference, thus indicating independence between requirement and ingestion (Figure 1). However, using the deviation ratio proposed by Delcourt13, we
cannot airm this independence.
The percentile coeicient of asymmetry for Iron points to an approximately symmetrical distribution of Iron requirement (0.22), inferred from its position in relation to the EAR. The daily requirements for Iron include the necessary amounts to replace fecal and dermatologic elimination, and this aspect might have symmetrically afected Iron distribution in the population of reference. In case of lack of additional information about the requirement distribution of a given nutrient, it is implicitly assumed on DRI reports that the unknown distribution is considered symmetrical, based on median requirements – EAR. Thus, when the fact that a certain requirement distribution is asymmetrical comes to light, a probabilistic approach can be used to compute a risk curve that relects an asymmetrical requirement. The guidelines of the Subcommittee for DRI Interpretation and Use reveal that moderate asymmetry values in requirement distribution can result in noticeable biases when estimating prevalences by means of cut-of point methods7.
Although presuppositions of symmetry in the requirement distribution of a given nutrient and the independence between consumption and necessity are assumed in the DRI’s document7, we veriied all presuppositions. It is worth highlighting that this premise
originated from population studies with larger samples than the one presented here. In the case of Iron, the EAR is determined by a factor model based on median components of its requirement for men and women. In the case of children, gender is ignored, as the diferences are small. Taking Vitamin C into account, the RDA was established with a coeicient of variation of 10%. The EAR can be estimated by dividing the RDA by 1.2018.
Both were established based on the recommendations for adults, according to body weight. In this study we also took care of verifying the Gaussian behavior of the distributions of the ingestion observed; when it was absent, we adopted logarithmic normal distribution, which was the particular case of Vitamin C. However, the normality test did not allow for considerations of the Gaussian behavior of the consumption curves, preventing us from using the method for groups which enables the displaying of the gross and adjusted distributions of a nutrient’s intake.
Although daycare centers ofer institutionalized meal services, the variance in Iron consumption, considering the three days of ingestion, was 4.62 mg (Table 1). The variance of distribution to determine Iron requirements is 1.44 mg. Situations in which the variance of distribution to determine Iron requirements is higher than the variance of its consumption — which is not the case in this study — are related to the monotony of the menus, since the portions served are controlled7. It is important to highlight that the mean Iron consumption,
considering the three days of ingestion, was between the values of the EAR (4.1 mg) and of the RDA (7 mg)15, which ensures at least 50% of the nutritional recommendations for
With the information obtained, we constructed the risk curve for Iron. However, it was not possible to construct it for Vitamin C, in view of the lack of available research data that could be the basis for establishing the EAR for the 1 to 18-year age range. Consequently, the requirement distribution is also not available for this population. The EAR for children and adolescents was estimated by adjusting the data for adults and based on diferences in reference weights7.
The EAR method as a cut-of point is valid when the prevalence of inadequacy in a given population is higher than 8 to 10%, or lower than 90 to 92%7. In this study, we veriied a
prevalence of inadequacy of 37.8% and 8.8% (Table 3) for Vitamin C and Iron, respectively. These indings suggest validity only in the case of Iron.
In regards to the quality of the data on dietary consumption, we must point out some obstacles, as tables that display food composition do not include Iron and Vitamin C in a large number of fortiied industrialized foods, wheat lour, and cornmeal23. This problem
is aggravated by the non-regulated addition of these nutrients to food products, especially those directed to children. Possible interferences with the calculations of the adequacy of Iron and Vitamin C are due to overestimates of consumption.
Information on the food ingestion that occurred at the daycare centers was obtained by means of direct weighing, complemented by food journals in which the foods consumed at home or out were registered using household measures. In Brazil, there are no norms that determine the standardization of utensils, which may have contributed to biases in the intake observed. Fisberg et al.18 highlight that, despite the complexity of assessing diets, and
keeping in mind the recognized imperfection of dietary surveys, this method can provide data that are indispensable in pinpointing dietary conducts. On the other hand, we did not investigate the consumption of vitamin and mineral supplements that were potentially included in the diets24.
CONCLUSION
The use of EAR as a cut-of point applied to individuals identiied that 62.2% and 91.2% of the children have adequate amounts of Vitamin C and Iron in their diets, respectively. According to the EAR, this is an expected result. In relation to the RDA, the percentages reached 0.4 and 2.5.
The DRI represent the most thorough set of nutrient reference values developed for planning and assessing habitual food intake. Considering that we used the methods suggested by the Subcommittee for DRI Interpretation and Use, this study contributes in assisting professionals who work in the ield of Public Health Policies.
REFERENCES
1. Matta IEA, Veiga GV, Baião MR, Santos MMAS, Luiz RR. Anemia em crianças menores de cinco anos que freqüentam creches públicas do município do Rio de Janeiro, Brasil. Rev Bras Saude Mater Infant 2005; 5(3): 349-57.
2. Brasil. Ministério da Saúde. Secretaria de Atenção à Saúde. Departamento de Atenção Básica. Manual operacional do Programa Nacional de Suplementação de Ferro. Brasília: Ministério da Saúde; 2005.
3. Cozzolino SMF. Biodisponibilidade de nutrientes. Barueri: Manole; 2005.
4. Brasil. Ministério da Saúde. Dez passos para uma alimentação saudável: Guia Alimentar para crianças menores de 2 anos. Brasília: Ministério da Saúde; 2002.
5. Instituto Brasileiro de Geograia e Estatística. Estudo Nacional da Despesa Familiar. Consumo alimentar – antropometria. Rio de Janeiro; 1977.
6. Instituto Brasileiro de Geograia e Estatística. Pesquisa de Orçamentos Familiares: análise da disponibilidade familiar de alimentos e do estado nutricional no Brasil. Rio de Janeiro; 2004.
7. Institute of Medicine. Dietary reference intakes: Applications in Dietary Assessment. Washington, DC: National Academies Press; 2000.
8. Brasil. Ministério da Saúde. Conselho Nacional de Saúde. Resolução nº 196 de 10 de outubro de 1996. Brasília: Ministério da Saúde; 1996.
9. Rodrigues PC. Bioestatística. Niterói: EdUFF; 2002.
10. Bressan J. Sistemas de suporte à avaliação nutricional
e prescrições de dietas [c-rom]. Agromídia Software – DietPro; 2003.
11. Universidade Estadual de Campinas. Núcleo de Estudos
e Pesquisa em Alimentação. Tabela Brasileira de Composição de Alimentos – TACO – Segunda edição. Campinas: NEPA-UNICAMP, 2006.
12. Bland JM, Altman DG. Statistical methods for
assessing agreement between two methods of clinical measurement. Lancet 1986; 1(8476): 307-10.
13. Delcourt C, Cubeau J, Balkau B, Papoz L. Limitations
of the correlation coeicient in the validation of diet assessment methods. CODIAB-INSERM-ZENECA Pharma Study Group. Epidemiology 1994; 5(5): 518-24.
14. Spiegel MR. Estatística: resumo da teoria, 875 problemas
resolvidos, 619 problemas propostos. São Paulo: McGraw-Hill; 1977.
15. Food and Nutrition Board/Institute of Medicine - FNB/
IOM. Dietary reference intakes for Vitamin A, Vitamin K, Arsenic, Boron, Chromium, Copper, Iodine, Iron, Manganese, Molybidenum, Nickel, Silicon, Vanadium, and Zinc. Washington: National Academies Press; 2001.
16. Motulsky H. Prism 4 Statistics Guide: Statistical
analyses for laboratory and clinical researchers. San Diego: Graph Pad Sofware Inc.; 2003.
17. International Life Science Institute. Usos e aplicações
das Dietary Reference Intakes – DRIs. São Paulo: ILSI/ SBAN; 2001.
18. Fisberg RM, Slater B, Marchioni DML, Martini LA.
Inquéritos alimentares: métodos e bases cientíicos. São Paulo: Manole; 2005.
19. National Research Council. Dietary reference intakes
for Vitamin C, Vitamin E, Selenium, and Carotenoids. Washington: National Academies Press; 2000.
20. Monteiro CA, Szarfarc SC, Brunken GS, Gross R, Conde
WL. A prescrição semanal de sulfato ferroso pode ser altamente efetiva para reduzir níveis endêmicos de anemia na infância. Rev Bras Epidemiol 2002; 5(1): 71-83.
21. Barbosa RMS, Soares EA, Lanzillotti HS. Avaliação
da ingestão de nutrientes de crianças de uma creche ilantrópica: aplicação do consumo dietético de referência. Rev Bras Saúde Mater Infant 2007; 7(2): 159-66.
In a relation of causality, the suicient cause — that is, nutritional deiciencies — will be present when an illness occurs. In this sense, the nutrients Iron and Vitamin C were privileged here, in view of the scenario of iron deiciency anemia in Brazil, and considering that Vitamin C stimulates the absorption of heme and non-heme Iron. However, if the food intake of Iron is inadequate (necessary cause), serum concentrations are compromised even when iron deiciency anemia does not occur (hidden hunger).
22. Martelli Filho JA, Martagliati LA, Trevisan F, Gil CTLA. Novo método estatístico para análise da reprodutibilidade. Rev Dent Press Ortodon Ortopedi Facial 2005; 10(5): 122-9.
23. Brasil. Agência Nacional de Vigilância Sanitária.
Resolução RDC no 344, de 13 de dezembro de 2002.
Aprova o Regulamento Técnico para a Fortiicação das Farinhas de Trigo e das Farinhas de Milho com Ferro e Ácido Fólico. Brasília: Diário Oicial da União; 2002.
24. Hallberg L, Hulthén L. Prediction of dietary iron
absorption: an algorithm for calculating absorption and bioavailability of dietary iron. Am J Clin Nutr 2000; 71(5): 1147-60.
Received on: 04/01/2011