Food lists from the diet of a
group of elderly individuals:
Analysis and perspectives
Angélica M de Pina Freitas
ISonia Tucunduva Philippi
ISandra Maria Lima Ribeiro
IIIFaculty of Public Health- University of São Paulo (FSP/USP)- São Paulo, Brazil.
IISchool of Arts, Sciences and Humanities- University of São Paulo (EACH)- São
Paulo- Brazil.
Correspondence: Sandra Maria Lima Ribeiro. Escola de Artes, Ciências e Humanidades da Univer-sidade de São Paulo. Av. Arlindo Bettio, 1000, Ermelino Matarazzo - São Paulo,SP - CEP 03828-000. E-mail: [email protected]
Abstract
Background: Despite the phenomena of population aging, Brazilian studies related to the feeding practices of elderly individuals are scarce. Aims: To develop a list of the most ingested foods from community-dwelling elderly persons in the east-zone of São Paulo- Brazil and to analyse the foods that contribute most to relevant health-related nutrients of these individuals. Methods: The study was per-formed with100 individuals aged 60 years and above, registered at a local reference center. To describe the nutritional status, the weight and stature were measured and the BMI- body mass index was calculated. To develop the food lists, two 24h food recalls were applied, during two different seasons of the year. The food recalls were analysed for food intake frequency and for percen-tage contribution of each food and each nutrient: energy, macronutrients, calcium and vitamin D. Results: The participants were classiied as following: 52% with BMI
≤ 28 kg/m2; 15% with BMI between 28 and 30 kg/m2; 26% between 30 and 35 kg/m2 and 7% presented BMI> 35 kg/m2. The positive aspects related to food intake were rice, bean and green vegetable consumption. As negative aspects, we observed that the diet pattern was repetitive, since few foods contributed to a high number of nutrients. Furthermore, a high ingestion of reined car-bohydrates was observed instead of whole foods. Conclusion: The food lists allowed relecting on educative interventions, and also allow future development of different food frequency questionnaires that are speciic for this group.
Introduction
According to the year 2000 Brazilian Census, elderly people constitute 14.5 million of persons, double that of the 1980 Brazilian Census. In percentages, individu-als above 60 years increased from 4.2%, in 1950, to 8.6% in 2000, and are predicted to reach 14.2% in 2020. São Paulo is the fourth city in numbers of elderly, and a high num-ber of this population is located at the East Zone of the City1. These data clearly show a need for researching and understanding the aging processes, with the aim of thinking about strategies for interventions directed at this populational group.
Aging is known to be a process of phy-siologic, psychological and social changes, which happen throughout the life2. These changes have effects on the nutritional status, which in turn are related to health3. Is this context, a healthy diet and, conse-quently, the maintenance of an adequate nutritional status is important for health and, therefore, to successful aging4,5.
A healthy diet embraces different foods from animal and vegetal sources, which are quantitatively adequate for individuals6. The Food Guide directed to Brazilian Population6, despite its relevance, did not establish any speciic reference for the elderly. It is impor-tant to highlight that food recommendations for the elderly should take into account the changes related to this life stage, including an enhanced risk of chronic diseases such as hypertension, diabetes, dislipidemic status, osteoporosis, amongst others7.
The nutritional evaluation of the elderly should include, therefore, a detailed ana-mnesis regarding physical modiications observed and/or referred8. Nutritional assessment include different methods and techniques, of these the evaluation of food intake deserves special attention. The 24h-food recall (R24h) and the 24h-food frequency questionnaire (FFQ) are the most adopted methods in epidemiologic studies. R24h is a retrospective method where the subject describes all the food ingested in the pre-vious day9,10. In turn, FFQ is composed of
one list of foods followed by their respective frequency of intake (in days, weeks, months or years); some FFQ may describe the size of servings11. FFQ have the advantage of being self-applicable, besides the fact of being practical and fast. As such, a number of studies have adopted this tool.
One of the recommended steps in deve-loping a FFQ is a previous development of a food list, which needs a previous R24h as a reference. In order to develop a food list, it is necessary to take into account the foods that represent the most signiicant quantities of nutrients, taking into consideration the serving size and frequency of consumption. The list should describe a suficient number of foods that can represent the food habits of the target population/group. In addition, this list should not allow answers in duplicate, which could overestimate the food intake12,13. Considering the relevance of the diet analysis for the nutritional evaluation of the elderly, and also considering the lack of this kind of analysis in the literature, the present study aimed to: - set up a list of the foods most consumed by a group of elderly people from the East Zone of São Paulo- SP- Brazil, aiming to, in the future, develop a Food Frequency Questionnaire; - analyzing and discussing the foods that contribute the most to the consumption of the relevant nutrients related to health and nutrition of the elderly.
Methods
Location of the study
All the steps of the present research (vo-lunteer recruitment, clariication of the im-portance of the study, and data collection) were performed at the Instituto Paulista de Geriatria e Gerontologia (IPGG), located at São Miguel Paulista – São Paulo – SP - Bra-zil. Therefore, we can deine the sample as convenient and non-probabilistic.
Time of the study
irst one took place during three months (from April to June, 2008). At that time, the subjects were invited and recruited, and all the explanations related to procedures, schedule of data collection, amongst others, were given. The second step occurred from August to December 2008, when the second stage of data collection was made. The pro-cedures at each step are described below.
Subject recruitment, inclusion and exclusion criteria
The invitation for elderly subjects to take part in the study was given at the place of the study. All the individuals were above 60 years, of both genders, showed willingness to take part in the study and were checked according to inclusion and exclusion cri-teria. Only the physically-independent individuals, i.e. those that were able to walk without any help, and without any reference to diseases that could impair their physical autonomy, were included. The maximum educational level accepted in the study was completed high school, although the subjects had to be literate (checked by the reading of a simple text). In addition, subjects were included only if they received a maximum income of three current minimum salaries. We excluded the elderly individuals who showed any kind of mental confusion, identiied from the double repetition (at the beginning and at the end of the interview) of the personal data that were part of the identiication iles. Those that presented any inconsistency in answering these questions were excluded. It is important to highlight that the elderly that referred any typical diseases related to aging (such as type II diabetes, dyslipidemia or hypertension) were not excluded from the study.
Ethical aspects
All the elderly signed an informed con-sent and the research project was approved by local review board (COE- São Judas Tadeu University, process number 11/08).
Procedures and data collection
During the irst step of the study, after explanations were given, the subjects answered demographic questions, and af-terwards answered questions for the R24h. The elderly were asked about all food and drink consumed during the previous day, with their respective quantities, in home measurements. The R24h data collection was achieved using mnemonic strategies, such as the memorization of the activities performed during the day, the places where the subjects were, besides the utilization of pictures regarding serving sizes14. At the time of the interviews, the elderly were scheduled for the second step of data collection.
The second step consisted of a new administration of the R24h, given by the same investigator and adopting the same procedures of the first step. The second R24h was held in order to identify possible seasonable aspects of food consumption, as suggested by Block et al12,13. The anthropo-metric data were also collected at this step. Weight and height were measured with an electronic scale (FILIZOLA 100g precision) and stadiometer (coupled to the scale, 0.5cm precision), and from these data, the body mass index (BMI= weight/height2) was calculated. The anthropometric procedures followed the recommendations of Lohman, Roche e Martorell15.
Food lists development
Considering the nutritional calculation, the foods were grouped in six different forms, that is, according to the energy con-sumption, carbohydrates concon-sumption, proteins consumption, total fat consump-tion, calcium and vitamin D consumption. These groups allow the construction of the food lists. These lists were constructed according to the percentage contribution of each food to the total energy consumed and the total consumption of each selected nutrient (in grams)12,13. These percentages of contribution were calculated following the formulae below:
% of nutrient “X” in the food “Y” = [(content of the nutrient “X” in the food “Y”)/(sum of the content of the nutrient “X” in all foods reported for the studied population)] x 100
For the construction of the food lists, we included all the foods, which when sum-med, contributed to 90% of the total energy and of each nutrient12,13.
Information regarding data collection and the interviewers
The interviewers were trained and supervised by three registered dietitians. Before the study, a pilot study was conduc-ted, where the data were collected twice: the irst time the data were collected by the interviewers, and at the second time, by the dietitians. Both data collections were che-cked for reproducibility, and discussed with regard to inconsistencies. Regarding anthro-pometric data, all the measurements were held only by the dietitians. All the dietitians were trained as follows. They performed repeated measures in the same subject until the variation between the three evaluators could be found to be as small as possible.
Results
From the 210 elderly individuals in-terviewed, 171were considered eligible for taking part in the study. Of these, 30 refused to participate and nine of them did
not present consistency in answering the interviews, which was considered by the interviewers as “mental confusion”. All the subjects itted the criteria with regard to income and schooling. Of those who took part in the irst step, only 100 attended the second step, thus only these individuals were included in the data ile.
The elderly who took part in the study were community-dwelling in Ermelino Ma-tarazo and São Miguel Paulista, borough of São Paulo City. Comparing our sample with data from the census of these regions1, the total number of elderly of our sample cor-responds to 0.3% of the population above 60 years. The majority (90% or 90 individuals) was female and only 10% was male. The age range of the subjects was from 60 to 82 years (mean ± standard deviation = 69.3 ± 5.1 years). Regarding nutritional status, 52% had their BMI calculated as ≤ 28 kg/m2; 15% had their BMI between 28 and 30 kg/m2; 26% between 30 and 35 kg/m2 and 7% > 35 kg/m2.
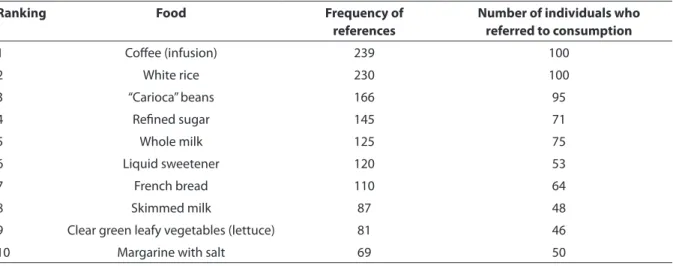
From the R24h, the foods with the hi-ghest frequency of consumption, and the number of individuals who reported each food were identiied. These results are de-picted in Table 1. We may note that the most consumed food was coffee.
Table 2 describes the foods that con-tributed the most to the energy content of the diet of the elderly. The most important contribution came from rice.
intake are described in Table 4. Chicken contributed the most to the consumption of this nutrient. Data related to fat con-sumption are presented in Table 5. Chicken contributed the most to total fat consump-tion. Importantly, whole milk and eggs also contributed to the consumption of this nutrient. Although not described in a Table, it is important to highlight that chicken was also responsible for the consumption of all kinds of fats [polyunsaturated fat (n = 76; % = 16.8) monounsaturated fat (n = 76; % = 18.3) and cholesterol (n = 76; % = 33.2)].
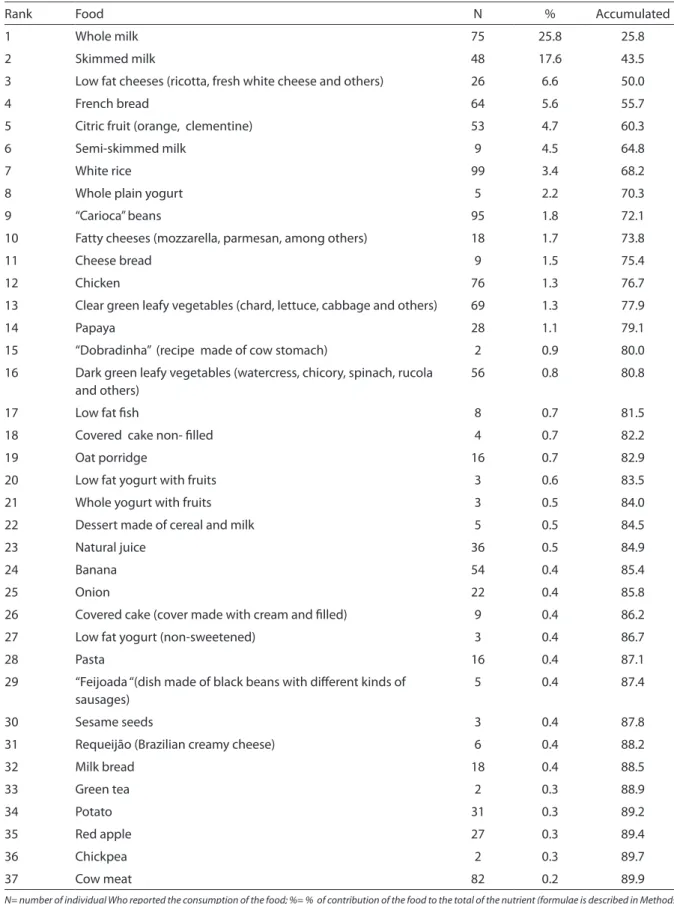
Foods that contributed to calcium intake are described in Table 6, and Table 7 depicts the intake of vitamin D. As expected, milk and dairy foods were the most important foods related to these nutrients. We can also notice that there were few foods responsible for the vitamin D intake; whole milk and skimmed milk were responsible for 56.3% of this intake.
Discussion
This study had the aim of setting up, from two previous R24h, lists of the most ingested food in community-dwelling elderly persons from the east-zone of São Paulo- Brazil and to analyse the food that contributed the most to relevant health-related nutrients of these individuals. Coffee
was de most consumed food, and this is in accordance with Brazilian and American studies: Familiar Budget Research (POF) 2002-2003 (Brazil)17 and National Health and Nutrition Examination Survey (NHA-NES II)12,13. Coffee consumption is part of Brazilian food culture, and this information was conirmed by a commercial research run by the ABIC (Brazilian Association of Coffee Industry) in 200818.
White rice and carioca beans deserve special consideration in food consumption by elderly, since these are among the most ingested foods. These foods are considered the basis of the Brazilian diet. Moreover, some studies refer to these foods as pro-tective against some diseases, such as can-cer19. Levy-Costa et al17 analyzed data from Familiar Budget Research (POF 2002-2003) and observed a trend towards a reduction of the consumption of rice and beans by the general Brazilian population. Similarly, the Food Guide to Brazilian Population6, pointed out that the contribution of rice and beans relative to total energy intake from the diet was reduced from 42.1% in 1974 to 38.7% in 2003. Otherwise, the present study showed that elderly people have preserved this food habit, which can be considered as a positive aspect when compared to the younger population.
White bread (French bread, as it is called
Table 1 - Ranking of the ten most consumed foods, according to their referred frequency and according to the number of individuals who referred to their consumption. East zone, São Paulo, 2008.
Ranking Food Frequency of
references
Number of individuals who referred to consumption
1 Cofee (infusion) 239 100
2 White rice 230 100
3 “Carioca” beans 166 95
4 Reined sugar 145 71
5 Whole milk 125 75
6 Liquid sweetener 120 53
7 French bread 110 64
8 Skimmed milk 87 48
9 Clear green leafy vegetables (lettuce) 81 46
Table 2 - Contribution to total energy intake (relative and accumulated) from 24h food recall- Individuals above 60 years- East Zone, São Paulo, 2008.
Rank Food N % Accumulated %
1 White rice 99 14.4 14.4
2 Chicken 76 6.7 21.1
3 French Bread 64 6.3 27.4
4 Whole milk 75 5.8 33.2
5 Reined sugar 71 3.3 36.5
6 Banana 54 2.9 39.3
7 Citric fruits (orange, clementine) 53 2.8 42.1
8 “Carioca” bean 95 2.6 44.7
9 Pasta 16 2.6 47.3
10 Skimmed milk 48 2.6 49.9
11 Salty biscuits (non-illed) 41 2.2 52.1
12 Potato 31 2.0 54.1
13 Filled cakes (cover made with cream and illed) 9 1.7 55.8
14 Pork sausage 17 1.4 57.1
15 Covered cake non- illed 4 1.3 58.5
16 Bread (milk variety) 18 1.3 59.7
17 Powdered fruit juice 11 1.2 60.9
18 “Dobradinha” (dish made of cow stomach) 2 1.2 62.1
19 “Feijoada” (dish made of black beans with diferent kinds of sausages)
5 1.2 63.3
20 Margarine with salt 50 1.1 64.4
21 Soft drinks 25 1.1 65.4
22 Swetened biscuits (non-illed) 20 1.0 66.5
23 Manioc scone (fried) 1 1.0 67.5
24 Red apple 27 1.0 68.5
25 Low fat cheese (ricotta, fresh white cheese, and others) 26 1.0 69.6
26 Soy oil 5 1.0 70.6
27 Whole bread 14 0.9 71.5
28 Olive oil 20 0.8 72.3
29 Papaya 28 0.8 73.1
30 Semi-skimmed milk 9 0.8 73.9
31 Avocado 4 0.8 74.7
32 Dark green leafy vegetables (watercress, chicory, spinach, rucola and others)
56 0.8 75.4
33 Cheese bread 9 0.7 76.2
34 Lean ish (whiteish) 8 0.7 76.9
35 Fortiied whole milk – “VivaLeite” 9 0.6 77.5
36 Oat lakes 18 0.6 78.1
37 Mayonnaise 6 0.5 78.6
Table 2 - Contribution to total energy intake (relative and accumulated) from 24h food recall- Individuals above 60 years- East Zone, São Paulo, 2008. (cont.)
Rank Food N % Accumulated %
39 Chicken egg 11 0.5 79.6
40 Manioc lour 9 0.5 80.0
41 Ham, Bologna, salami 13 0.5 80.5
42 Margarine without salt 14 0.4 80.9
43 Granola 5 0.4 81.4
44 Tomato 48 0.4 81.8
45 Green tea 2 0.4 82.2
46 Natural juices 36 0.4 82.6
47 Marmelade 7 0.4 83.0
48 Grape 5 0.4 83.4
49 Panettone 2 0.4 83.8
50 Chickpea 2 0.4 84.2
51 Fatty cheeses (mozzarella. parmesan. among others) 18 0.4 84.6
52 Dried beef 5 0.4 84.9
53 Instant pasta 3 0.3 85.3
54 Toasted bread 10 0.3 85.6
55 Sweets made of cereal and milk 5 0.3 85.9
56 Soy milk 11 0.3 86.2
57 Popcorn (salty) 3 0.3 86.5
58 Desserts made of pumpkins 2 0.3 86.8
59 Whole yogurt with fruits 3 0.3 87.1
60 Clear green leafy vegetables (chard, lettuce, cabbage and others)
69 0.3 87.4
61 Onion 22 0.3 87.6
62 Powdered chocolate 10 0.3 87.9
63 Crumbs 1 0.3 88.2
64 Soup made from meat 2 0.3 88.5
65 Roots and yams 5 0.2 88.7
66 Oat porridge 16 0.2 88.9
67 Biscuit (illed) 1 0.2 89.2
68 Mango 8 0.2 89.4
69 Biscuits made of manioc powder 3 0.2 89.7
70 Sausages 3 0.2 89.9
N= number of individuals Who reported the consumption of the food; %= % of contribution of the food to the total of the nutrient (formulae described in Methods)
in Brazil) made an important contribution to the intake of energy, carbohydrates, pro-tein, iber and calcium in the diet reported by the elderly. This high consumption is in accordance with studies by Block et al on the American population12,13. In Brazilian diets,
rice and bread present a high consumption, classiied as the irst and the second most consumed foods from the cereals group, according to POF 2002-200317.
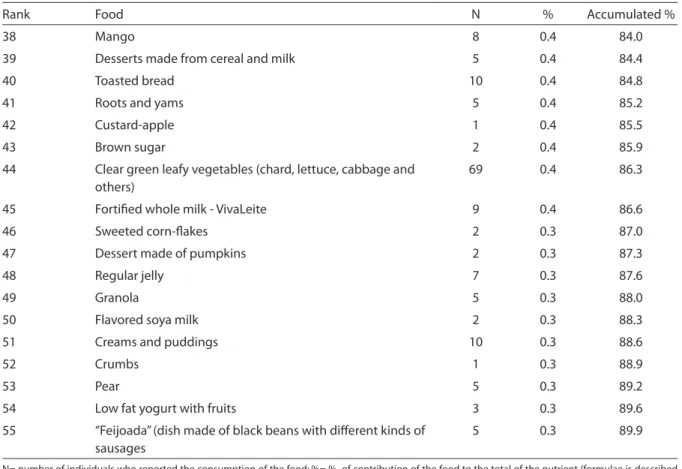
Table 3 - Contribution to total carbohydrate intake (relative and accumulated) from 24h food recall- Individuals above 60 years- East Zone, São Paulo, 2008.
Rank Food N % Accumulated %
1 White rice 99 19.6 19.6
2 French bread 64 8.3 27.9
3 Reined sugar 71 5.6 33.5
4 Banana 54 4.9 38.3
5 Citric fruit (orange, clementine) 53 4.7 43.0
6 Pasta 16 3.2 46.2
7 Whole milk 75 3.0 49.2
8 Potato 31 2.9 52.2
9 Carioca beans 95 2.3 54.5
10 Salty biscuits (non-illed) 41 2.2 56.7
11 Red apple 27 2.0 58.8
12 Skimmed milk 48 2.0 60.7
13 Diluted powdered juices 11 2.0 62.7
14 Soft drinks 25 1.8 64.5
15 “Dobradinha” (dish made of cow stomach) 2 1.7 66.2
16 Covered cakes (cover made with cream and illed) 9 1.6 67.8
17 Filled cakes (non-iced) 4 1.5 69.3
18 Bread (Milk variety) 18 1.4 70.7
19 Papaya 28 1.3 72.1
20 Whole bread 14 1.2 73.3
21 Sweetened bicuits (non-illed) 20 1.2 74.4
22 Manioc scone (fried) 1 0.9 75.4
23 Manioc lour 9 0.7 76.1
24 Marmelade 7 0.7 76.8
25 Natural juice 36 0.7 77.5
26 Grape 5 0.7 78.1
27 Cheese bread 9 0.6 78.8
28 Oat lakes 18 0.6 79.4
29 Tomato 48 0.6 80.0
30 Semi-skimmed milk 9 0.5 80.5
31 Dark green leafy vegetables (watercress, chicory, spinach, rucola and others
56 0.5 81.0
32 Soup made from meat stock 2 0.5 81.4
33 Industrialized spices (Knor®. Sazón®) 4 0.4 81.9
34 Onion 22 0.4 82.3
35 Chickpeas 2 0.4 82.7
36 Chocolate powder 10 0.4 83.1
Rank Food N % Accumulated %
38 Mango 8 0.4 84.0
39 Desserts made from cereal and milk 5 0.4 84.4
40 Toasted bread 10 0.4 84.8
41 Roots and yams 5 0.4 85.2
42 Custard-apple 1 0.4 85.5
43 Brown sugar 2 0.4 85.9
44 Clear green leafy vegetables (chard, lettuce, cabbage and others)
69 0.4 86.3
45 Fortiied whole milk - VivaLeite 9 0.4 86.6
46 Sweeted corn-lakes 2 0.3 87.0
47 Dessert made of pumpkins 2 0.3 87.3
48 Regular jelly 7 0.3 87.6
49 Granola 5 0.3 88.0
50 Flavored soya milk 2 0.3 88.3
51 Creams and puddings 10 0.3 88.6
52 Crumbs 1 0.3 88.9
53 Pear 5 0.3 89.2
54 Low fat yogurt with fruits 3 0.3 89.6
55 “Feijoada” (dish made of black beans with diferent kinds of sausages
5 0.3 89.9
N= number of individuals who reported the consumption of the food; %= % of contribution of the food to the total of the nutrient (formulae is described in Methods)
Table 3 - Contribution to total carbohydrate intake (relative and accumulated) from 24h food recall- Individuals above 60 years- East Zone, São Paulo, 2008. (cont.)
observed (bread, rice, pasta and potato), but almost all had a low iber content. These data are similar to those from the study of Bachman et al 20. These authors analyzed data from NHANES II (2001-2002) and reported that 95% of the grains consumed were reined to the detriment of whole foo-ds. It is important to be aware that reine-ment leads to the loss of an expressive part of vitamins, especially B vitamins, making these foods poor in nutrients6. In addition, ibers are important in the management of the glycemic index of foods, which can be considered an important aspect in relation to diseases related to aging21,22. According to data from the SABE Project (Health and wellness at aging- Brazil, 2003)7, 18% of el-derly people referred having diabetes.
It is important, however, to highlight that other foods considered as iber sources were expressively consumed by the elderly in the
present study, such as dark green vegetables (cress, chicory, spinach and rucola), citric fruits (mainly orange), banana and carioca beans.
Chicken and whole milk made an impor-tant contribution to fat consumption. Wu et al23, evaluating the fat intake by Japanese individuals, found different results, with an important contribution of meat fats. These differences may certainly be attributed to cultural and economic factors.
ani-Table 4 - Contribution to total protein intake (relative and accumulated) from 24h food recall- Individuals above 60 years- East Zone, São Paulo, 2008.
Rank Food N % Accumulated %
1 Chicken 76 20.9 20.9
2 Whole milk 75 8.6 29.5
3 White rice 99 7.5 37.0
4 French Bread 64 5.7 42.7
5 Low-fat milk 48 5.7 48.4
6 Carioca bean 95 3.9 52.3
7 Lean ish (whiteish) 8 3.6 55.9
8 Pasta 16 2.5 58.4
9 Pork sausages 17 2.3 60.7
10 Low-fat cheeses (ricotta, fresh white cheese and others) 26 2.1 62.8
11 Salty biscuits (non-illed) 41 1.6 64.4
12 Feijoada (dish made of black beans with diferent kinds of sausages)
5 1.6 66.0
13 Semi-skimmed milk 9 1.5 67.4
14 Citric fruit (Orange, clementine) 53 1.5 68.9
15 Beef 82 1.3 70.2
16 Milk bread 18 1.2 71.4
17 Potato 31 1.2 72.5
18 Dried cow meat 5 1.1 73.7
19 Whole bread 14 1.0 74.6
20 Banana 54 0.9 75.5
21 Fortiied whole milk - VivaLeite® 9 0.9 76.4
22 Dark green leafy vegetables (watercress, chicory, spinach, rucola and others)
56 0.8 77.2
23 Fatty ish 2 0.7 77.9
24 Covered cake (frost made with cream and illed) 9 0.7 78.7
25 Chicken sausage 3 0.7 79.4
26 Fatty cheeses (mozzarella, parmesan, among others) 18 0.7 80.1
27 Soya milk 11 0.7 80.8
28 Ham, bologna., salami 13 0.7 81.5
29 Oat lakes 18 0.7 82.2
30 Dobradinha (recipe made of cow stomach) 2 0.7 82.9
31 Chicken egg 11 0.7 83.5
32 Cheese bread 9 0.6 84.1
33 Covered cake (non-illed) 4 0.6 84.7
34 Chick peas 2 0.6 85.3
35 Clear green leafy vegetables (chard, lettuce, cabbage and others)
69 0.5 85.8
36 Sweetened biscuits (non-illed) 20 0.5 86.3
37 Tomato 48 0.5 86.8
Rank Food N % Accumulated %
39 Whole plain yogurt 5 0.4 87.7
40 Cooked ish with vegetables 5 0.4 88.1
41 Soy bean 3 0.4 88.5
42 Star fruit 1 0.3 88.9
43 Papaya 28 0.3 89.2
44 Manioc scone (fried) 1 0.3 89.5
45 Carrots 32 0.3 89.8
N= number of individuals who reported the consumption of the food; %= % of contribution of the food to the total of the nutrient (formulae is described in Methods)
Table 4 - Contribution to total protein intake (relative and accumulated) from 24h food recall- Individuals above 60 years- East Zone, São Paulo, 2008. (cont.)
Table 5 - Contribution to total fat intake (relative and accumulated) in 24h food recall- Individuals above 60 years- East Zone, São Paulo, 2008.
Rank Food N % Accumulated %
1 Chicken 76 12.4 12.4
2 Whole milk 75 10.4 22.7
3 White rice 99 4.4 27.2
4 Margarine with salt 50 4.1 31.3
5 Soya oil 5 3.7 35.0
6 Pork sausage 17 3.7 38.7
7 Olive oil 20 3.1 41.8
8 “Feijoada” (dish made of black beans with diferent kinds of sausages)
5 2.9 44.7
9 Low fat cheeses (ricotta, fresh white cheese and others) 26 2.7 47.4
10 Avocado 4 2.5 49.8
11 Salty biscuits (non-illed) 41 2.4 52.2
12 Covered cake (cover made with cream and cream-illed) 9 2.4 54.6
13 “Carioca “ beans 95 2.3 56.9
14 Skimmed milk 48 2.1 59.0
15 Mayonnaise 6 2.0 61.0
16 French bread 64 1.8 62.9
17 Manioc scone (fried) 1 1.7 64.5
18 Dark green leafy vegetables (watercress, chicory, spinach, rucola and others)
56 1.6 66.1
19 Margarine without salt 14 1.6 67.8
20 Covered cake non-illed 4 1.4 69.2
21 Chicken eggs 11 1.4 70.6
22 Ham, Bologna, salami 13 1.3 71.8
23 Beef 82 1.1 72.9
24 Fortiied whole milk - VivaLeite® 9 1.1 74.0
Rank Food N % Accumulated %
26 Semi-skimmed milk 9 1.0 76.0
27 Fatty cheeses (mozzarella, parmesan, among others) 18 1.0 77.0
28 Cheesebread 9 1.0 78.0
29 Pasta 16 1.0 78.9
30 Granola 5 0.8 79.7
31 Green tea 2 0.8 80.5
32 Sausages 3 0.7 81.2
33 Butter with salt 2 0.6 81.8
34 Dried beef 5 0.6 82.4
35 Soy milk 11 0.6 83.0
36 Low fatty ish 8 0.6 83.6
37 Popcorn (salty) 3 0.6 84.1
38 Intant pasta 3 0.6 84.7
39 Banana 54 0.5 85.2
40 Milk bread 18 0.5 85.7
41 Panettone 2 0.4 86.1
42 Pork 7 0.4 86.5
43 Corn bread 1 0.4 87.0
44 Oat lakes 18 0.4 87.4
45 Sweet biscuits (illed) 1 0.4 87.8
46 Cooked ish with vegetables 5 0.4 88.2
47 Potato 31 0.4 88.5
48 Requeijão (Brazilian creamy cheese) 6 0.3 88.9
49 Bacon 1 0.3 89.2
50 Linseed 9 0.3 89.5
51 Crumbs 1 0.3 89.8
N= number of individuals who reported the consumption of the food; %= % of contribution of the food to the total of the nutrient (formulae is described in Methods)
Table 5 - Contribution to total fat intake (relative and accumulated) in 24h food recall- Individuals above 60 years- East Zone, São Paulo, 2008. (cont.)
mal origin (chicken, whole milk, skimmed milk, cheese, ish and sausages) and four of them were from vegetal origin (rice, bread, beans and pasta). As such, another aspect to take into account in diet counseling to the elderly is the best combination of diffe-rent foods, in order to improve the protein quality of the diet.
Chicken was the animal food that contributed the most to energy intake, and consequently to the intake of many other nutrients analyzed: proteins, total fat, saturated fat, monounsaturated fat,
informa-Table 6 - Contribution to total calcium intake (relative and accumulated) from 24h food recall- Individuals above 60 years- East Zone, São Paulo, 2008.
Rank Food N % Accumulated
1 Whole milk 75 25.8 25.8
2 Skimmed milk 48 17.6 43.5
3 Low fat cheeses (ricotta, fresh white cheese and others) 26 6.6 50.0
4 French bread 64 5.6 55.7
5 Citric fruit (orange, clementine) 53 4.7 60.3
6 Semi-skimmed milk 9 4.5 64.8
7 White rice 99 3.4 68.2
8 Whole plain yogurt 5 2.2 70.3
9 “Carioca” beans 95 1.8 72.1
10 Fatty cheeses (mozzarella, parmesan, among others) 18 1.7 73.8
11 Cheese bread 9 1.5 75.4
12 Chicken 76 1.3 76.7
13 Clear green leafy vegetables (chard, lettuce, cabbage and others) 69 1.3 77.9
14 Papaya 28 1.1 79.1
15 “Dobradinha” (recipe made of cow stomach) 2 0.9 80.0
16 Dark green leafy vegetables (watercress, chicory, spinach, rucola and others)
56 0.8 80.8
17 Low fat ish 8 0.7 81.5
18 Covered cake non- illed 4 0.7 82.2
19 Oat porridge 16 0.7 82.9
20 Low fat yogurt with fruits 3 0.6 83.5
21 Whole yogurt with fruits 3 0.5 84.0
22 Dessert made of cereal and milk 5 0.5 84.5
23 Natural juice 36 0.5 84.9
24 Banana 54 0.4 85.4
25 Onion 22 0.4 85.8
26 Covered cake (cover made with cream and illed) 9 0.4 86.2
27 Low fat yogurt (non-sweetened) 3 0.4 86.7
28 Pasta 16 0.4 87.1
29 “Feijoada “(dish made of black beans with diferent kinds of sausages)
5 0.4 87.4
30 Sesame seeds 3 0.4 87.8
31 Requeijão (Brazilian creamy cheese) 6 0.4 88.2
32 Milk bread 18 0.4 88.5
33 Green tea 2 0.3 88.9
34 Potato 31 0.3 89.2
35 Red apple 27 0.3 89.4
36 Chickpea 2 0.3 89.7
37 Cow meat 82 0.2 89.9
Table 7 - Contribution to total vitamin D intake (relative and accumulated) from 24h food recall- Individuals above 60 years- East Zone, São Paulo, 2008.
Rank Food/Dish N % Accumulated
1 Whole milk 75 32.7 32.7
2 Skimmed milk 48 23.6 56.3
3 Chocolate 10 11.1 67.4
4 Semi-skimmed milk 9 6.3 73.7
5 Margarine with salt 50 4.4 78.1
6 Fortiied whole milk - VivaLeite® 9 4.2 82.3
7 Chicken 76 3.5 85.9
8 Lean ish 8 2.5 88.4
N= number of individuals who reported the consumption of the food; %= % of contribution of the food to the total of the nutrient (formulae is described in Methods)
tion commonly attributes to poultry meat advantages over red meats such as beef and pork, due to its reduced fat content. This in-formation deserves some warning, since the presence of fat is dependent on the kind of recipes used, the origin of the animal, amon-gst other aspects. In addition, the excessive consumption of a single food can contribute to the monotony of the diet. A varied diet, intra and inter food groups, contributes to the achievement of nutritional recom-mendations6. At this point, it is important to highlight that the data collection was carried out in two different seasons, aiming to identify foods preferentially consumed in warmer or cooler weather. However, this data collection showed a monotony in the food choices by the elderly, since expressive variations between both data collection were not observed.
Milk and dairy foods, in addition to their important function as protein sources, were important contributors of calcium and vitamin D, which in turn are important nutrients in bone health26,27,28.
Finally, it is important to point out the li-mitations of our study. Our sample does not necessarily relect the food consumption of the elderly from other regions of Brazil, or even from São Paulo state and, therefore, the present discussion should be directed only to the population studied. Furthermore, the majority of our studied group is composed of women. Even considering the so-called
aging feminilization29 and also considering that women are more willing to participate in interviews, we have to take into conside-ration the high disproportion between both genders in our study. Considering these observations together with the fact that the work was performed at a speciic site, we can consider the possibility of bias due to sample selection. Another important aspect to take into account is the use of the R24h. This method is strictly dependent on me-mory, which in turn constitutes a limitation to the elderly. However, concerns regarding memory are usual in the utilization of R24h, independently of age. However, there is a lack of existence of a better alternative method14. Regarding food composition ta-bles, information about speciic nutrients, mainly micronutrients are scarce in Brazil. Information from food composition tables are generally incomplete, which compro-mises the conclusion from different studies. As such, some of the data discussed in the present study could be inconsistent. The-refore, more studies are needed in order to obtain a consistent proile of food intake from elderly people, including number of meals, inluence of diseases or medications on food intake, difference between genders, age and body mass index.
Conclusions and Perspectives
regar-ding the food consumption of the elderly from the east zone of São Paulo City- SP- Brazil. Our data certainly will contribute to the data in this area in literature. From the lists made it was possible to highlight important points: -few foods contributed to the consumption of many nutrients, which indicates a monotonous diet; - high consumption of reined carbohydrates to the detriment of whole grains; -low intake of foods sources of monounsaturated
and polyunsaturated fats. Otherwise, the frequent consumption of rice and beans and dark green leafy vegetables deserves consideration as a positive aspect. All this information should be taken into account when developing educative interventions for these individuals.
Finally, the development of food lists may also provide a preliminary step in the construction of food frequency question-naires speciic for this group.
Referências
1. IBGE - Instituto Brasileiro de Geograia e Estatística. Disponível em http://www.ibge.gov.br/home/ presidencia/noticias/25072002pidoso.shtm. [Acessado em 15 de março de 2008]
2. Ribeiro SML, Donato Junior J, Tirapegui J. Nutrição e
Envelhecimento In: Tirapegui J. Nutrição: fundamentos e
aspectos atuais São Paulo. Manole; 2005. p. 27-142.
3. Garcia ANM, Romani SAM, Lira PIC. Indicadores antropométricos na avaliação nutricional de idosos: um
estudo comparativo. Rev Nutr 2007; 20: 371-8.
4. Wells, J, Dumbrell AC. Nutrition and aging: assessment and tratment of compromised nutritional status in frail
elderly patients. Clin Interv Aging 2006; 1: 67-79.
5. Gonsales SCR, Alverez TS, Oliveira PA, Cukier C, Magnoni D. Recomendações e necessidades diárias. In:
Magnoni D, Cukier C, Oliveira PA. Nutrição na terceira
idade. São Paulo: Sarvier; 2005.
6. Brasil – Ministério da Saúde. Guia Alimentar para
a População Brasileira: Promovendo a alimentação saudável. Brasília; 2006.
7. Lebrão ML, Duarte YAO. Sabe: Saúde, Bem-estar e
Envelhecimento; o projeto SABE no município de São Paulo, uma abordagem inicial. Brasília; Organização Pan-Americana da Saúde; 2003.
8. Ribeiro SML. O processo de avaliação nutricional. In:
Tirapegui J, Ribeiro SML. Avaliação nutricional: teoria e
prática. Rio de Janeiro: Guanabara-Koogan; 2009. p. 3-9.
9. Ribeiro AC, Karin Sávio EO, Rodrigues MLCF, Costa THM, Schmitz BAS. Validação de um questionário de freqüência de consumo alimentar para população
adulta. Rev Nutr 2006; 19: 553-62.
10. Egashira EM, Aquino RC, Philippi ST. Técnicas e métodos para a avaliação do consumo alimentar. In:
Tirapegui J, Ribeiro SML. Avaliação nutricional: teoria e
prática. Rio de Janeiro: Guanabara-Koogan, 2009. p. 13-23.
11. Slater B, Philippi ST, Marchioni DML; Fisberg RM. Validação de Questionários de Freqüência Alimentar -
QFA: considerações metodológicas. Rev Bras Epidemiol
2003; 6: 200-8.
12. Block G, Dresser CM, Hartman AM, Carrol MD. Nutrient sources in the American diet: quantitative data from
the NHANES II survey. I Vitamins and minerals. Am J
Epidemiol 1985a; 122: 13-26.
13. Block G, Dresser CM, Hartman AM, Carrol MD. Nutrient sources in the American diet: quantitative data from
the NHANES II survey. II Macronutrients and fats. Am J
Epidemiol 1985b; 122: 27-40.
14. Lee RD & Nieman DC. Nutritional Assessment. 2nd Ed.,
St Louis: Mosby; 1996. p. 97-8.
15. Lohman T, Roche A, Martorell R Anthropometric
Standardization Reference Manual. Human Kinetics. Champaign: Illinois; 1988.
16. Virtual NutriPlus, versão 2.0. Disponível em http:// www.linux.ime.usp.br/ ~cef/mac499-04/monograias/ gewerton/Software.htm. [Acessado em julho de 2008.
17. Levy-costa RB, Sichieri R, Pontes NS, Monteiro CA.
Disponibilidade domiciliar de alimentos no Brasil: distribuição e evolução. Rev Saúde Pública. 2005; 34: 530-40.
18. Interscience. Tendência de consumo de café IV: relatório
técnico; 2008.
19. Marchioni DML, Fisberg RM, Gois Filho JF, Kowalski LP, Carvalho MB, Abrahão M, Latorre MRDO, Eluf Neto J, Wünsch Filho V. Dietary patterns and risk of oral cancer:
a case control study from São Paulo, Brasil. Rev Saúde
Pública 2007; 41: 19-26.
20. Bachman JL, Reedy J, Subar AF, Krebs-smith SM. Sources of food group intakes among the US population,
2001-2002. J Am Diet Assoc 2008; 108: 804-14.
21. Englysth, KS. Carbohydrates. In: Garrow J & James
W(ed). Woman nutrition and dietetics. Edimburgh:
22. World Cancer Research Found (WCRF). Food, nutrition and the prevention of cancer: A global perspective.
Washington; 1997
23. Wu SJ, Chang YH, Wei IL, Kao MD, Lin YC, Pan WH. Intake levels and major food sources of energy and
nutrients in the Taiwanese elderly. Asia Pac J Clin Nutr
2005; 14: 211-20.
24. IEA – Instituto de Economia Agrícola. Dados coletados no comércio varejista. Disponível em http://www.iea. sp.gov.br/out/banco/menu.php. [Acessado em 07 de novembro de 2009]
25. Sachs A, Oliveira PA, Magnoni D. Riscos nutricionais na terceira idade. In: Magnoni D, Cukier C, Oliveira PA.
Nutrição na terceira idade. Sarvier: São Paulo, 2005.
26. Ho SC, Chen, YM, Woo JLF, Lam SSH. High habitucal calcium intake attenuates bone loss inearly
postmenopausal chinese women: an 18-month
follow-up study. J Clin Endocrinol Metab 2004; 89: 2166-70.
27. Wallace LS, Ballard JE. Lifetime physical activity and
calcium intake related to bone density in young women.
J Womens Health Gend Based Med 2002; 11: 389-98.
28. Dourador EB. Osteoporose senil. Arq Bras Endocrinol
Metab 1999; 43 :446-451.
29. Salgado CDS. Mulher idosa: a feminização da velhice.
Estud Interdiscip Envelhec 2002; 4: 7-9.