ABSTRACT:Introduction:Despite the increased consumption of fruits and vegetables in the Brazilian population,
a great proportion of people do not meet the recommendations. Purchasing sites associated with fruit and vegetable consumption has not been widely explored. Objective: To explore the association between fruit and vegetable purchasing and consumption sites and the consumption of these foods among adults living in the city of São Paulo, Brazil. Methods: Cross-sectional study with 2 thousand individuals living in the city of São Paulo, aged between 20 and 59 years, participants of the “Obesogenic Environment Study in São Paulo”. The outcome was fruit and vegetable consumption measured by weekly consumption. Exposure variables included purchasing sites (supermarkets, open-air food markets, fruit and vegetable specialized markets, and corner stores) and consumption sites (full service restaurants and fast food restaurants). Results: The sample comprises women (52.3%) aged between 25 and 34 years (30.2%), with at least 8 years of schooling (42.8%) receiving 2 to 5 minimum wages (34.6%). Demographic and socioeconomic variables showed association with regular consumption of fruits and vegetables (p < 0.05). The regular consumption of meals in full service restaurant was associated with vegetables consumption. The regular consumption of meals in fast-food restaurants was not associated with vegetables consumption. Food purchasing sites were not associated with fruit or vegetable consumption. Conclusion: The choice of restaurant type was associated with vegetable consumption. In the studied population, food purchasing sites were not associated with fruit or vegetable consumption. Keywords: Food consumption. Health promotion. Fruits. Vegetables. Nutritional surveys. Adult.
The inluence of meal and food markets
in fruit and vegetable consumption
among adults in the city of São Paulo
A inluência dos locais de refeição e de aquisição de alimentos no
consumo de frutas e hortaliças por adultos no município de São Paulo
Carolina Carpinelli Sabbag MazieroI, Patrícia Constante JaimeII, Ana Clara DuranIII
IPostgraduate Program in Public Health Nutrition, School of Public Health, Universidade de São Paulo – São Paulo (SP), Brazil. IIDepartment of Nutrition, School of Public Health, Universidade de São Paulo – São Paulo (SP), Brazil.
IIIUniversity of Illinois – Chicago, USA.
Corresponding author: Carolina Carpinelli Sabbag Maziero. Rua Carmo Coelho, 149, Santana, CEP: 09406-180, Ribeirão Pires, SP, Brasil. E-mail: [email protected]
Conlict of interests: nothing to declare – Financial support: Fundação de Amparo à Pesquisa do Estado de São Paulo (FAPESP), process n. 2009/17517-0, and Conselho Nacional de Desenvolvimento Cientíico e Tecnológico (CNPQ), process n. 476881/2010-2.
INTRODUCTION
The consumption of fruits and vegetables is considered as a marker of a healthy diet pat-tern, reducing the risks of death caused by chronic non-communicable diseases due to their composition, rich in vitamins, minerals and ibers, and their low energy density. Fruits and vegetables are also part of the most complete, varied, colorful and attractive meals, with lower presence of ultra-processed foods, according to the Dietary Guide for the Brazilian Population (Guia Alimentar para a População Brasileira)1-5. The minimum daily intake of these foods to obtain this healthy and protective efect is 400 g per capita, or the equivalent to 5 portions of 80 g6.
This minimum consumption is fulilled by 24% of the Brazilian population, according to survey Surveillance System of Risk and Protective Factors for Chronic Diseases (VIGITEL), conducted in 20147, and by little less than one third of the Brazilian population, according to the Health National Research (PNS)8.
The dietary behavior is highly complex. The reasons that lead a person to consume a speciic food come from the interaction of multiple inluences, in diferent contexts and con-ditions, being inluenced by socioeconomic and demographic characteristics9-15. The choice of locations to purchase food is also inluenced by the environment and by individual characteristics16,17.
In the literature, there is no consensus about the inluence of the locations of food purchase and its consumption18. Studies point to possible relations between healthier diets and more access to super and hypermarkets, which ofer a greater variety of foods natural
RESUMO:Introdução: Apesar do aumento no consumo de frutas e hortaliças no Brasil, o país ainda está aquém das recomendações. O local de consumo e aquisição desses alimentos ainda é pouco explorado. Objetivo: Avaliar a inluência dos locais de aquisição e consumo de alimentos na ingestão de frutas e hortaliças em adultos residentes no município de São Paulo. Métodos: Estudo transversal que avaliou 2 mil indivíduos participantes do “Estudo do ambiente obesogênico em São Paulo”. O desfecho do estudo foi o consumo regular de frutas e hortaliças. As variáveis de exposição foram: local de aquisição (supermercados, feiras, sacolões e mercados de bairro) e consumo de alimentos (restaurantes de serviço completo e restaurantes fast-food). Resultados: A população estudada é composta por 52,3% de indivíduos do sexo feminino, 30,2% com idade entre 25 e 34 anos, 42,8% com 8 a 11 anos de estudo e 34,6% com renda familiar de 2 a 5 salários mínimos. As variáveis demográicas e socioeconômicas associaram-se com o desfecho (p < 0,05). O consumo regular de refeições em restaurantes de serviço completo foi associado ao consumo de hortaliças, ao contrário do consumo de refeições em restaurantes fast-food. Não houve associação entre local de aquisição e consumo regular de frutas e hortaliças. Conclusão: Visitas regulares a restaurantes de serviço completo inluenciam positivamente o consumo de hortaliças. Não foram encontradas relações entre o local de compra de frutas e hortaliças e seu consumo.
at more accessible prices, when compared to convenience stores and corner stores12,19. Studies in the United States and in the United Kingdom present diverse results when assessing the presence of purchasing sites for fruits and vegetables, and the efect on the consumption of these foods by the population20. Jaime et al.21 mention a signiicant asso-ciation between the regular intake of fruits and vegetables and the density of fruit stores and fairs; however, according to Carvalho et al.22, the outdoor fruit fairs have been less visited than markets and fruit markets, and the purchase of fruits and vegetables in these spaces has decreased 19.81%.
Despite the relationships between places of food purchase and the intake of fruits and vegetables, little is assessed about the association of the consumption of these foods with the habit of eating outside the household. In the scientific literature, there are no studies demonstrating this relationship. The studies state that, among the main factors associated with the changes in dietary patterns that the Brazilian population has been undergoing in the past few decades, is the increasing habit of eating meals outside the household23. This habit, in industrialized countries, is related with cultural, social and environmental factors24. The increasing consumption of calories, fat and sodium and the low intake of fibers, iron and vitamins is associated to this behavioral change, in some studies25,26.
Since most of the responsibility in the development of obesity and chronic diseases is attributed to the diet, it is important to investigate these associations, recognizing the role of the environment in the dietary behavior of the population, considering the lack of pub-lications relating the intake of fruits and vegetables and the behavior of purchase and con-sumption of foods27.
The objective of this study was to assess the associations between the locations of meal consumption and the locations of fruit and vegetable purchase with the regular intake of these foods among adults living in São Paulo, controlling the analysis for demographic and socioeconomic variables.
METHODS
This is a cross-sectional study conducted in São Paulo, between April and May, 2011, including 2 thousand individuals of both sexes, aged between 20 and 59 years, living or work-ing in 13 administrative districts previously selected, which were part of the “Obesogenic Environment Study in São Paulo” (ESAO-SP). The studied ields were selected by a pur-posive sampling methodology, proposed by ESAO-SP, based on the administrative districts and census sectors in which the city of São Paulo is divided, according to geographic and administrative characteristics.
also at guaranteeing that, in each one of the criteria, there is any diversity, so that the impact of the diversity of the objects of interest can be explored28.
The city of São Paulo is divided in 96 administrative districts, which were classiied in socioeconomic level terciles by using the Human Development Index (HID), and in 3 dietary environment indicators according to the density of the equipment of food purchase. After the classiications, two districts were randomly selected in each one of the 6 possible strata, and 1 extra district in case there was much refusal from the commercial businesses of the selected districts, accounting for 13 administrative districts.
In each district, 8 census sectors were randomly selected, totaling 104; of these, 18 were excluded for not containing a location of food sale, leaving 86. Among these, 4 census sectors were randomly selected in each one of the 13 districts, accounting for 52 assessed sectors. The sample tried to contemplate the socioeconomic and spatial diversities found in the city regarding the food environment. More details on the methodology used in the sam-pling process can be observed in Duran et al.12,29.
The sample of the individuals was conducted in a non-probability manner, by con-venience, and was stratiied by sex and age, using the real proportion of each district, according to Census 2000, ensuring the representativeness of the sample for that area30. Data collection was conducted face to face, by a trained and supervised team, in places of great circulation of people inside the selected districts, like squares, parks and com-mercial businesses.
Inclusion criteria were age – between 20 and 59 years – and location of residence or circulation, inside the districts selected in the sampling areas. There were no losses in the questionnaires used. One questionnaire was not fully answered, however, the data avail-able were used.
The dependent variables of the study are the regular consumption of fruits and the regular intake of vegetables — daily intake of any portion —, which were obtained with the questions “On how many days of the week do you usually eat lettuce and tomato, or any other raw vegetable”? and “On how many days of the week do you usually eat cooked vegetables with the food or in the soup, like, for example, cabbage, carrot, cha-yote, eggplant and zucchini, not to mention potatoes, manioc or yam?”. The answers were given in weekly frequency of consumption. The outcome “regular consumption of fruits and vegetables” was determined by the intake of each type of food (fruits and vegetables) on five or more days of the week14.
at fast-food restaurants” were considered as the consumption on one or more days of the week in these locations.
To obtain data about the locations of purchase of fruits and vegetables, the question was: “Of the locations below, where do you buy fruits and vegetables more often?”; the pos-sible answers were: supermarkets and hypermarkets, fruit stores, outdoor fairs our neigh-borhood markets.
The demographic and socioeconomic variables were: sex referred by the inter-viewee; age calculated based on the interviewee’s date of birth; schooling, obtained by the question: “Until what grade did you study?”; and family income, obtained by the question: “What is the total approximate income of your family?”, measured in minimum wages (up to one minimum wage, from one to two minimum wages, from two to five minimum wages, from five to ten minimum wages, and more than ten minimum wages).
The descriptive analysis of the quantitative variables was conducted by using measures of central tendency and dispersion, and the qualitative variables were described according to the absolute and relative frequencies. The associations between the demographic and socioeconomic variables with the regular intake of fruits and vegetables were tested with the Pearson’s χ² test for nominal variables, and with the linear trend test for ordinal vari-ables. The descriptive level of the test was p < 0.05.
To analyze the independent efect of the variables of location of consumption and purchase of foods with the intake of fruits and vegetables, the odds ratio (OR) was cal-culated for each category related with the location of intake: regular consumption at full service restaurants, regular consumption at fast-food restaurants and non-regular consumption in both locations – and for each category of location for food purchase – supermarket, fruit store, outdoor fairs and neighborhood markets – adjusted by sex, age, schooling and family income, considering a 5% signiicance level and 95% conidence interval (95%CI). Data was analyzed using the software Statistical Package for the Social Sciences (SPSS), version 17.0.
This study was submitted to and approved by the Research Ethics Committee of the School of Public Health at Universidade de São Paulo (FSP/USP). The participation of the individuals was based on the signature of the Informed Consent Form.
RESULTS
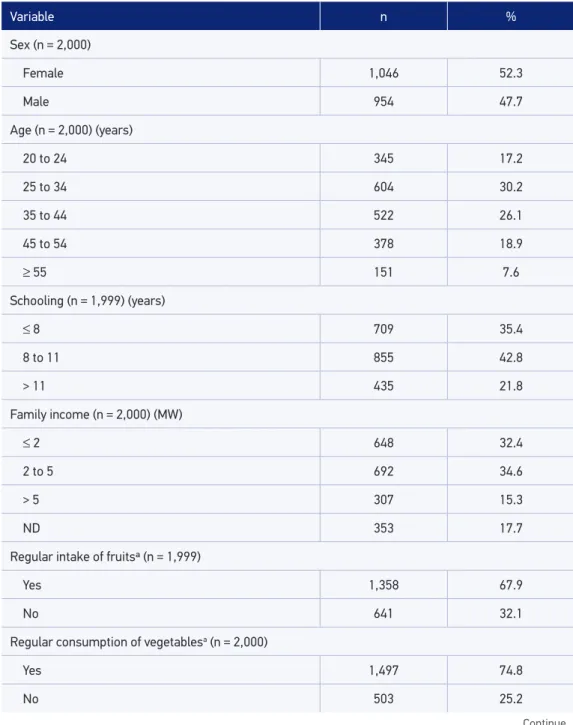
Of the individuals analyzed, 52.3% were female; the prevalent age was 25 to 34 years (30.2%); schooling years, between 8 and 11 (42.8%); and Family income, from 2 to 5 mini-mum wages (34.6%). Most of the population (67.9%) reported the regular intake of fruits, and 74.9%, of vegetables (Table 1).
Table 1. Distribution of the studied population according to the demographic and socioeconomic variables, indicators of the intake of fruits and vegetables and locations of consumption and purchase of foods. São Paulo, 2011.
Continue...
Variable n %
Sex (n = 2,000)
Female 1,046 52.3
Male 954 47.7
Age (n = 2,000) (years)
20 to 24 345 17.2
25 to 34 604 30.2
35 to 44 522 26.1
45 to 54 378 18.9
≥ 55 151 7.6
Schooling (n = 1,999) (years)
≤ 8 709 35.4
8 to 11 855 42.8
> 11 435 21.8
Family income (n = 2,000) (MW)
≤ 2 648 32.4
2 to 5 692 34.6
> 5 307 15.3
ND 353 17.7
Regular intake of fruitsª (n = 1,999)
Yes 1,358 67.9
No 641 32.1
Regular consumption of vegetablesa (n = 2,000)
Yes 1,497 74.8
No 503 25.2
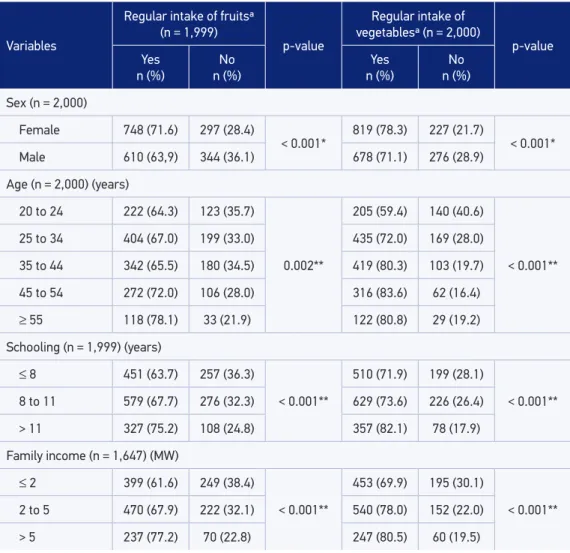
All variables – both demographic and socioeconomic – were associated with the regular consumption of fruits and vegetables (p < 0.05). A higher frequency in the regular intake of fruits was observed among female individuals (71.6%), showing a linear increase with age, schooling and family income (Tabela 2).
There were the same associations for the regular consumption of vegetables, with a dif-ference in the distribution of the age variable, with higher frequency of consumption in the population aged between 45 and 54 years (83.6%) (Table 2).
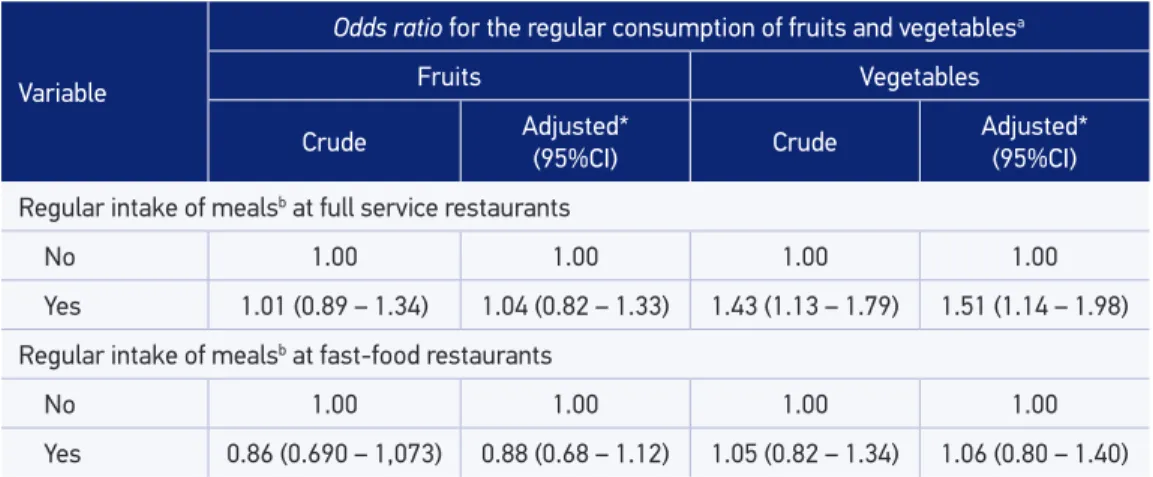
The regular intake of meals at full service restaurants was not associated with the con-sumption of fruits, but with the intake of vegetables, after the adjustment for the demo-graphic and socioeconomic characteristics (respectively, OR = 1.51; 95%CI 1.14 – 1.98). The regular intake of meals at fast-food restaurants was not associated with the intake of fruits or vegetables (Table 3).
There was no statistically signiicant association between the location of fruit and veg-etable purchase and the intake of these foods (Table 4).
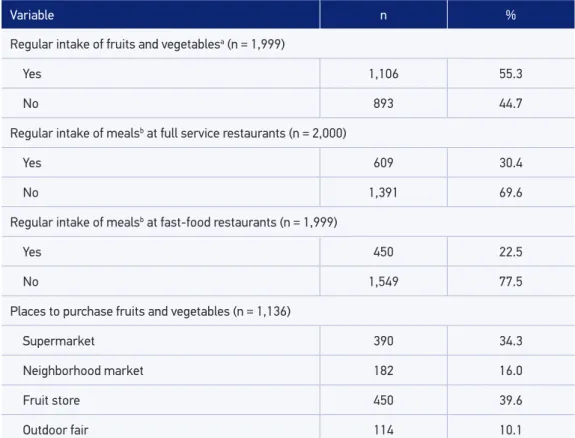
Table 1. Continuation.
MW: minimum wages; ND: not declared; aregular intake of fruits and vegetables: consumption of any portion on ive
or more days of the week; bregular intake of meals: consumption of main meals (lunch and/or dinner) on one or more
days of the week.
Variable n %
Regular intake of fruits and vegetablesa (n = 1,999)
Yes 1,106 55.3
No 893 44.7
Regular intake of mealsb at full service restaurants (n = 2,000)
Yes 609 30.4
No 1,391 69.6
Regular intake of mealsb at fast-food restaurants (n = 1,999)
Yes 450 22.5
No 1,549 77.5
Places to purchase fruits and vegetables (n = 1,136)
Supermarket 390 34.3
Neighborhood market 182 16.0
Fruit store 450 39.6
Table 2. Association between indicators of the consumption of fruits and vegetables and demographic and socioeconomic variables. São Paulo, 2011.
MW: minimum wage; ªregular intake of fruits and vegetables: consumption of any portion on ive days or more of the
week; *descriptive level of the Pearson’s χ2 association test: p < 0.05; **descriptive level of the linear trend test: p < 0.05.
Variables
Regular intake of fruitsª (n = 1,999)
p-value
Regular intake of vegetablesª (n = 2,000)
p-value
Yes
n (%)
No
n (%)
Yes
n (%)
No
n (%)
Sex (n = 2,000)
Female 748 (71.6) 297 (28.4)
< 0.001* 819 (78.3) 227 (21.7) < 0.001*
Male 610 (63,9) 344 (36.1) 678 (71.1) 276 (28.9)
Age (n = 2,000) (years)
20 to 24 222 (64.3) 123 (35.7)
0.002**
205 (59.4) 140 (40.6)
< 0.001** 25 to 34 404 (67.0) 199 (33.0) 435 (72.0) 169 (28.0)
35 to 44 342 (65.5) 180 (34.5) 419 (80.3) 103 (19.7)
45 to 54 272 (72.0) 106 (28.0) 316 (83.6) 62 (16.4)
≥ 55 118 (78.1) 33 (21.9) 122 (80.8) 29 (19.2)
Schooling (n = 1,999) (years)
≤ 8 451 (63.7) 257 (36.3)
< 0.001**
510 (71.9) 199 (28.1)
< 0.001** 8 to 11 579 (67.7) 276 (32.3) 629 (73.6) 226 (26.4)
> 11 327 (75.2) 108 (24.8) 357 (82.1) 78 (17.9)
Family income (n = 1,647) (MW)
≤ 2 399 (61.6) 249 (38.4)
< 0.001**
453 (69.9) 195 (30.1)
< 0.001** 2 to 5 470 (67.9) 222 (32.1) 540 (78.0) 152 (22.0)
> 5 237 (77.2) 70 (22.8) 247 (80.5) 60 (19.5)
DISCUSSION
The indings in this study allow to state possible associations between the regular con-sumption of meals at full service restaurants and the regular concon-sumption of vegetables; however, they do not allow this association with the regular intake of fruits. There is no association between the consumption of fruits and vegetables and the regular intake of meals at fast-food restaurants, according to the data analyzed.
Table 3. Crude and adjusted association between the intake of fruits and vegetables and the place of regular consumption of meals. São Paulo, 2011.
95%CI: 95% conidence interval; aregular intake of fruits and vegetables: consumption of any portion on ive or more
days of the week; bregular intake of meals: consumption of main meals (lunch and/or dinner) on one or more days of
the week; *odds ratio adjusted by sex, age, schooling and family income.
Variable
Odds ratio for the regular consumption of fruits and vegetablesa
Fruits Vegetables
Crude Adjusted*
(95%CI) Crude Adjusted*(95%CI)
Regular intake of mealsb at full service restaurants
No 1.00 1.00 1.00 1.00
Yes 1.01 (0.89 – 1.34) 1.04 (0.82 – 1.33) 1.43 (1.13 – 1.79) 1.51 (1.14 – 1.98)
Regular intake of mealsb at fast-food restaurants
No 1.00 1.00 1.00 1.00
Yes 0.86 (0.690 – 1,073) 0.88 (0.68 – 1.12) 1.05 (0.82 – 1.34) 1.06 (0.80 – 1.40)
Variable
Odds ratio for the regular consumptionª of fruits and vegetables
Fruits Vegetables
Crude Adjusted*
(95%CI) Crude
Adjusted* (95%CI) Places to purchase fruits and vegetables
Supermarket
No 1.00 1.00 1.00 1.00
Yes 1.08 (0.82 – 1.42) 0.99 (0.73 – 1.32) 0.98 (0.73 – 1.31) 0.78 (0.56 – 1.10)
Neighborhood market
No 1.00 1.00 1.00 1.00
Yes 0.90 (0.64 – 1.28) 1.01 (0.69 – 1.48) 0.96 (0.66 – 1.41) 0.99 (0.64 – 1.51)
Outdoor fair
No 1.00 1.00 1.00 1.00
Yes 0.89 (0.69 – 1.16) 0.90 (0.67 – 1.20) 1.08 (0.81 – 1.43) 1.21 (0.87 – 1.69)
Fruit store
No 1.00 1.00 1.00 1.00
Yes 1.32 (0.84 – 2.07) 1.39 (0.84 – 2.30) 0.93 (0.59 – 1.47) 1.15 (0.66 – 2.00) Table 4. Crude and adjusted association between the consumption and the locations to purchase fruits and vegetables. São Paulo, 2011.
95%CI: 95% conidence interval; ªregular intake of fruits and vegetables: consumption of any portion on ive or more
studied population. The intake was higher among women, and growing with age, school-ing8 and family income3.
The population analyzed here presented with regular consumption of fruits and vege-tables (55.3%) higher than the usually observed in other Brazilian studies, for example, in Florianópolis (50.1%) and in the city of São Paulo (35.5%)7. This consumption, higher than that observed in the main national studies, can be justiied by the fact that the study popu-lation represents the areas deined for the study, and not the city of São Paulo in general, so some variations are possible in the characteristics of the population analyzed.
Regarding the meals outside the household, several studies point to worse nutritional quality of the meals in this context23,32, however, this study does not corroborate others mentioned earlier, since it presents a positive relationship between the intake of vegetables and the meals had at full service restaurants. The access to healthy foods varies according to the type of business and the socioeconomic status of the population in the city of São Paulo29. The restaurants that charge per kilo can represent an alternative for a healthy diet outside the household, since the variety of choice is higher33.
However, further studies are necessary to assess the availability and the intake of fruits in this type of business. This study did not mention a relationship between the consumption of fruits and the meals had at full service restaurants, and we did not find studies that tried to demonstrate that specific association for fruits, only for foods nat-ural in general34,35.
The consumption of meals at fast-food restaurants was not associated with the con-sumption of fruits and vegetables. Since the intake of these foods, presented by the studied population, was higher than that found in previous analyses7, maybe the intake in this pop-ulation is not inluenced by the consumption or not of meals at fast-food restaurants; that is, the individuals who consume fruits and vegetables are not afected by the regular intake of meals at fast-food restaurants. However, it is still necessary to understand how the pres-ence of this type of restaurant can afect and change the dietary behavior and the health of the population, for the implementation of efective strategies to stimulate healthy diets, even if outside the household12.
For the evaluation of locations of food purchase, the supermarkets (34.3%) and the fruit stores (39.6%) prevailed in the preference of the population, leaving the neighborhood mar-kets (16.0%) in third in the order of preference for the purchase of fruits and vegetables, and the outdoor fairs (10.0%) in fourth.
However, in this study, for the population analyzed, the place of fruit and vegetable purchase did not present a relationship with the frequency of consumption of these foods. This inding can be explained by the hypothesis that, in this population, the regular intake of fruits and vege-tables is already consolidated, regardless of the location preferred by people to buy these items. A study conducted in Belo Horizonte, based on the data from VIGITEL, observed that the increasing consumption of fruits and vegetables is directly related with the density of the equipment available to sell these items3. In São Paulo, the highest density of supermar-kets and fruit stores is associated with the regular intake of fruits and vegetables, especially in the lower income categories12.
However, these studies do not approach the relationship between the type of ment used to sell these foods and the frequency of consumption, but the density of equip-ment in the region.
The dietary environment and the pattern of food purchase are still little explored in Brazil21,29,40. Therefore, some comparisons cannot be made due to the lack of data refer-ring to the subject. These relationships should be searched in new studies, in order to get to know and design, in a more robust way, the behavior of the purchase in the population, related with the consumption of foods.
A limitation of this study is related with the application of questionnaires for the evalua-tion of food consumpevalua-tion, which involves possible bias in the measurement of the frequent diet due to errors in the memory of the interviewee, which overcame the underestimation of dietary intake41,42. The diferences of methods to assess the intake of foods and the cat-egorization of data may also have damaged the comparison with other studies, however, the same parameters of evaluation and categorization of the main national surveys were considered for comparison.
CONCLUSION
It is concluded that the regular intake of fruits and vegetables is inluenced by sex, age, schooling and Family income. The conduction of meals at full service restaurants has a pos-itive inluence on the intake of vegetables, however, it does not afect the consumption of fruits. There were no associations between the choice of locations to purchase fruits and vegetables and the intake of these foods.
Based on the analysis of the data in this study, and on the comparison with others, it is recom-mended that meals outside the household be conducted, preferably, at full service restaurants, such as those charged by the kilogram, which are a good option in comparison to fast-food restaurants, since they also count on fast service and ensure greater access to healthier meals.
1. Brasil. Ministério da Saúde. Guia alimentar para a população brasileira. Secretaria de Atenção à Saúde, Departamento de Atenção Básica. Brasília: Ministério da Saúde; 2014.
2. Oliveira MS, Lacerda LNL, Santos LC, Lopes ACS, Câmara AMCS, Menzel HJK, et al. Consumo de frutas e hortaliças e as condições de saúde de homens e mulheres atendidos na atenção primaria à saúde. Ciênc Saúde Coletiva 2015; 20(8): 2313-22. DOI: 10.1590/1413-81232015208.18272014
3. Pessoa MC, Mendes LL, Caiaffa WT, Malta DC, Velásquez-Meléndez G. Availability of food stores and consumption of fruit, legumes and vegetables in a Brazilian urban area. Nutr Hosp 2014; 31(3): 1438-43. DOI: 10.3305/nh.2015.31.3.8245
4. Figueiredo ICR, Jaime PC, Monteiro CA. Fatores associados ao consumo de frutas, legumes e verduras em adultos na cidade de São Paulo. Rev Saúde Pública 2008; 42(5): 777-85. DOI: 10.1590/S0034-89102008005000049
5. Brasil. Ministério da Saúde. Plano de ações estratégicas para o enfrentamento das doenças crônicas não transmissíveis (DCNT) no Brasil 2011-2022. Departamento de Análise de Situação de Saúde, Ministério da Saúde, Secretaria de Vigilância em Saúde. Brasília: Ministério da Saúde; 2011.
6. World Health Organization (WHO). Diet, nutrition and the prevention of chronic diseases. Report of a Joint WHO/FAO Expert Consultation. Geneva: WHO; 2003. 149 p.
7. Brasil. Ministério da Saúde. Vigitel Brasil 2014, Saúde Suplementar: vigilância de fatores de risco e proteção para doenças crônicas por inquérito telefônico. Agência Nacional de Saúde Suplementar, Secretaria de Vigilância em Saúde. Brasília: Ministério da Saúde; 2015.
8. Jaime PC, Stopa SR, Oliveira TP, Vieira ML, Szwarcwald CL, Malta DC. Prevalência e distribuição sociodemográfica de marcadores de alimentação saudável, Pesquisa Nacional de Saúde, Brasil, 2013. Epidemiol Serv Saúde 2015; 24(2): 267-76. DOI: 10.5123/S1679-49742015000200009
9. Oliveira SP, Theubaud-Mony A. Hábitos e práticas em três localidades da cidade de São Paulo (Brasil). Rev Nutr 1998; 11(1): 37-50. DOI: 10.1590/ S1415-52731998000100003
10. Souza RS, Arbage AP, Neumann PS, Froehlich JM, Diesel V, Silveira PR, et al. Comportamento de compra dos consumidores de frutas, legumes e verduras na região central do Rio Grande do Sul. Cienc Rural 2008; 38(2): 511-17. DOI: 10.1590/S0103-84782008000200034
11 Almeida LB, Sabbag CC, Jardini V, Santos JTG. O tempo consagrado à alimentação: dimensões da vida moderna e seu impacto sobre os hábitos alimentares. Alimentação Humana. Revista SPCNA 2011; 17(1): 64-8.
12. Duran AC, Almeida SL, Latorre MR, Jaime PC. The role of the local retail food environment in fruit, vegetable and sugar-sweetened beverage consumption in Brazil. Public Health Nutrition 2015. [Internet]. Disponível em: http://journals.cambridge.org/ download.php?ile=%2FPHN%2FS1368980015001524a. pdf&code=6dcaeee54fd5e17915bc15f69c7fae16 (Acessado em 10 de setembro de 2015). DOI: 10.1017/ S1368980015001524
13. Brasil. Instituto Brasileiro de Geograia e Estatística (IBGE). Pesquisa de Orçamentos Familiares 2008-2009. Ministério do Planejamento, Orçamento e Gestão, Diretoria de Pesquisas Coordenação de Trabalho e Rendimento. Rio de Janeiro: IBGE; 2010.
14. Brasil. Ministério da Saúde. Vigitel Brasil 2013: vigilância de fatores de risco e proteção para doenças crônicas po r inquérito telefônico. Ministério da Saúde, Secretaria de Vigilância em Saúde. Brasília: Ministério da Saúde; 2014.
15. Brasil. Portal da Saúde. Vigitel: vigilância de fatores de risco e proteção para doenças crônicas por inquérito telefônico. 2014 [Internet]. Disponível em: http:// portalsaude.saude.gov.br/images/pdf/2014/abril/30/ Lancamento-Vigitel-28-04-ok.pdf (Acessado em janeiro de 2015).
16. Lytle LA. Measuring the food environment state of the science. Am J Prev Med 2009; 36(4 Suppl): 134-44. DOI: 10.1016/j.amepre.2009.01.018
17. Krukowsk i RA, Mcsweeney J, Sparks C, West DS. Qualitative study of influences on food store choice. Appetite 2012; 59(2): 510-6. DOI: 10.1016/j. appet.2012.06.019
18. Taillie LS, Ng SW, Popkin BM. Global growth of “big box” stores and the potential impact on human health and nutrition. Nutr Rev 2016; 74(2): 83-97. DOI: 10.1093/nutrit/nuv062
19. Caspi CE, Sorensen G, Subramanian SV, Kawachi I. The local food environment and diet: a systematic review. Health Place 2012; 18(1): 1172-87. DOI: 10.1016/j.healthplace.2012.05.006
21. Jaime PC, Duran AC, Sarti FM, Lock K. Investigating environmental determinants of diet, physical activity, and overweight among adults in Sao Paulo, Brazil. J Urban Health 2011; 88(3): 567-81. DOI: 10.1007/ s11524-010-9537-2
22. Carvalho FG, Rezende EG, Rezende ML. Hábitos de compra dos clientes da feira livre de Alfenas-MG. Organizações Rurais e Ag roindustriais 2010; 12(1): 131-41.
23. Claro RM, Baraldi LG, Martins APB, Bandoni DH, Levy RB. Evolução das despesas com alimentação fora do domicílio e inluência da renda no Brasil, 2002/2003 a 2008/2009. Cad Saúde Pública 2014; 30(7): 1-9. DOI: 10.1590/0102-311X00176113
24. Jabs J, Devine CM. Time scarcity and food choices: an overview. Appetite 2006; 47(2): 196-204. DOI:10.1016/j. appet.2006.02.014
25. Orfanos P, Naska A, Trichopoulou A, Grioni S, Boer JM, van Bakel MM, et al. Eating out of home: energy, macro- and micronutrient intakes in 10 european countries. The european prospective investigation into cancer and nutrition. Eur J Clin Nutr 2009; 63(Suppl 4): 239-62. DOI: 10.1038/ejcn.2009.84
26. Bezerra IN, Sichieri R. Eating out of home and obesity: a Brazilian nationwide survey. Public Health Nutr 2009; 12(11): 2037-43. DOI: 10.1017/S1368980009005710
27. Larson N, Story M. A review of environmental inluences on food choices. Ann Behav Med 2009; 38(Suppl 1): 56-73. DOI: 10.1007/s12160-009-9120-9
28. Ritchie J, Lewis J, Elam G. Designing and selecting samples. In: Ritchie J, Lewis J. Qualitative research practice: a guide for social science students and researchers. London: SAGE Publications; 2003. p. 77-108.
29. Duran AC, Diez Roux AV, Latorre M do R, Jaime PC. Neighborhood socioeconomic characteristics and diferences in the availability of healthy food stores and restaurants in Sao Paulo, Brazil. Health Place 2013; 23: 39-47. DOI: 10.1016/j.healthplace.2013.05.001
30. Brasil. Instituto Brasileiro de Geograia e Estatística (IBGE). Censos Demográicos 2000: agregados por setores censitários dos resultados de universo – 2ª edição. Ministério do Planejamento, Orçamento e Gestão 2002. [Internet]. Disponível em: http://www. ibge.gov.br/home/estatistica/populacao/defaulttab_ agregado.shtm (Acessado em 10 de maio de 2010).
31. Jaime PC, Monteiro CA. Fruit and vegetable intake by Brazilian adults, 2003. Cad Saúde Pública 2005; 21(Suppl 1): 19-24. DOI: /S0102-311X2005000700003
32. Bandoni DH, Canella DS, Levy RB, Jaime PC. Eating out or in from home: analyzing the quality of meal according eating locations. Rev Nutr 2013; 26(6): 625-32. DOI: 10.1590/S1415-52732013000600002
33. Santos MV, Proença RPC, Fiates GMR, Calvo MCM. Os restaurantes por peso no contexto de alimentação saudável fora de casa. Rev Nutr 2011; 24(4): 641-49. DOI: 10.1590/S1415-52732011000400012
34. Lassen A, Hansen K, Trolle E. Comparison of bufet and à la carte serving at worksite canteens on nutrient intake and fruit and vegetable consumption. Public Health Nutr 2007; 10(3): 292-7. DOI: 10.1017/ S1368980007246610
35. Jomori MM, Proenca RPC, Calvo MCM. Food choice factors. Rev Nutr 2008; 21(1): 63-73. DOI: 10.1590/ S1415-52732008000100007
36. Popkin BM, Adair LS, Ng SW. Global nutrition tr ansition and the pandemic of obesity in developing countries. Nutr Rev 2012; 70(1): 3-21. DOI: 10.1111/j.1753-4887.2011.00456.x
37. Reardon T, Timmer CP. The economics of the food system revolution. Annu Rev Resour Economics 2012; 4: 225-64. DOI: 10.1146/annurev.resource.050708.144147
38. Hawkes C. Dietary implications of supermarket development: a global perspective. Dev Policy Rev 2008; 26(6): 657-92. DOI: 10.1111/j.1467-7679.2008.00428.x
39. Costa JC, Claro RM, Martins AP, Levy RB. Food purchasing sites. Repercussions for healthy eating. Appetite 2013; 70: 99-108. DOI: 10.1016/j. appet.2013.06.094
40. Velásques-Melendez G, Mendes LL, Padez CMP. Built environment and social environment: associations with overweight and obesity in a sample of Brazilian adults. Cad Saúde Pública. 2013; 29(10): 1988-96. DOI: 10.1590/0102-311X00078112
41. Medlin C, Skinner JD. Individual dietary intake methodology: a 50-year review of progress. J Am Diet Assoc 1988; 88(10): 1250-7.
42. Scagliusi FB, Ferriolli E, Pfrimer K, Laureano C, Cunha CS, Gualano B, et al. Underreporting of energy intake in Brazilian women varies according to dietary assessment: a cross-sectional study using doubly labeled water. J Am Diet Assoc 2008; 108(12): 2031-40. DOI: 10.1016/j.jada.2008.09.012
Received on: 02/11/2016