ABSTRACT
http://dx.doi.org/10.1590/1678-7757201302196
in the public water supply in Bauru, São Paulo,
Brazil
1 2 !" #!$3, Juliano
Pelim PESSAN%, Larissa Tercília GRIZZO5, Thelma Lopes SILVA5 & '(6")""
OLIVEIRA6, Sonia GROISMAN7, Irene RAMIRES8
1- DDS, MSc, PhD, Full Professor, Discipline of Biochemistry, Department of Biological Sciences, Bauru School of Dentistry, University of São Paulo, Bauru, SP, Brazil.
2- DDS, Bauru School of Dentistry, University of São Paulo, Bauru, SP, Brazil.
3- DDS, MSc, PhD, Department of Biological Sciences, Bauru School of Dentistry, University of São Paulo, Bauru, SP, Brazil.
4- DDS, MSc, PhD, Professor, Department of Pediatric Dentistry, Araçatuba Dental School, Univ. Estadual Paulista - UNESP, Araçatuba, SP, Brazil. 5- BSc, Bauru School of Dentistry, University of São Paulo, Bauru, SP, Brazil.
6- DDS, MSc, PhD, Professor, Department of Biological Sciences, Bauru School of Dentistry, University of São Paulo, Bauru, SP, Brazil. 7- DDS, MSc, PhD, Professor, Department of Social and Preventive Dentistry, Federal University of Rio de Janeiro, Rio de Janeiro, Brazil. 8- DDS, MSc, Department of Biological Sciences, Bauru School of Dentistry, University of São Paulo, Bauru, SP, Brazil.
*")""+ Profa. Dra. Marília Afonso Rabelo Buzalaf - Faculdade de Odontologia de Bauru - USP - Departamento de Ciência Biológicas – Disciplina de Bioquímica - Al. Dr. Octávio Pinheiro Brisolla, 9-75 - Vila Universitária - 17012-101 - Bauru - SP - Brazil - e-mail: [email protected]
4"+;<=><?"@B+*B<C<=><? *B"+B<D<=><
F
luoridation of the public water supplies is recognized as among the top ten public health achievements of the twentieth century. However, the positive aspects of this measure !"# in the public water supply in Bauru, SP, Brazil in an attempt to verify, on the basis of risk/ $ % & & " & 2004 to February 2011, 60 samples were collected every month from the 19 supply sectors of the city, totaling 4,641 samples. F concentrations in water samples were determined in %'($ ! )*+)# '-35--3 % $ ' 7($ 8 & !: # " ranged between 0.73±0.06 and 0.81±0.10 mg/L for the different sectors during the seven years. The individual values ranged between 0.03 and 2.63 mg/L. The percentages of the > 7? >$? !+@@(+AC ' "DE# $ % % % % $% sixth, and seventh years of the study were 82.0, 58.5, 37.4, 61.0, 89.9, 77.3, and 72.4%, respectively, and 69.0% for the entire period. Conclusions: Fluctuations of F levels were found in the public water supply in Bauru during the seven years of evaluation. These '' ' %% for the appropriate adjustments.Key words: Fluoridation. Water treatment. Water analysis. Fluorides. Oral health.
INTRODUCTION
M $ Centers for Disease Control and Prevention as one of the top ten greatest public health achievements of the 20th century because it is an inexpensive
$$ ( ' prevent dental caries in the population7. Systematic
'Q 7' water supplies as the most effective and socially equitable measure to promote the preventive
-7' ' in those who drink the water10,32.
8' ' % “therapeutic ratio” is low27. The space between the
($($ 7 of dental caries8 - and excess with increased risk of 8,19 - is small. Thus, in order to maximize the
$ %
27.
The need to develop control mechanisms for ' of external control. It is the principle by which, if 7 $ health, then, besides the producer’s control over the production, distribution, and consumption process, there must also be control by a third party. The implementation of surveillance systems based on external control can be an effective contribution
' 23.
Several dental and health organizations, such as the International Association for Dental Research (IADR), the European Organization for Caries Research (ORCA), the Pan-American Health Organization (PAHO), the World Health Organization (WHO), and the World Dental Federation (FDI)28,
-5 Q% Federal Law 60503 (1974), regulated by the Act
768724 (1975), states that public water supplies
is performed. For Brazilian municipalities in warm % in the water is about 0.7 mg/L, with an acceptable range of 0.6 to 0.8 mg/L21. In order to stay
within this acceptable range, operational control is essential and should be implemented by the sanitation company to guarantee the high quality of the water provided to consumers, as required by legislation24.
\ % in different regions of Brazil2,5,16,18,25,30,33. In Bauru,
state of São Paulo, fluoridation of the public water supply was implemented in 1975. Since then, reports have shown inconsistencies in the
5,17,31. In an attempt to improve
% of the public water supply was implemented in the municipality in 2004 by Bauru School of Dentistry (University of São Paulo). The aim of this study is '$ years (2004-2011) that this external control was implemented to determine whether public water appropriate levels, based on the risk/benefit balance.
MATERIAL AND METHODS
Bauru is a warm-weather city, with an annual mean maximum temperature of 27.9°C13. It is
located in the midwestern region of the state of São Paulo (the southeastern region of Brazil), with a population of around 344,00012. Water that is
supplied to the population undergoes conventional supply system is not the same for the entire city. A network of pipes from the water treatment station supplies water to 44% of the population (from surface water) and the remaining 56% of the population is supplied by 27 artesian wells. The system is divided into 19 sectors, as described by Ramires, et al.26 (2006).Each sector is individually
%7 $
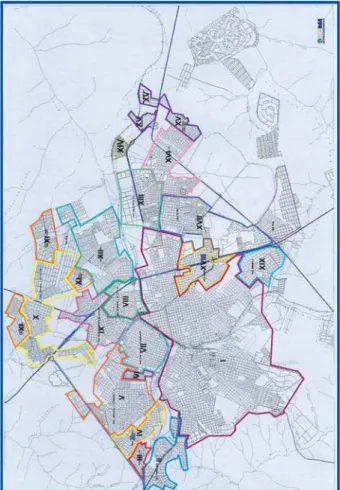
The scheme for collecting water samples was based on the characteristics of the various supply sectors (Figure 1). Three sample collection points were established for each of the 19 sectors, except for the sector supplied by the water treatment station, which had six sample collection points due to its large size and because it is surrounded by many other sectors.
According to this protocol, 60 water samples
should be collected each month, totaling 720 samples per year. Therefore, the number of samples analyzed for the period March 2004 to February 2011 was 5,040. The collection points were located at public institutions, primary health care units, and state and municipal schools, in order to make site access easy and to avoid losses. Before beginning, $ to the Bureaus of Education and Health and the Sectional Directory of Education, which authorized the study.
Plastic vials were used for sample collection. Each vial was labeled in advance to identify its
sector, collection point, and date of collection. At the end of the collection day, the samples (50 mL) were stored at -20°C for up to one week for subsequent
Fluoride concentrations in the water samples ($ ! )*+)% $%5 %&3%_3# to a potentiometer (Procyon, model 720, Procyon Instrumentos Científicos Ltda, São Paulo, SP, Brazil). In this procedure, 1 mL of the sample was mixed with 1 mL of TISAB II to buffer the solution and provide adequate ionic strength. The electrode had previously been calibrated with standard
Years of water sample collections
Sector 1st 2nd 3rd %th 5th 6th 7th Mean±SD
I 0.69 ± 0.10 0.76 ± 0.11 0.82± 0.12 0.83 ± 0.08 0.74 ± 0.06 0.72±0.07 0.58±0.06 0.73±0.08
(0.05-0.87) (0.03-1.07) (0.03-0.98) (0.68-1.03) (0.59-0.99) (0.53-0.89) (0.32-0.77)
II 0.73 ± 0.07 0.83 ± 0.10 0.86 ± 0.11 0.80 ± 0.11 0.71 ± 0.06 0.68±0.06 0.62±0.08 0.75±0.09
(0.35-0.87) (0.58-1.25) (0.62-1.08) (0.64-1.02) (0.53-0.87) (0.51-0.79) (0.50-0.79)
III 0.80 ± 0.12 0.91 ± 0.31 0.92 ± 0.13 0.82 ± 0.11 0.72 ± 0.09 0.71±0.07 0.64±0.09 0.79±0.10
(0.54-0.98) (0.56-1.78) (0.70-1.15) (0.68-1.22) (0.50-0.85) (0.56-0.82) (0.33-1.08)
IV 0.73 ± 0.12 0.80 ± 0.10 0.86 ± 0.08 0.82 ± 0.11 0.74 ± 0.08 0.71±0.08 0.61±0.11 0.75±0.08
(0.54-0.97) (0.56-1.02) (0.73-1.01) (0.70-1.24) (0.50-0.90) (0.57-0.82) (0.27-0.97)
V 0.74 ± 0.08 0.82 ± 0.12 0.84 ± 0.12 0.76 ± 0.07 0.74 ± 0.08 0.72±0.11 0.57±0.09 0.74±0.09
(0.59-0.90) (0.68-1.15) (0.63-1.01) (0.44-0.91) (0.58-0.92) (0.51-0.96) (0.21-0.73)
VI 0.74 ± 0.07 0.81 ± 0.12 0.83 ± 0.13 0.71 ± 0.09 0.72 ± 0.08 0.74±0.10 0.60±0.08 0.74±0.08
(0.59-0.92) (0.67-1.13) (0.53-1.01) (0.44-0.87) (0.60-0.89) (0.50-0.98) (0.43-0.69)
VII 0.73 ± 0.08 0.83 ± 0.13 0.88 ± 0.10 0.85 ± 0.07 0.75 ± 0.07 0.76±0.10 0.61±0.08 0.77±0.09
(0.59-0.92) (0.65-1.15) (0.57-1.13) (0.64-0.97) (0.56-0.92) (0.42-0.93) (0.47-0.75)
VIII 0.75 ± 0.07 0.86 ± 0.13 0.91 ± 0.12 0.83 ± 0.08 0.77 ± 0.06 0.76±0.11 0.64±0.08 0.79±0.09
(0.64-0.91) (0.65-1.30) (0.65-1.12) (0.62-1.13) (0.64-0.96) (0.56-0.96) (0.51-0.76)
IX 0.76 ± 0.07 0.84 ± 0.12 0.88 ± 0.10 0.81 ± 0.09 0.76 ± 0.07 0.78±0.10 0.64±0.08 0.78±0.08
(0.61-0.91) (0.62-1.07) (0.56-1.08) (0.49-1.05) (0.60-0.94) (0.53-0.96) (0.50-0.82)
X 0.74 ± 0.07 0.80 ± 0.13 0.91 ± 0.12 0.92 ± 0.19 0.76 ± 0.05 0.79±0.10 0.61±0.07 0.79±0.11
(0.63-0.91) (0.56-1.11) (0.66-1.13) (0.70-2.63) (0.67-0.88) (0.56-0.93) (0.49-0.82)
XI 0.80 ± 0.10 0.84 ± 0.21 0.92 ± 0.13 0.91 ± 0.14 0.75 ± 0.05 0.79±0.09 0.64±0.08 0.81±0.10
(0.63-1.44) (0.55-1.23) (0.67-1.20) (0.72-1.54) (0.63-0.85) (0.59-0.93) (0.52-0.85)
XII 0.77 ± 0.07 0.85 ± 0.12 0.91 ± 0.12 0.81 ± 0.10 0.74 ± 0.06 0.78±0.12 0.60±0.09 0.78±0.10
(0.65-0.96) (0.65-1.12) (0.71-1.10) (0.68-1.06) (0.64-0.89) (0.49-1.01) (0.07-0.73)
XIII 0.70 ± 0.08 0.90 ± 0.18 0.87 ± 0.11 0.78 ± 0.17 0.75 ± 0.08 0.77±0.10 0.55±0.11 0.76±0.12
(0.11-0.85) (0.73-1.29) (0.67-1.06) (0.19-1.04) (0.45-1.11) (0.55-0.98) (0.21-0.75)
XIV 0.69 ± 0.14 0.87 ± 0.14 0.91 ± 0.20 0.80 ± 0.19 0.77 ± 0.06 0.72± 0.15 0.63±0.08 0.77±0.10
(0.12-0.91) (0.70-1.11) (0.59-1.49) (0.10-1.07) (0.60-0.89) (0.35-1.09) (0.49-0.78)
XV 0.74 ± 0.14 0.95 ± 0.17 1.00 ± 0.15 0.89 ± 0.19 0.75 ± 0.07 0.76±0.11 0.61±0.08 0.81±0.14
(0.08-0.96) (0.74-1.53) (0.63-1.48) (0.66-1.39) (0.61-0.86) (0.54-0.98) (0.51-0.78)
XVI 0.76 ± 0.10 0.90 ± 0.16 0.87 ± 0.14 0.84 ± 0.06 0.74 ± 0.08 0.81±0.09 0.61±0.10 0.79±0.10
(0.62-1.07) (0.73-1.20) (0.60-1.10) (0.74-1.02) (0.58-0.87) (0.62-1.07) (0.07-0.74)
XVII 0.76 ± 0.10 0.88 ± 0.16 0.90 ± 0.12 0.84 ± 0.10 0.74 ± 0.07 0.79±0.11 0.57±0.10 0.78±0.11
(0.56-0.97) (0.63-1.20) (0.69-1.16) (0.67-0.98) (0.57-0.86) (0.52-0.97) (0.37-0.77)
XVIII 0.76 ± 0.12 0.91 ± 0.13 0.94 ± 0.12 0.83 ± 0.10 0.74 ± 0.07 0.77±0.09 0.61±0.09 0.79±0.11
(0.57-0.99) (0.70-1.21) (0.65-1.27) (0.66-1.04) (0.51-0.89) (0.60-0.92) (0.27-0.76)
XIX 0.74 ± 0.12 0.89 ± 0.22 0.88 ± 0.14 0.83 ± 0.07 0.73 ± 0.06 0.77±0.10 0.63±0.08 0.78±0.09
(0.58-1.13) (0.66-1.63) (0.63-1.23) (0.72-1.03) (0.63-0.84) (0.57-0.94) (0.49-0.75)
Table 1-
March/2004 to February/2011
solutions containing 0.1, 0.2, 0.4, 0.8, 1.6, and 3.2 mg F/L. Only calibration curves with a maximum variation of 5% were accepted. All analyses were performed in duplicate to test the repeatability of the readings. The reproducibility of the readings was assessed by making new measurements from 10% of the samples.
$ ' 7 ! # $ ! # considerations, according to CECOL/USP, 20116. The
7 >'$? ++CC'DE`>? +C@+AC 'DE`> ? between 0.85 and 1.14 mg/L; “high” for samples ||@|CC'DE` > '? }|C@'DE~ '$% ''++CC'DE >'$?% ''+C@+@C'DE% +@@||C'DE%||@(|CC'DE%}|C@ mg/L were regarded as “minimum”, “maximum”, “questionable”, and “harmful”, respectively (Table #3 '$% ideal interval for fluoride concentration in the drinking water samples should have been between 0.55 and 0.84 mg/L because that level is associated 7 $ prevention.
Descriptive statistics were applied to the data, including absolute and relative frequencies, means, and standard deviations.
RESULTS
During the course of seven years, 4,641 samples were analyzed. The numbers of samples analyzed in the 1st, 2nd, 3rd, 4th, 5th, 6th, and 7th years were 677,
691, 567, 684, 671, 671, and 680, respectively. A total of 399 samples were lost or excluded during the period of collection due to a lack of water at the time of collection in some sectors or other technical problems.
& 19 supply sectors in each year and for the seven years of collection are shown in Table 1. The means for the seven years ranged between 0.73±0.08 and 0.81±0.14 mg F/L. During that period of time, the lowest concentration found was 0.03 mg F/L, while the highest was 2.63 mg F/L. Observing the |% $ 7 $ However, in the last studied year (7th), there was
a tendency for lower concentrations with sectors ' 7$$
$ ' % 7D
$ 6. The percentage of samples
classified as low risk for dental fluorosis and $ !+@@(+AC mg F/L) during the seven years of the study was 69%. Regarding the individual years, most of the $ 7$
F concentration 1st
2nd 3rd %th 5th 6th 7th Total @By
mg/L n (%) n (%) n (%) n (%) n (%) n (%) n (%) n (%) Risk @B
0 - 0.44 12
(1.8) 3 (0.4) 2 (0.4) 7 (1.0) 0 (0.0) 4 (0.6) 20 (2.9) 48 (1.0) ! !
0.45 - 0.54 3
(0.4) 0 (0.0) 1 (0.2) 3 (0.4) 9 (1.3) 20 (3.0) 162 (23.8) 198 (4.3) low minimum
0.55 - 0.84 555
(82.0) 404 (58.5) 212 (37.4) 417 (61.0) 603 (89.9) 519 (77.3) 492 (72.4) 3202 (69.0) low maximum
0.85 - 1.14 106
(15.7) 246 (35.6) 328 (57.8) 246 (36.0) 59 (8.8) 127 (18.9) 5 (0.7) 1117 (24.1) moderate maximum
1.15 – 1.44 1
(0.1) 33 (4.8) 22 (3.9) 8 (1.2) 0 (0.0) 0 (0.0) 0 (0.0) 64 (1.4) high questionable >=1.45 0 (0.0) 5 (0.7) 2 (0.4) 3 (0.4) 0 (0.0) 1 (0.1) 1 (0.1) 12 (0.3)
very high harmful
n 677 (14.6) 691 (14.9) 567 (12.2) 684 (14.7) 671 (14.5) 671 (14.5) 680 (14.7) 4641 (100.0)
Table 2- "! #$$% February/2011
DISCUSSION
public water supply was implemented in Bauru that were revealed in previous studies5,17,31. In
Bauru, the Water and Sewage Department is a municipal organ. The researchers decided that, for this reason, it would not be appropriate for implemented by the Health Department of the city because it is also a municipal organ6. When
conducted by an institution not involved in the % ' and credibility to the results obtained24.
To conduct the study, the city was divided into 19 sectors, each of which has its own characteristics and because water fluoridation is performed individually in each of them. Thus, the researchers determined that the calculation of a mean water be of practical relevance, as the citywide average '7 sectors. This would provide information that would not correspond to the real situation of the as a whole.
As can be seen in Tables 1 and 2, there was considerable improvement in the quality of of Bauru during the period of the study when compared to results from previous studies5,17,31.
In 1997, there was a variation of between 0.05 and 1.40 mg F/L in the 330 samples of public water analyzed. Only 16.36% of the samples
(0.6-0.8 mg/L)31. In 2002,
were lower than optimum (0.8 mg/L) in 89% of the samples analyzed. Additionally, a very wide range was observed (between 0.01 and 9.35 mg
F/L)5 - ++*%
concentrations of the water samples varied between 0.31 and 2.01 mg F/L. Nearly 56% of the samples $ ' between October/2002 and March/200317.
During the seven years of monitoring for the present study, 69% of the samples presented ''+@@ +AC'"DE%$ 7
$ 6. Even
during the first year after implementation of external control, positive results were observed, %AQ $ 7 $% ' to those reported for the city of Campo Grande (in the midwest region of Brazil)2. On the other
hand, they were much more favorable than those reported for three cities in the state of Piauí (in the northeast region of Brazil) since only 4.3% of Q concentrations30. The improvement may be due to
the fact that the Water and Sewage Department of Bauru had been informed of the previous results ' ' concentrations5 and about the implementation of
the external control.
However, between the second and fourth years of monitoring, the number of samples considered 7$% ( \ %% levels ranged between 0.85 and 1.14 mg/L, which $ 7 $6. It must be highlighted that these levels
one day during each month, i.e., they may not be representative of the entire month. In addition, it has been reported that, in schoolchildren, perceived is very low11.
" mainly related to temperature, instability of the %$ 7' the system working15. The Water and Sewage
Department was advised about the tendency toward ( ' % % fourth years of external control. This might have led to the considerable improvement in the quality ' $ % )+ $ 7 $ However, during the sixth and seventh years of '% '$ 7$ ' This indicates that the external monitoring, after having been implemented, should be continued for a long period of time. It is important to mention that as part of the program of external control as a whole, the results obtained are published yearly in a local newspaper in order to inform the population. This is an important measure that should be maintained.
-( $' % in Chapecó (in the south region of Brazil) was observed 10 years after the implementation of external control25. Therefore, it is clear that external
extremely important role in terms of its additional efforts toward improving the oral health conditions of the population and should be guaranteed by government and social control.
Despite the fact that Federal3 and State29
|+'"DE% Ministry of Health accepts concentrations up to 1.5 mg F/L as the upper limit of potability22. Brazil is
a country of great territorial extension with a wide range of different temperatures, which makes the determination of a unique range of concentrations $ 7 $ - Q water as low as 0.2 mg/L can result in measurable alterations in the prevalence and severity of dental
1 % (
lead to ineffective control of dental caries9.
$ proportionally larger in the segments of society that % %
it the most14\ % 7'
water have to be adequate to prevent dental caries and, at the same time, not increase the risk for
In summary, the results of the present study reinforce the belief in the importance of the implementation and maintenance of external should be implemented wherever there is adjusted % revealed. This measure is fundamental to achieve $ % contributes to improve the oral health condition of people who drink water from those supplies.
ACKNOWLEDGEMENTS
This study was supported by CNPq (Conselho ~$'% Edital Saúde Bucal, Grant 403427/2004-5).
CONFLICTS OF INTEREST
The authors have no conflict of interest to declare.
REFERENCES
|(3%" 7 ' Crit Rev Oral Biol Med. 2002;13:155-70.
2- Bellé BLL, Lacerda VR, De Carli AD, Zafalon EJ, Pereira PZ. 3 'Q urbana do município de Campo Grande (MS). Cien Saude Colet. 2009;14:1261-6.
3- Brasil. Lei nº 6050, de 24 de maio de 1974. Dispõe sobre ' existir estação de tratamento. [cited 18 Jun 2010]. Available from: <http://www.planalto.gov.br/ccivil_03/Leis/L6050.htm>.
4- Brasil. Decreto nº 76.872, de 22 dezembro 1975. Regulamenta a lei nº 6.050, de 24 de maio de 1974, que dispõe sobre a ' $_5 %Q|)@3 DD www.planalto.gov.br/ccivil_03/decreto/Antigos/D76872.htm>. 5- Buzalaf MA, Granjeiro JM, Damante CA, Ornelas F. Fluctuations 5 %5 Q\ Dent. 2002;62:173-6.
6- Collaborative Center of Brazilian Health Ministry for Oral Health (~~ED_ 7' $ ' Paulo: Public Health School of São Paulo University; 2011. 7- Centers for Disease Control and Prevention. Achievements in %|)++(|))) 7' dental caries. JAMA. 2000;283:1283-6.
8- Dean HT, Arnold FA Jr, Elvove E. Domestic water and dental 3 waters to dental caries experience in 4,425 white children aged 12-14 years of 13 cities in 4 states. Publ Health Rep. 1942;57:1155-79.
9- Dean HT, Elvove E. Further studies on the minimum threshold of \8|)`@|C)( 64.
10- Featherstone JD. Prevention and reversal of dental caries: role of low level fluoride. Community Dent Oral Epidemiol. 1999;27:31-40.
||( $%5 %E73%5 7 E objectionable fluorosis attributable to water fluoridation. Community Dent Oral Epidemiol. 2002;30(3):199-209
|(-5 ' $!-5#~ Bauru. [cited 2011 Apr 14] Available from: <http://www.ibge.gov. br/cidadesat/topwindow.htm?1>.
13- Instituto de Pesquisas Meteorológicas (IPMet). Características da Estação do Verão. Comportamento da Região de Bauru. [cited 2011 Apr 15]. Available from: <http://www.ipmet.unesp. br/4estacoes/#>.
|C( ~&% M ' \ M % tooth decay in 12-year-old children. J Dent. 2000;28:389-93. 15- Kuthy RA, Naleway C, Durkee J. Factors associated with 3 3 1985;110:511-3.
16- Lima FG, Lund RG, Justino LM, Demarco FF, Del Pino FA, " 8 das águas de abastecimento público de Pelotas, Rio Grande do Sul, Brasil. Cad Saúde Pública. 2004;20:422-9.
17- Lodi CS, Ramires I, Buzalaf MA, Bastos JR. Fluoride concentration in water at the area supplied by the Water Treatment Station of Bauru, SP. J Appl Oral Sci. 2006;14:365-70.
18- Maia LC, Valença AM, Soares EL, Cury JA. Controle operacional ' %8 %5 ~ Pública. 2003;19:61-7.
|)(& 3%&\' drinking water may increase the prevalence and severity of dental % 5 Pract. 2008;8:15-6.
20- McDonagh MS, Whiting PF, Wilson PM, Sutton AJ, Chestnutt -%~ % 5& 2000;321:855-9.
24- Narvai PC. Fluoretação da água: heterocontrole no município de São Paulo no período de 1900-1999. Rev Bras Odontol Saude Coletiva. 2000;1:50-6.
@(QQ&% &3 Q de águas em Chapecó, Estado de Santa Catarina, Brasil. Cad Saúde Publica. 2008;24:2021-31.
26- Ramires I, Maia LP, Rigolizzo DS, Lauris JR, Buzalaf MA. in Bauru, SP, Brazil. Rev Saude Publica. 2006;40:883-9. 27- Rugg-Gunn A, Villa AE, Buzalaf MAR. Contemporary biological 7 -5Q&38!#" and the oral environment. Basel: Karger; 2011. pp 37-51. 28- Saliba NA, Moimaz SA, Tiano AV. Fluoride level in public water supplies of cities from the northwest region of São Paulo State, Brazil. J Appl Oral Sci. 2006;14:346-50.
29- Secretaria da Saúde de São Paulo. Resolução no SS-250, |@'|))@ $ ' % $ % Paulo, 15 ago 1995.
30- Silva JS, Val CM, Costa JN, Moura MS, Silva TAE, Sampaio "~\ ' ¥ Piauí, Brasil. Cad. Saúde Pública. 2007;23:1083-8.
|( %58&~ ' % 5 (8 Ass Paul Cirur Dent. 1999;53:407-15.
(~&8 % 1997;105:461-5.