Contribution to the
mutational spectrum
of Maple Syrup Urine
Disease and
functional
characterization of
the alteration
c.108+6T>C in
BCKDHA gene.
Ana Luísa Archer Carvalho Castro Taveira
Dissertação de Mestrado apresentada à
Faculdade de Ciências da Universidade do Porto em
Biologia Celular e Molecular
2014
C on tri bu tion to the mut ati on al sp ec trum of M ap le S y rup U ri ne D ise as e an d fun cti on al ch aracteri zati on of the alt erati on c.108+6T >C in BCKDHA gene. A n a L u ísa A rcher Car v alho Castro T av eir a FCUP IPATIMUP 2014 2.º CICLOMaple Syrup Urine
Disease and
functional
characterization of
the alteration
c.108+6T>C in
BCKDHA gene.
Ana Luísa Archer Carvalho Castro Taveira
Mestrado em Biologia Celular e Molecular
Departamento de Biologia 2014
Orientador
Doutora Maria Sofia Pacheco Quental, Investigadora
Pós-Douturamento, Instituto de Patologia e Imunologia Molecular da
Universidade do Porto (IPATIMUP)
Coorientador
Professora Doutora Maria João Prata Martins Ribeiro, Professora
Associada, Faculdade de Ciências da Universidade do Porto e
Investigadora, Instituto de Patologia e Imunologia Molecular da
Universidade do Porto (IPATIMUP)
Dissertação para a candidatura ao grau de Mestre em Biologia Celular e Molecular submetida à Faculdade de Ciências da Universidade do Porto.
O presente trabalho foi desenvolvido sob a orientação científica da Doutora Maria Sofia Ferreira Pacheco Quental e co-orientação da Prof. Doutora Maria João Prata Martins Ribeiro e foi realizado no Instituto de Patologia e Imunologia Molecular da Universidade do Porto.
Dissertation to apply for the Master’s Degree in Cell and Molecular Biology, submitted to the Faculty of Sciences of the University of Porto.
The present work was developed under the scientific Supervision of Doctor Maria Sofia Ferreira Pacheco Quental and co-supervision of Prof. Doctor Maria João Prata Martins Ribeiro
and was done at the Institute of Molecular Pathology and Immunology of University of Porto.
“Que os vossos esforços desafiem as impossibilidades, lembrai-vos de que as grandes coisas do homem foram conquistadas do que parecia impossível.”
Agradecimentos
À Sofia, minha orientadora, por ter aceitado orientar uma das etapas mais importantes do meu
percurso académico e por ter sido uma pessoa incansável nesta etapa. Obrigada por toda a preocupação, todo o empenho, todos os ensinamentos, toda a orientação, todo o apoio, toda a paciência, todas as sugestões e por seres a ótima pessoa que és. Nunca me senti sozinha nesta luta, pois sabia que podia sempre contar contigo. Obrigada! A ciência precisa de pessoas como tu, que ajudam os outros com toda a vontade e entusiasmo.
À Prof. Doutora Maria João Prata, por ter aceitado ser minha co-orientadora e por estar sempre
disponível para o que precisasse. Obrigada por todos os ensinamentos e por todas as sugestões feitas durante a realização desta dissertação de mestrado e por toda a simpatia com que sempre me recebeu.
À Liliana por toda a ajuda no início do trabalho e ao longo deste sempre que era necessário.
Ao Prof. Doutor José Pissarra, diretor do Mestrado em Biologia Celular e Molecular da
Faculdade de Ciências da Universidade do Porto, por todo o trabalho realizado em prol deste mestrado.
Ao corpo docente do Mestrado em Biologia Celular e Molecular por todos os ensinamentos
dados que me foram úteis durante a realização desta dissertação de mestrado e que o serão com certeza para o futuro.
Ao grupo de Genética Populacional do IPATIMUP, por me terem recebido e por estarem
sempre prontos a ajudar e obrigada também a alguns membros de outros grupos que ajudaram sempre que solicitado.
Aos meus Pais, Eduardo e Glória, e à minha irmã Sara por todo o apoio, não só ao longo
desta etapa, mas ao longo de toda a minha vida. Obrigada por construírem um lar onde me sinto sempre segura e feliz!
A toda a restante família por todo o apoio e por terem ajudado a formar a pessoa que sou hoje.
Aos meus amigos por todo o apoio, por todos os momentos de amizade bem passados que
fazem a vida valer a pena, por todas as gargalhadas dadas e por todos os momentos de incentivo.
Resumo
A leucinose é uma doença autossómica recessiva que envolve o metabolismo dos aminoácidos ramificados (BCAAs) – leucina, isoleucina e valina – e cuja incidência na maioria das populações é de 1/185.000 recém-nascidos. Mutações num dos três genes- BCKDHA,
BCKDHB e DBT – que codificam os componentes catalíticos E1α, E1β e E2, respetivamente, do
complexo da desidrogenase dos α-cetoácidos ramificados (BCKD) podem causar leucinose. Neste trabalho, fez-se a caracterização molecular de 2 doentes recentemente diagnosticados com leucinose. Num deles, de origem angolana, foi detetada uma deleção de 11 bp (c.93_103del11; p.Ala32Phefs*48) em homozigotia no gene BCKDHB, que já tinha sido anteriormente descrita. No outro paciente, de origem portuguesa, identificaram-se duas mutações em heterozigotia, c.799C>T (p.Gln267X) e c.359T>C (p.Phe120Ser), também no gene
BCKDHB. Como a mutação c.359T>C nunca tinha sido descrita, para avaliar o seu possível efeito
patogénico, usaram-se vários programas bioinformáticos e analisou-se o efeito da alteração na estrutura 3D da proteína, tendo sido obtido resultados consistentemente apontando para o efeito causal da mutação.
Por outro lado, foi efetuada a análise funcional da mutação c.108+6T>C do gene
BCKDHA. Esta alteração tinha sido detetada pela primeira vez num doente de origem brasileira
também diagnosticado com leucinose. Tendo as análises preliminares in silico indicado que a alteração deveria muito provavelmente alterar o normal padrão de splicing do gene em que ocorria, no sentido de confirmar o efeito patogénico recorreu-se à construção de minigenes através da clonagem do exão 1 e parte do intrão 1 do gene BCKDHA, com e sem mutação, no vetor pSPL3. O estudo do minigene em células HeLA e AGS e posterior extração do RNA e síntese do cDNA possibilitou a análise dos transcritos processados. Pela comparação dos transcritos produzidos pelo minigene WT e pelo minigene com a mutação, concluiu-se que a mutação comprometia o processo de splicing da zona genómica em estudo, causando o skipping do exão clonado no vector pSPL3. Deste modo, afigura-se altamente expectável que in vivo a mutação c.108+6T>C faça com que o local de splicing onde se localiza deixe de ser reconhecido, causando o skipping do exão 1.
Este trabalho veio enriquecer o conhecimento sobre o espectro mutacional da leucinose, uma vez que resultou na descrição de duas novas mutações, uma delas missense (c.359T>C; p.Phe120Ser em BCKDHB) e a outra de splicing (c.108+6T>C em BCKDHA). Para a última, foi
ainda possível confirmar a nível funcional o seu efeito ao nível do mRNA do gene BCKDHA, contribuindo para reforçar o papel da desregulação do splicing como agente responsável por doenças.
O trabalho permitiu também demonstrar a eficácia da estratégia baseada na construção e clonagem de minigenes para avaliar o efeito de mutações suspeitas de afetar o splicing. O esforço agora desenvolvido para estabelecer adequadamente os procedimentos técnicos necessários, permitirá no futuro a utilização dos minigenes para investigar o efeito de outras mutações candidatas a interferir no processo de splicing.
Abstract
Maple syrup urine disease (MSUD) is an autosomal recessive disease that affects the metabolism of branched-chain amino acids (BCAAs) – leucine, isoleucine and valine, whose incidence is about 1/185.000 live newborns in most populations. Mutations in any of the three different genes – BCKDHA, BCKDHB and DBT – encoding respectively for the E1α, E1β and E2 catalytic components of the branched-chain α-ketoacid dehydrogenase (BCKD) complex can cause maple syrup urine disease (MSUD).
In this study, the molecular characterization of two newly diagnosed patients with MSUD was conducted. In one of them, with Angolan origin, a previously described deletion of 11 bp (c.93_103del11; p.Ala32Phefs*48) was identified in homozygosity in BCKDHB gene. In the other patient, with Portuguese origin, two mutations in heterozygosity were identified also in BCKDHB, c.799C>T (p.Gln267X) and c.359T>C (p.Phe120Ser). The c.359T>C mutation had never been described and as so, to assess their possible pathogenic effect several bioinformatics programs were used as well as it was performed 3D structure analysis, obtaining results consistently pinpointing the disease causative effect of the mutation.
Furthermore, the functional analysis of the substitution c.108+6T>C in intron 1 of BCKDHA previously identified in a patient from Brazil diagnosed with MSUD was also performed. Since preliminary in silico analyses had indicated that it probably induced an alteration in the normal splicing pattern of the gene, in order to confirm the previsions, a minigene system was constructed by cloning exon 1 and part of intron 1 of BCKDHA gene, with and without the substitution, in pSPL3 vector.
The study of this minigene in HeLa and AGS cells and subsequent RNA extraction and cDNA synthesis allowed the analysis of the processed transcripts. Through the comparison of the transcripts produced by the WT minigene and by the mutant one, it was possible to conclude that the alteration indeed affected the splicing process in the gene since the presence of the c.108+6T>C mutation resulted in the skipping of the exon cloned into pSPL3 vector. Therefore, it seems very likely that in vivo the mutation causes the skipping of exon 1 of BCKDHA gene.
This work contributed to increase the knowledge on the mutational spectrum of MSUD since it led to identify two new alterations, one missense mutation (c.359T>C; p.Phe120Ser in
BCKDHB) and a splicing mutation (c.108+6T>C in BCKDHA). Concerning this latter, its
Furthermore, this work has evidenced the efficiency of a strategy based on the construction of minigene systems to evaluate the effect of a mutation of uncertain pathogenic impact on splicing. The efforts invested in the implementation of reliable methodologies, will allow in the future to extend the approach to other mutations that might interfere with splicing.
Table of contents
Agradecimentos………9 Resumo……….11 Abstract……….13 Table of contents………15 Table Index………...17 Figure Index……….18 Abbreviations………..23 1. Introduction ………271.1. Branched-chain amino acids metabolism……….27
1.2. Branched-chain α-ketoacid dehydrogenase complex………...28
1.3. Maple Syrup Urine Disease………..30
1.3.1. Clinical phenotypes………30
1.3.2. Diagnosis………..31
1.3.3. Treatments………32
1.3.4. Incidence and mutational spectrum………...34
1.4. Splicing process………..34
1.5. Alternative splicing……….37
1.6. Splicing and disease………..38
1.7. Use of minigenes to study splicing mutations………....40
2. Aims………..43
3. Material & Methods………...45
3.1. Molecular characterization of MSUD patients……….45
3.1.1. Samples and DNA extraction………...45
3.1.2. Amplification by PCR……….45
3.1.3. Evaluation of the success of PCR by polyacrylamide gel electrophoresis…...47
3.1.4. Sanger Sequencing and electropherogram analysis………47
3.1.5. Bioinformatic analysis………...48
3.1.6. Protein structural analysis………...48
3.2. Functional characterization of the alteration c.108+6T>C within BCKDHA gene – Construction of reporter minigenes………...48
3.2.1. Construction of intermediate minigene vector………...49
3.2.1.1. Amplification of the BCKDHA genomic DNA fragment covering the target region………..49
3.2.1.2. Amplification of the region of interest of pSPL3 vector………50
3.2.1.3. Enzymatic restriction of DNA fragments from BCKDHA gene and pSPL3 vector with SalI……….51
3.2.1.4. Ligation of SPR exon 2 to BCKDHA fragment………..52
3.2.1.5. Cloning of PCR product in TOPO TA cloning vector (pCR®2.1-TOPO®)….53 3.2.1.6. Transformation of One Shot® TOP 10 Chemically Competent Cells………..53
3.2.2. Construction of final minigene splicing vectors………55
3.2.2.1. Digestion of pSPL3 splicing vector and intermediate minigene vector with BamHI and EcoRV………55
3.2.2.2. Ligation of SPR-BCKDHA fragment into pSPL3 vector……….56
3.2.2.3. Transformation of TOP10 Chemically competent Cells with the minigene vector………...56
3.2.3. Mutagenesis……….57
3.3. Cell culture and transfection………57
3.3.1. Culture and cell counting……….57
3.3.2. Transfection……….59
3.3.3. RNA isolation………...60
3.3.4. cDNA synthesis by reverse transcription………60
3.3.5. Transcript analysis……….61
4. Results and discussion………...63
4.1. Molecular characterization of MSUD patients……….63
4.1.1. Patient 1……….63
4.1.2. Patient 2……….64
4.1.3. Patient 3………....68
4.2. Functional characterization of the alteration c.108+6T>C within BCKDHA gene………69
4.2.1. In silico splicing analysis……….70
4.2.1.1. GENSCAN (http://genes.mit.edu/GENSCAN.html)...70
4.2.1.2. Splice Site Prediction by Neural Network (NNSplice)………71
4.2.1.3. MaxEntScan………...72
4.2.1.4. Human Splicing Finder………...72
4.2.1.5. NetGene2………....73
4.2.2. Cloning and construction of reporter minigenes………...74
4.2.2.1. Construction of an intermediate minigene vector………..75
4.2.2.2. Construction of final minigene splicing vector………77
4.2.2.3. Mutagenesis………..78
4.2.2.4. Transfection and cDNA analysis………..79
5. Conclusion………..83
Table Index
Table 1. PCR program used to amplify the entire coding and flaking intronic regions of the three
genes that are most frequently affected in MSUD (BCKDHA, BCKDHB and DBT)………45
Table 2. Sequences and annealing temperatures of primers used in amplification of entire coding and flaking intronic regions of the three genes that are most frequently affected in MSUD (BCKDHA, BCKDHB and DBT)………...46
Table 3. Composition of a polyacrylamide gel with small dimensions………...47
Table 4. Thermal cycler conditions for the sequencing reaction……….47
Table 5. PCR conditions used to amplify a genomic fragment of BCKDHA gene………50
Table 6. PCR conditions used to amplify the region of pSPL3 vector that includes SPR exon 2 fused to exon 1 of ALDH7A1………51
Table 7. PCR conditions used in the amplification of the ligation product of SPR exon 2 and BCKDHA fragment………53
Table 8. Colony PCR conditions used to identify positive colonies………54
Table 9 – Components for the reverse transcription reaction……….61
Table 10. PCR conditions reaction for amplification of cDNA samples……….62
Figure Index
Figure 1. BCAA catabolic pathways. The first step is transamination of the BCAAs (leucine (Leu), isoleucine
(Ile), valine (Val) to produce the branched-chain α-keto acids (BCKAs): α-ketoisocaproate (KIC), α-keto-β-methylvalerate (KMV) and α-ketoisovalerate (KIV). α-ketoglutarate is the α-keto acid acceptor of the BCAA α-amino group and glutamate (Glu) is the product. The second catabolic step is oxidative decarboxylation, catalyzed by the branched chain α-keto acid dehydrogenase (BCKD) complex. Leucine is ketogenic, forming acetyl-CoA and acetoacetate, valine is glucogenic, entering the tricarboxylic acid (TCA) cycle as succinyl-CoA, whereas isoleucine is both ketogenic and glucogenic. Adapted by Hutson et al., 2005……..28
Figure 2. Representation of the branched chain α-ketoacid dehydrogenase (BCKD) complex. Adapted from (A et al., 2000)……….30
Figure 3. Exonic and intronic elements (Cooper, 2005)………...36 Figure 4. A simplified view of the spliceosome and process of splicing. Splicing involves several
RNA-protein complexes, called small nuclear ribonucleoRNA-proteins (snRNPs), which together make up the spliceosome. U1 snRNP binds to the boundary between exon 1 and the intron by recognizing a specific sequence. U2 snRNP subsequently binds to the branch site (A) and then U4/U5/U6 triple snRNPs join in. After a dynamic rearrangement, U1 and U4 are destabilized, and the remaining snRNP complex is activated for the two steps that remove the intron and stitch together exons 1 and 2 (Gottlieb, 2003)………37
Figure 5. Different modes of alternative splicing. Adapted from (Matlin et al., 2005)………38 Figure 6. Examples of different splicing events and their consequences at protein level due to changes in
pre-mRNA expression that can cause disease. In the process of splicing can happen the removal of exons or retention of introns resulting in the formation of different mature mRNA transcripts for the same gene. Different mature mRNA transcripts encode for different proteins (Faiz and Burgess, 2012)………..40
Figure 7. Representative scheme of the construction of a minigene in a plasmid vector. CMV –
cytomegalovirus transcriptional enhancer/promoter. RS #1 and RS#2 – restriction sites located on the plasmid. The genomic fragment to be cloned into the minigene is amplified from genomic DNA using oligonucleotides containing restriction enzyme sites at their 5’ ends that match restriction sites in the plasmid. These sites depend on the available cloning sites within the minigene (RS#1 and RS#2) (Cooper 2005)………....42
Figure 8. Representation of the pSPL3 splicing vector that contains the hybrid exon formed by part of SPR
exon 2 fused to ALDH7A1 exon 1. Adapted from Perez et al. 2013 (Perez et al., 2013)………..49
Figure 9. Schematic representation of the fragment amplified from BCKDHA gene including the region of
the c.108+6T>C mutation (203 bp of exon 1 and 301 bp of intron 1) using primers BCKDHA_SalI_F and BCKDHA_EcoRV_R_new………50
Figure 10. Representation of the fragment amplified from pSPL3 vector that includes part of exon 2 of
sepiapterin reductase (SPR) gene fused to exon 1 of ALDH7A1 gene (Pérez et al., 2013) with primers pSPL3_E2E1_F and pSPL3_E2E1_R………51
Figure 11. Cloning of the hybrid vector (SPR-BCKDHA) in TOPO TA cloning vector………..53 Figure 12. Schematic representation of construction of final minigene vector (insert of interest + pSPL3
vector). A. Enzymatic digestion of TOPO vector with restriction enzymes BamH I and EcoR V to extract the insert of interest (part of of sepiapterin reductase (SPR) gene fused to part of exon 1 and part of intron 1 of BCKDHA gene). B. Ligation of insert extracted from TOPO vector to pSPL3 vector after pSPL3 vector has been also digested with restriction enzymes BamH I and EcoR V (mentioned in 3.2.2.2)………56
Figura 13. Example of a Neubauer chamber to count cells……….58 Figure 14. Representation of transfection in the 6-well plate. In A1 it is present HeLa cells transfected with
empty pSPL3 vector; in A2 it is present HeLa cells transfected with wild-type (WT) vector and in A3 it is present HeLa cells transfected with vector with the mutation c.108+6T>C in BCKDHA. In line B is the same but for AGS cells……….60
Figure 15. Representation of the 11 bp deletion in BCKDHB gene that causes MSUD in patient 1 in
comparison with a reference sequence. A. Reference sequence. B. Sequence of BCKDHB gene from patient 1, in which the deletion c.93_103del can be observed……….64
Figure 16. Representation of mutation c.799C>T in BCKDHB gene in comparison to a reference DNA. A.
Sequence of from patient 2, were the mutation c.799C>T is present. B. Reference sequence…………...65
Figure 17. Representation of the mutation c.359T>C in BCKDHB gene in comparison to a reference
Figure 18. Prediction made by PolyPhen-2 program. It is predicted that the mutation in the Phe120-β
residue, p.Phe120Ser, is functionally damaging with a score of 1………...66
Figure 19. Predicted effect of the mutation p.Phe120Ser in E1β protein………...67
Figure 20. Structural representation of E1 heterotetramer: E1α (purple); E1β gray); E1α′ (blue) and E1β′ (yellow). The phenylalanine residue that undergoes the alteration is represented in orange………..68
Figure 21. Structural representation of part of E1 β subunit of BCKD complex A. Structural representation of normal E1 β protein (120Phe) in which it is possible to observe the interactions that Arg111 located in helix 2, establishes with Lys116, positioned in the loop between helix 2 and strand c, and Val119, situated in strand c. B. Structural representation of mutant E1 β protein (120Ser) in which the referred two interactions are no longer established……….68
Figure 22. Representation of the mutation c.108+6T>C in intron 1 of BCKDHA gene. The substitution in highlighted in blue………..69
Figure 23. Predicted exon with GENSCAN program, analyzing the normal sequence. The length of predicted exon and the score are surrounded by a red circle………...70
Figure 24. Predicted exon with GENSCAN program, analyzing the sequence with mutation c.108+6T>C. The length of predicted exon and the score are surrounded by a red circle………71
Figure 25. Prediction of maximum entropy with normal sequence……….72
Figure 26. Prediction of maximum entropy with sequence with mutation c.108+6T>C………...72
Figure 27. Potential splice sites predicted by BDGP program……….73
Figure 28. Representation of the pSPL3 splicing vector that contains the hybrid exon formed by part of SPR exon 2 fused to ALDH7A1 exon 1 which was used as final minigene by Perez et al. (Perez et al., 2013)………75
Figure 29. Agarose Gel Electrophoresis of PCR Products A. Ladder of 100 bp. B. PCR product of fragment
from BCKDHA gene (530 bp; the size of the fragment is longer than 504bp because of the extra bases included in both primers). C. negative control of PCR reaction of fragment from BCKDHA gene. D. PCR product of fragment from pSPL3 vector (594 bp). E. negative control of PCR from fragment of pSPL3 vector………...75
Figure 30. A. Ladder of 1000 bp. B. PCR product of the ligation of SPR and BCKDHA fragments after
digestion with restriction enzyme SalI. C. Negative control from PCR reaction……….76
Figure 31. Representation of the ligation between exon 2 from SPR gene and exon 1 and part of intron 1
from BCKDHA gene A. Reference sequence created in Geneious program. B. Electropherogram of the fragment corresponding to ligation between SPR and BCKDHA fragments………..76
Figure 32. Colony PCR from some of the colonies that grew after the transformation of TOP10 competent
cells with TOPO vector with the insert of interest.The colony indicated with the arrow represents the one that has approximately the expected (with 906 bp; PCR performed with TOPO specific primers M13 F and R)………..77
Figure 33. A. Ladder of 100 bp .B. Product of enzymatic restriction of pSPL3 vector provided by Belén
Pérez with BamHI and EcoRV resulting in a fragment of 5503 bp that correspond to pSPL3 vector without the “original” insert and in a fragment of “original” insert with 528 bp. The band correspondent to pSPL3 vector without the insert was already eluted from the gel when the picture was captured. C. Product of enzymatic restriction of intermediate minigene. The results of this reaction are a fragment correspondent to TOPO vector without the insert and the other fragment correspond to the hybrid exon SPR-BCKDHA (751 bp) which was excised from the gel……….78
Figure 34. Comparison of the WT sequence with the sequence with the mutation c.108+6T>C to verify the
success of the mutagenesis reaction. The red arrow indicates where the mutation was inserted. A. WT sequence B. sequence with mutation c.108+6T>C………...79
Figure 35. Minigene analysis of the alteration c.108+6T>C. A. Schematic drawing of the hybrid exon with
the mutation c.108+6T>C cloned in pSPL3 vector with the corresponding sequence analysis. B. Post transfection PCR products of the minigene constructs obtained by SD6 and SA2 primers. L. Ladder of 100 bp. pSPL3 ø. Empty vector. WT. WT minigene. MUT. Mutant minigene. ………..80
Abbreviations
® registered trademark
µl microliter
ml milliliter
aa amino acids
ABCA1 ATP-binding cassette sub-Family A, member 1
AGS adrenogenital syndrome
ALDH7A1 aldehyde dehydrogenase 7 family, member A1
Arg arginine
AS alternative splicing
ATP adenosine triphosphate
BCAAs branched chain amino acids
BCATs branched chain aminotransferase isozymes
BCKAs branched chain α-ketoacids
BCKD branched chain α-ketoacid dehydrogenase
BCKDHA branched chain keto acid dehydrogenase E1, alpha polypeptide
BCKDHB branched chain keto acid dehydrogenase E1, beta polypeptide
BCKDK branched chain ketoacid dehydrogenase kinase
BDGP Berkeley drosophila genome project
bp base pair
°C degree Celsius
cDNA complementary deoxyribonucleic acid
DBT dihydrolipoamide branched chain transacylase
DMEM Dulbecco’s Modified Eagle Medium
DLD dihydrolipoamide dehydrogenase
DNA deoxyribonucleic acid
dNTPs deoxynucleotide triphosphates
EDTA ethylenediamine tetraacetic acid
ESE exonic splicing enhancer
ESS exonic splicing silencer
et al et alii
ExoSAP Exonuclease I and Shrimp Alkaline Phosphatase
FAD flavin adenine dinucleotide
FBS fetal bovine serum
FCUP Faculdade de Ciências da Universidade do Porto
Glu glutamine
HeLa Henrietta Lacks
hnRNP heterogeneous nuclear ribonucleoprotein
HSF human splicing finder
Ile isoleucine
IPATIMUP Institute of Molecular Pathology and Immunology at the University of
Porto
ISE intronic splicing enhancer
ISS intronic splicing silencer
KIC α-ketoisocaproate
KIV α-ketoisovalerate
KMV α-keto-β-methylvalerate
LB lysogeny broth
LDLR low density lipoprotein receptor
Leu leucine
NaCl sodium chloride
NMD nonsense-mediated decay
mRNA messenger ribonucleic acid
MS/MS tandem mass spectrometry
MSUD maple syrup urine disease
NAD nicotinamide adenine dinucleotide
NNSplice splice site prediction by neural network
PBS phosphate buffered saline
PCR polymerase chain reaction
PDC pyruvate dehydrogenase complex
Phe phenylalanine
PP2Cm protein phosphatase 2Cm
PPM1K protein phosphatase 1K
RNA ribonucleic acid
rpm rotations per minute
RPMI Roswell Park Memorial
RT reverse transcriptase
RT-PCR reverse transcription polymerase chain reaction
SDM site directed mutater
Ser serine
snRNA small nuclear ribonucleic protein
snRNP small nuclear ribonucleoproteins
SOC super optimal broth with catabolic repressor
SPR sepiapterin reductase
ss splice site
TCA tricarboxylic acid
1. Introduction
1.1. Branched-chain amino acids metabolism
The branched-chain amino acids (BCAAs), leucine, isoleucine and valine, are neutral, aliphatic amino acids with a branched methyl group in the side chain.
BCAAs are essential, also called indispensable, amino acids that need to be obtained from the diet in sufficient amounts to promote normal growth and development. Usually they comprise about 15%-20% of the total protein intake from food (Layman, 2003). BCAAs play important roles in cellular function, especially leucine since it promotes protein synthesis, inhibits protein degradation and stimulates insulin release (Mordier et al., 2000; Proud, 2002; Lynch et al., 2002). The first step in the catabolism of leucine, isoleucine and valine (Figure 1) is a reversible transamination catalyzed by branched-chain aminotransferase isozymes (BCATs), including a mitochondrial form with ubiquitous distribution and a cytosolic BCAT present mainly in the nervous system, to form their respective branched-chain α-ketoacids (BCKAs): α-ketoisocaproate (KIC), α-keto-β-methylvalerate (KMV) and α-ketoisovalerate (KIV) (Harper et al., 1984). The cytosolic BCKAs are then transported across the mitochondrial membrane (Hutson and Hall, 1993). Once in the mitochondria, branched-chain α-ketoacid dehydrogenase (BCKD) complex catalyzes the oxidative decarboxylation of BCKAs, generating their respective branched-chain acyl-CoAs, that are further metabolized via separate pathways (Figure 1) (Harris et al., 1997).
The step catalyzed by BCKD commits the BCAAs to degradation, being so the rate-limiting step in the BCAA catabolism (Harris et al., 1990) (Chuang and Shih, 2001). The BCKD complex is therefore the most important regulatory enzyme in the catabolic pathway of the BCAAs (Harris
Figure 1. BCAA catabolic pathways. The first step is transamination of the BCAAs (leucine (Leu), isoleucine (Ile), valine (Val) to
produce the branched-chain α-keto acids (BCKAs): α-ketoisocaproate (KIC), α-keto-β-methylvalerate (KMV) and α-ketoisovalerate (KIV). α-ketoglutarate is the α-keto acid acceptor of the BCAA α-amino group and glutamate (Glu) is the product. The second catabolic step is oxidative decarboxylation, catalyzed by the branched chain α-keto acid dehydrogenase (BCKD) complex. Leucine is ketogenic, forming acetyl-CoA and acetoacetate, valine is glucogenic, entering the tricarboxylic acid (TCA) cycle as succinyl-CoA, whereas isoleucine is both ketogenic and glucogenic. Adapted by Hutson et al., 2005.
1.2. Branched-chain α-ketoacid dehydrogenase complex
The human branched-chain α-ketoacid dehydrogenase (BCKD) catalytic machine is a member of the highly conserved mitochondrial α-ketoacid dehydrogenase complexes comprising BCKD complex, pyruvate dehydrogenase complex (PDC) and α-ketoglutarate dehydrogenase complex (Reed et al., 1985).
The BCKD complex is composed by three catalytic components - a decarboxylase (E1) that has a heterotetrameric structure formed by two E1α and two E1β subunits (α2β2), a dihydrolipoyl transacylase (E2) and a dihydrolipoamide dehydrogenase (E3). The complex has also two regulatory enzymes, which are a specific kinase (BCKDK) and a specific phosphatase (PP2Cm) (Yeaman, 1989) (Figure 2).
Components E1, E2 and the regulatory enzymes are specific of BCKD, while E3 is shared by the three α-ketoacid dehydrogenase complexes and by the glycine cleavage complex (Yeaman, 1989; Danner and Doering 1998).
The complex is organized around a 24-meric cubic core of E2, to which 12 copies of E1, 6 copies of E3, and the kinase and the phosphatase are attached (Yeaman, 1989; Danner and Doering 1998).
BCKD complex requires several cofactors to function properly, including thiamine pyrophosphate (for the E1 component), coenzyme A (for the E2 component), lipoamide, flavin and nicotinamide adenine dinucleotides (FAD and NAD) for the E3 component.
Activity of the complex is controlled by covalent modification through phosphorylation of a serine residue (Ser-337 previously identified as Ser-292) of the E1α subunit performed by the specific kinase of the complex that causes inactivation of the E1 component and consequently of the complex; dephosphorylation by the specific phosphatase leads to the reactivation of BCKD (Damuni et al., 1984; Popov et al., 1992). The extent to which the complex is dephosphorylated and therefore catalytically active depends on the relative activities of PP2Cm and BCKDK (Harris
et al., 2001). At low BCAA levels, E1α is hyperphosphorylated by BCKD kinase, leading to lower
BCKD activity and reduced loss of BCAA. At elevated BCAA levels, E1α is dephosphorylated by BCKD phosphatase, to induce BCKD complex activity and the removal of excess of BCAA. Therefore, BCKD phosphorylation/dephosphorylation is critical to BCAA homeostasis (Sun et al., 2011).
All components of BCKD complex are encoded by nuclear genes. The human E1α gene (BCKDHA) (MIM #608348) is located at chromosome 19 (19q13.1-13.2) and has 9 exons leading to an mRNA that is translated into a protein with 445 residues (Fekete et al., 1989). The BCKDHB gene (MIM #24861), which encodes the E1β protein, is located at the chromosome 6 (6q14.1) (Zneimer et al., 1991), has 11 exons and originates a protein with 392 residues (Edelmann et al., 2001). The E2 protein is codified by the DBT gene (MIM #248610) that is located at the chromosome 1 (1p31). This gene is composed by 11 exons and originates a protein with 482 aa (Zneimer et al., 1991). DLD (MIM #238331) at chromosome 7 (7q31-32) encodes the E3 protein, and contains 14 exons forming a protein with 509 aa (Scherer et al., 1991).
Concerning the regulatory subunits of BCKD complex, the gene for the specific BCKD kinase (BCKDK) is located on chromosome 16 at 16p11.2 and has 13 exons encoding a protein of 412 residues (Suryawan et al., 1998). The gene for the BCKD specific phosphatase (PPM1K) is
located on chromosome 4 and consists of 7 exons that are translated into a protein with 372 residues (Damuni et al., 1984) (Lu et al., 2009).
Genetic defects leading to impairment of the BCKD complex are responsible for a condition known as Maple Syrup Urine Disease (MSUD) (Harris et al., 2004).
Figure 2. Representation of the branched chain α-ketoacid dehydrogenase (BCKD) complex. Adapted from (Ævarsson
et al., 2000).
1.3. Maple Syrup Urine Disease
Inherited metabolic diseases are caused by the deficiency or even absence of activity of a particular enzyme in a metabolic pathway. The blockage can lead to the accumulation of toxic substances in body fluids and tissues or lack of essential metabolites, many times leading to implications for the mental and/or physical development of affected individuals. The majority of these disorders is characterized by an autosomal recessive pattern of inheritance.
Among them is maple syrup urine disease (MSUD; OMIM 248600), an autosomal recessive disorder, first described in 1954 by Menkes and collaborators (Menkes et al., 1954) that is associated to dysfunction of branched-chain amino acids metabolism. The characteristic odor of the urine of the patients, resembling maple syrup, gave the name to the disease (Dancis et al., 1959). The metabolic block causing MSUD was then identified to occur in the decarboxylation of BCKAs, due to the deficient activity of BCKD complex (Dancis et al., 1960) (Menkes, 1959).
1.3.1. Clinical phenotypes
The classic form of MSUD is the most severe subtype with neonatal onset. Affected newborns have 0-2% of normal BCKD complex activity (Packman et al., 2012) and although
apparently healthy at birth the progressive accumulation of BCKAs and BCAAs conduct to the development of the symptoms in the first days of life. Patients present poor feeding and irritability that, if untreated, may progress to lethargy, coma and ultimately death. This subtype of MSUD has the highest morbidity and is the most common, accounting for about 75% of the patients (McLaughlin et al., 2013).
Patients with the intermediate form have consistently abnormal BCAAs profile and neurologic deterioration, but do not develop catastrophic illness in the initial days of life as observed in classic MSUD. BCKD complex activity is usually higher than in the previous form, lying between 3 to 30% of normal. Most patients are diagnosed between five months and seven years of age (Chuang and Shih, 2001).
Intermittent MSUD patients show normal early development, growth and intelligence but metabolic decompensation can occur as a result of any physiologic stress. In spite of that, when asymptomatic these individuals usually tolerate a regular diet and have normal levels of plasma BCAAs. Activity of the BCKD complex is reportedly 5 to 20% of normal, with the diagnosis usually being established between 5 months and 2 years of age. During acute crises, behavioral changes may progress to seizures and coma and at this time the biochemical profile is similar to that of classic MSUD (Chuang and Shih 2001).
The thiamine-responsive form was first described by Scriver and collaborators (1971) in patients in whom the hyperaminoacidemia was completely corrected by administration of thiamine hydrochloride. As occurs in the intermediate type there is no neonatal illness and BCKD complex activity is about 30 to 40% of the normal rate (Chuang et al., 1982). Patients with this phenotype are usually treated with combined therapy of dietary adjusted restriction and thiamine supplementation.
The E3-deficient type is associated with combined enzyme deficiencies in pyruvate dehydrogenase, α-ketoglutarate dehydrogenase and BCKD complexes because E3 is a common component among these mitochondrial α-ketoacid dehydrogenase complexes (Yeaman, 1989). Patients with this disease form present a severe phenotype distinct from MSUD that is characterized by lactic acidosis and progressive neurologic deterioration (Robinson et al., 1977).
In newborns or young children manifesting clinical symptoms suggestive of MSUD, diagnosis confirmation is performed through amino acid and organic acid analysis profile, by measuring the plasma BCAAs concentrations that are usually elevated five to ten-fold greater than normal and by detection of alloisoleucine that has been considered as a pathognomonic marker for the confirmation of the diagnosis (Snyderman et al., 1964; Strauss and Morton, 2003; Chuang et al., 2006). A general disturbance of amino acid concentration ratios is also observed (Chuang and Shih, 2001, Morton et al., 2002) and high levels of the BCKAs derived from the BCAAs can also be detected in the urine.
However, in the last decades the identification or suspicion of MSUD patients become possible even before the manifestation of the first symptoms since the disease has been included in the expanded newborn screening programs already implemented in many countries, including Portugal (Vilarinho et al., 2006). For the screening, it is used tandem mass spectrometry (MS/MS) whose results permits to identify newborn suspects who may develop MSUD in the first days of life, therefore allowing immediate therapeutic implementation. The inclusion of MSUD in the MS/MS newborn screening program represents a major improvement since early diagnosis and intervention during the pre-symptomatic or early symptomatic period improves the outcome of the patients and usually prevents irreversible brain damage (Schadewaldt et al., 1999; Simon et al., 2006).
In patients with positive results in the neonatal screening, the biochemical diagnosis (previously described) must be performed to confirm the diagnosis.
Whenever possible, the deficiency of the branched-chain α-ketoacid dehydrogenase enzyme complex activity may also be measured in cultured fibroblasts or lymphocytes as an additional method for diagnosis confirmation.
Molecular diagnostic allows the identification of causative mutations, which is crucial to provide prenatal diagnosis in high-risk pregnancies and carrier detection in family members to offer them genetic counseling.
1.3.3. Treatments
As for the majority of metabolic diseases, therapy for MSUD comprises long-term disease-specific approaches that consists mainly in dietary restriction of the amino acids that cannot be properly degraded, particularly of leucine, and replacement of deficient substrates, which in the
case of MSUD was firstly proposed by Snyderman (Snyderman et al., 1964). Besides, emergency treatments are usually implemented during metabolic decompensation crisis.
Since the intellectual outcome of patients is dependent on the time that leucine levels remain above the normal, to protect the neonatal brain of the acutely ill newborn from permanent damage an emergency treatment is used to reduce leucine concentration as rapidly as possible. This intervention consists mainly in exogenous toxin removal, because a high-energy enteral or parenteral nutrition alone is insufficiently effective to rapidly lower plasma leucine levels (Berry et
al., 1991). For metabolic removal in acute situations, peritoneal dialysis or venous hemofiltration
can be performed while high calorie fluids are provided intravenously to inhibit catabolism and promote anabolism.
Besides this emergency intervention, long term dietary therapy is also used in MSUD patients during all life to normalize the concentration of blood BCAAs and to provide adequate nutrition to promote normal growth and development, especially in young patients. This treatment consists fundamentally in a BCAA-restricted diet that should be adjusted to each patient individual requirements viewing which BCAAs levels must be regularly monitored. Thiamine supplementation should be used to test for thiamine-responsiveness of the patients. Several commercial synthetic formulas are already available for MSUD patients, which are enriched with the amino acids that compete with BCAA transport and help to maintain physiological amino acid plasma levels and transport into the brain (Strauss et al., 2010).
In asymptomatic individuals with mild variant forms of MSUD the necessity of long-term treatment is yet unclear, but interventions such as prevention of metabolic crisis, careful instructions of affected families and evaluation to identify individuals at risk for metabolic decompensation are recommended (Vockley et al., 2006; Simon et al., 2006).
Interestingly, liver transplantation has been suggested as an effective treatment for classic MSUD. This discovery was made from the observation of various patients with MSUD who required liver transplantation for liver failure and demonstrated a positive metabolic outcome (Strauss et al., 2006; Diaz et al., 2014). Since then, numerous liver transplants have been performed and the effectiveness of this procedure in MSUD suggests that providing 9-13% of the bodies’ BCKD complex activity is sufficient to restore BCKD complex homeostasis (Burrage et
al., 2014). However, liver transplantation has important risks, such as postoperative complications
and the need for long-term immunosuppression, which must be carefully evaluated and considered.
1.3.4. Incidence and mutational spectrum
MSUD is a rare disorder, affecting around 1/185.000 live births, thought it can attain very high incidence in populations or communities where endogamous practices are common (Chuang and Shih 2001). That is the case of some Old Order Mennonite communities, where a high incidence of classic MSUD is observed due to the alteration p.Tyr438Asn in E1α (Marshall and DiGeorge, 1981; Zhang et al., 1989) or the p.Arg183Pro in E1β, affecting the Ashkenazy Jewish (Edelmann et al., 2001). In Portugal, MSUD has been estimated to affect 1/86.800 live newborns, which represents an incidence slightly higher than reported in most populations, but that can be mainly explained by the presence of a founder mutation (c.117delC in BCKDHA) in a Gypsy community from the South of the country (Quental et al., 2008).
MSUD is mainly caused by recessively inherited mutations in any of the three genes that code for catalytic subunits specific of the BCKD complex namely BCKDHA (E1α), BCKDHB (E1β) and DBT (E2). Recently, however, a patient with a mild variant phenotype was reported to have a mutation in the BCKD specific phosphatase (PP2Cm, PPM1K gene) (Oyarzabal et al., 2013).
A comprehensive knowledge of the MSUD mutational spectrum has important implications for disease management and genetic counseling (Narayanan et al., 2013).
Up to now, more than 150 pathogenic alterations underlying MSUD have been identified, distributed in a near equal number in the three genes that encode the catalytic subunits (Quental, 2009).
According to the data available in the Human Gene Mutation Database (version 2013.4; http://www.hgmd.org/), the majority of the alterations that cause MSUD comprises single nucleotide substitutions (~74%), including the commonly referred “splicing mutations”, which are those that disrupt the normal splicing or alternative splicing of gene’ transcripts. In the last years, much attention has been given to the mechanisms by which disruption of pre-mRNA splicing play a role in human disease, being increasingly acknowledged that the understanding of the pathobiology of splicing expands opportunities for therapeutic intervention by either directly addressing the cause or by providing novel approaches to circumvent disease processes (Ward and Cooper, 2010).
Expression of eukaryotic structural genes is a multistep process that includes transcription of the gene, splicing and polyadenylation of the primary transcript, and transport of the fully processed mRNA to the cytoplasm (Singer and Green, 1997).
Most genes in higher eukaryotes are transcribed as precursor mRNAs (pre-mRNAs) that contain intervening sequences (introns) as well as expressed sequences (exons). The process of pre-mRNA splicing, discovered in the late 1970s, briefly consists in a series of reactions whereby the intronic RNA segments are removed and discarded while the remaining exonic segments are joined end-to-end, to give a shorter RNA product (Strachan T. and Read A. (2010) Human Molecular Genetics, 4th edition) .The precision and complexity of intron removal during pre-mRNA splicing still amazes even several years after its discovery.
The spliceosome is the macromolecular machine that performs the two primary functions of splicing: recognition of the intron/exon boundaries and catalysis of the cut-and-paste reactions that remove introns and join exons (Faustino and Cooper, 2003). It is a dynamic ribonucleoprotein complex composed by five small nuclear ribonucleoproteins (snRNPs) (U1, U2, U4, U5 and U6), each of which contains an RNA known as a snRNA and an elevated number of other non-snRNP proteins (Matera and Wang, 2014).
For an efficient splicing process, both cis-regulatory sequences and trans-acting factors are needed. The cis elements include highly conserved sequences such as donor and acceptor sites positioned at exon-intron boundaries, the branch point and the polypyrimidine tract, as well as auxiliary elements, that include exonic and intronic splicing enhancers (ESEs and ISEs, respectively) and silencers (ESS and ISSs, respectively) (Figure 3). Trans-acting elements may be divided into spliceosome and splicing factors which intervene through binding to splicing enhancers and silencers and include members of the well-characterized Ser/Arg-rich and heterogeneous nuclear ribonucleoprotein (hnRNP) protein families (Kornblihtt et al., 2013).
The specificity of the splicing reaction is established by RNA-RNA base pairing between the RNA transcript to be spliced and snRNA molecules within the spliceosome.
First, U1 binds to the 5’ splice site, while U2 binds the intron branch site via RNA:RNA interactions between the snRNA and the pre-mRNA. Interaction between the splice donor and splice acceptor sites is stabilized by the binding of a multi-snRNP particle that contains the U4, U5 and U6 snRNAs. The U5 snRNP binds simultaneously to both the splice donor and splice acceptor sites. Their cleavage releases the intronic sequence and allows both exons to be spliced
together (Figure 4) (Faustino and Cooper, 2003); (Strachan T. and Read A. (2010) Human Molecular Genetics, 4th edition).
Figure 4. A simplified view of the spliceosome and process of splicing. Splicing involves several RNA-protein complexes, called small
nuclear ribonucleoproteins (snRNPs), which together make up the spliceosome. U1 snRNP binds to the boundary between exon 1 and the intron by recognizing a specific sequence. U2 snRNP subsequently binds to the branch site (A) and then U4/U5/U6 triple snRNPs join in. After a dynamic rearrangement, U1 and U4 are destabilized, and the remaining snRNP complex is activated for the two steps that remove the intron and stitch together exons 1 and 2 (Gottlieb, 2003).
1.5. Alternative splicing
Through the process of alternative splicing (AS), different combinations of exons to use in the final mRNA transcript can be generated, creating different isoforms of a single gene (Douglas and Wood, 2011), and as so AS is considered one major source of protein diversity explaining the immense mammalian proteomic complexity. In fact, more than 90% of human genes undergo alternative splicing (Luco et al., 2011).
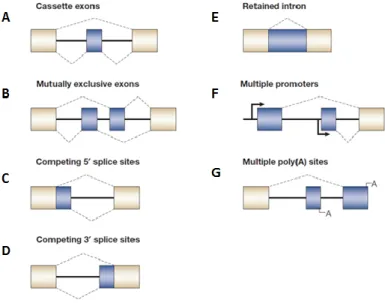
Almost all protein-coding genes contain introns that are removed in the nucleus by RNA splicing during pre-mRNA processing but, as mentioned, exon usage is often alternative because a part of pre-mRNA can be removed as an intron or included in the mature mRNA as an alternative exon (Ben-Dov et al., 2008). The relative positions of weak and strong splice sites give rise to the different modes of alternative splicing including: inclusion of alternative cassette exons that can be independently included or excluded from the mRNA (Figure 5.A); inclusion of alternative mutually exclusive cassette exons (Figure 5.B); use of alternative 5’ splice sites or alternative 3’ splice sites (Figure 5.C and 5.D); retention of alternative introns (Figure 5.E) and alternative splicing in conjunction with the use of alternative promoters (Figure 5.F) or poly(A) sites alternatives (Figure 5.G) (Matlin et al., 2005); (Kornblihtt et al., 2013).
Figure 5. Different modes of alternative splicing. Adapted from (Matlin et al., 2005).
1.6. Splicing and disease
Since splicing is a major regulatory step in gene expression, any alteration of the splicing pattern of one or multiple transcripts can disrupt the production or function(s) of the encoded protein(s) leading to a wide range of phenotypic consequences.
Actually, splicing mutations account for approximately 10% of roughly 80,000 mutations associated to inherited diseases contained in the human gene mutation database (2014). In 2003, Faustino and Cooper have classified this type of disease causing alterations into four
categories: cis-acting mutations, those that disrupt the use of constitutive splice sites; cis-acting mutations, when they disrupt the use of alternative splice sites; trans-acting mutations, if compromising the basal splicing machinery and trans-acting mutations, when disturbing splicing regulation.
Cis-acting mutations that affect the use of constitutive splice sites most of the times result
in loss of gene expression due to nonsense-mediated decay (NMD) or expression of proteins containing internal deletions, a shift in the reading frame, or C-terminal truncations. In fact, the most commonly detected splicing mutations are located at conserved donor (5’) and acceptor (3’) splice sites while mutations in the branch site or in the polypyrimidine tract are rare (Lewandowska, 2013). Furthermore, alteration in ESE, ESS, ISE, or ISS have also been recognized as a cause of genetic disease through splicing alteration (Baralle and Baralle, 2005). This type of mutations frequently result in exon skipping, use of nearby cryptic 5´or 3´splice site, or even in retention of the mutated intron. Alternative splice sites can also be mutated and, in this case, a mutation that inactivates one of the alternatively used splice sites will force expression of the alternative splicing patterns.
Trans-acting splicing mutations, in its turn, can affect the function of the basal splicing
machinery or factors that regulate alternative splicing. Mutations that affect the basal splicing machinery have the potential to affect splicing of all pre-mRNAs, whereas mutations that affect a regulator of alternative splicing will affect only the subset of pre-mRNAs that are targets of the regulator (Faustino and Cooper, 2003).
The more that is known about RNA splicing, the more is recognized its relevance in terms of health and disease. In figure 6, are illustrated examples of different splicing events and their consequences at protein level.
Figure 6. Examples of different splicing events and their consequences at protein level due to changes in pre-mRNA expression that
can cause disease. In the process of splicing can happen the removal of exons or retention of introns resulting in the formation of different mature mRNA transcripts for the same gene. Different mature mRNA transcripts encode for different proteins (Faiz and Burgess, 2012).
1.7. Use of minigenes to study splicing mutations
In recent years, the development of high throughput technologies allowed the detection of many changes in intronic sequences and intron/exon boundaries.
The assessment of whether a mutation affects exon recognition and results in a genetic disorder is, however, not always simple. Direct analysis of the processed transcripts from the patients is the most reliable method to confirm that a specific alteration affects splicing and should therefore be the method of choice to investigate the consequences of a splicing mutation. Unfortunately, in many cases it is not possible to perform such analysis as for example, when is not available, a sample from the patient, or from the appropriate tissue when the mutation affects tissue specific gene expression, suitable to extract RNA (Baralle et al., 2009). To overcome these circumstances, the establishment of a causal effect of a mutation can rely on the use of molecular biology methods such as in vitro transcription of the sequence of interest cloned into a plasmid, with and without alterations, or hybrid minigene systems to perform mutation analysis (Lewandowska, 2013).
Minigene constructs (Figure 7) have revealed to be an important tool for the identification and in vivo analysis of the cis-acting regulatory elements and trans-acting factors that establish splicing efficiency and that regulate alternative splicing. Expression of minigene pre-mRNAs by transient transfection provides a rapid assay to perform loss or gain of function analyses of factors that affect splicing regulation and therefore can be used to address a number of different questions with regard to alternative splicing and splicing mutations (Cooper, 2005).
When the aim is to study a putative splicing mutation, the minigene should contain a genomic segment from the gene of interest that includes the site of the alteration, usually the exon and part of the flanking introns. This fragment, which will be cloned into splicing vector, is amplified from genomic DNA (from normal and affected individuals) using oligonucleotides containing restriction enzyme sites at their 5’ ends that match restriction sites in the recipient plasmid, being most convenient to select two restriction enzymes that cut efficiently in the same buffer to obtain more efficient and reliable reaction (Gaildrat et al., 2010). Alternatively, the mutant minigene can also be constructed through site directed mutagenesis of the control/normal one.
Once constructed, the minigenes are transfected into the appropriate cultured cells where RNA undergoes splicing. The comparison of the splicing patterns, through RT-PCR using vector specific primers, of the transcripts generated from the wild-type and from the mutant minigenes, affords evidence on the functional effect of the alteration. The main strengths of the minigene approach are the abilities to demonstrate that specific nucleotide changes affect splicing efficiency and to define elements required for responsiveness to cell type and specific splicing regulators (Cooper, 2005) (Perez et al., 2013).
Many studies have already been undertaken in which minigenes were used to understand and assess the impact of splicing alterations. For example, in 2010 the strategy was applied by
Fernández-Guerra and collaborators to demonstrate the pathogenic impact of
an intronic mutation in BCKDHA gene causing a variant form of MSUD (Fernández-Guerra et al., 2010).
Figure 7. Representative scheme of the construction of a minigene in a plasmid vector. CMV – cytomegalovirus transcriptional
enhancer/promoter. RS #1 and RS#2 – restriction sites located on the plasmid. The genomic fragment to be cloned into the minigene is amplified from genomic DNA using oligonucleotides containing restriction enzyme sites at their 5’ ends that match restriction sites in the plasmid. These sites depend on the available cloning sites within the minigene (RS#1 and RS#2) (Cooper 2005).
2. Aims
While molecular characterization of MSUD patients is essential to provide carrier testing for at-risk relatives and pre-natal diagnosis for high-risk pregnancies, it might also be important for a proper disease management. On the other hand, understanding the pathobiology of mutations is fundamental to strengthen the relationship between molecular defect and disease. Acknowledging that, the main objectives of this work were:
1) To perform the molecular characterization of two patients recently diagnosed with MSUD by amplification and sequencing the entire coding and flanking intronic regions of
BCKDHA, BCKDHB and DBT genes;
2) To evaluate the putative pathogenic effect of newly identified missense mutation(s) through the use of available bioinformatics programs that predict the impact in the protein structure induced by amino acid replacements;
3) To assess in silico tools to predict the effect caused by a new variation identified in intron 1 of BCKDHA gene (c.108+6T>C) on the splicing process of the gene;
4) To determine the functional impact of the substitution c.108+6T>C in BCKDHA through the construction of a splicing reporter minigene assay;
5) In a broader perspective, it was also an objective of this work to enlarge the knowledge on the molecular architecture of MSUD and on the pathobiology of mutations that underlie the disease.
3. Material & Methods
3.1 - Molecular characterization of MSUD patients
3.1.1- Samples and DNA extraction
In this study, samples from two MSUD patients whose biochemical diagnosis has been recently established have been analyzed to identify the disease causal mutations. Moreover, a sample from a Brazilian patient, for whom the molecular characterization has already been performed, was also studied.
DNA was extracted from patients’ blood spot in FTA card using the Generation Capture Card Kit following the protocol "Purifying DNA from difficult-to-elute dried blood spots" provided by the manufacturer (Qiagen).
3.1.2- Amplification by PCR
In order to identify the MSUD causal mutations in the patients, the entire coding and flaking intronic regions of the three genes most frequently associated to MSUD (BCKDHA, BCKDHB and
DBT) were amplified by PCR using specific primers previously described in Quental et al., 2008
(Quental et al., 2008). The PCR reaction mixtures consisted in 5 µl of MyTaq™ HS Mix (Bioline); 1 µl of primer forward (10 mM); 1 µl of primer reverse (10 mM); 1 µl of DNA and 2 µl of H2O to complete a final volume of 10 µl. The amplification programs are described in table 1 whereas table 2 present sequences and annealing temperatures of primers used.
Table 1. PCR program used to amplify the entire coding and flaking intronic regions of the three genes that are most frequently
affected in MSUD (BCKDHA, BCKDHB and DBT)
*this information is present in table 2 and depends on the pair of primers used
Cycling step Temperature (°C) Time Number of cycles
Initial Denaturation 95 15 ' 1 Denaturation 94 30 '' 35 Annealing Variable* 1' 30'' Extension 72 1' Final Extension 72 10' 1 Hold 4 ∞ 1
BCKDHA 1 1F/1R CAGAACGGGAAGAAGATGGT / CTTCGGTGTCTTCTCCAAGG 59 2/3 116-374F/116-374R GCTTCTGATGCAGGTGGTCT / CCTCAGGTAATTCCAGCCCC 61 4 4F/4R CCCAGCATAACCAATTGTGG / GCTGCTCCTGGAAGAACACT 59 5 5F/5R TCCTCTTAAAACAAGCCTGAGC / TCACCAACCCAGAATTCCAC 61 6 6F/6R CTGCTCACCACCCTCTCATC / CACAGGACACAGGACGAGAA 60 7 7F/7R CACCCCTACCCTCCTTCCT / GTGGCTGTCAGTGCTGTGG 61 8 8F/8R TGCCTTTATTCCGTTTCCAC / ATCACTGGGGTTATCCCTGA 59 9 1234-1312F/1234-1312R CACAAAGGCTTGGAGTGGTT / CCCTTAGAGTGGGGCTACCT 59 BCKDHB
1 1BF/1BR CCCCTAAAT TTCCAGTTCCG / AATAAGCTGGGATGCAAGGA 55
2 2-3BF/2-3BR ACTTTGACGGGTCTCCCTTT / TGTTAACCATTGAGCTCCACA 60 3 4BF/4BR GGTAACTGTCATCCAGTGGGTAG / CTGCGGGTGGCGTTGGAAATG 61 4 6BF/6BR TGACATTACTCTCATTTGCCACA / GGGTAGCGGCAATACTTGAA 61 5 7BF/7BR AGGAGATTGGAAGGGAAGGA / TTCCAAGAATCCTGTTTGTTTTC* 60 6 9BF/9BR AGCCCTTCTTAGCAGCGAGT / CACCTGAGGACAAACTAAATACCA 61 7 10BF/10BR TGCACAAGTGTCACCTCAGA / TGAGAGCTTCCAAGCACAAC 61 8 11BF/11BR TCAGCATTCAACTAGTTTTTGAGG / GCCAAAGGTTTCAGGGAAAT 61 9 13BF/13BR TTTTCTACTGGGATTACAAACCA / GGAATTGCACAAGCATTGAA 61 10 14-1BF/14-1BR CACATAATAAAACTGGGATCATG/ CGTTAATGTCAGGGGCACAT 61 DBT 1 DBT-1F/R GCTCGTTTCTTCCCTCCCTA / CATGCATCCCTTCACCTCTC 5*64 + 30*62 2 DBT-2F/R GAGATAAGCCGGTATGGTTGTT / GCCCGGCTAGAAATACAGAG 5*64 + 30*62 3 DBT-3F/R ATTTCTGCCTCTGCCTGAGA / GGATTCCCACTATCCATTAA 59 4 DBT-4F/R TCTGAAAGTAAATGCTGGGCTA / GGGACCCAATGACAAAAAGA 58 5 DBT-6F/R CTGAAGTTAAGTTTTACCTTGTTAC / AATTTCATTGAGCTATTTCATC 52 6 DBT-7F/R GATACCTGATGGTTACCACATGCAT / TATGCTGACTGAAGTTGAACTTTC 53 7 DBT-8F/R GACATTAGAGAACCTTCCATT / CAAGAGCAAAACTCTGTCTC 58 8 DBT-9.1F/R GCGCTTTGAAATCCTCGTTA / TAATCCCAAGGAAGCAGCCT 62 8 DBT-9.2F/R CACATGGCCTGAAGGTAACAT / GGGTAACATAATCTGCCATACAGC 5*58 + 30*56 9/10 DBT-10/11F/R ATGGCAGTGAAGGTTGATCC / CCTACAAAAGGAGGGGAAACC 60 11 DBT-12F/R TTGAGCTCTGAACAAGTGAAGGTT / CAGCACCATATTAAGAAGTCACAC 63
3.1.3- Evaluation of the success of PCR by polyacrylamide gel electrophoresis
The success of the amplification reactions was tested by submitting the PCR products to polyacrylamide gel (T9C5) electrophoresis. The composition of the gel is described at the table 3. The voltage of 280V was applied during 30 minutes. The gel was visualized by silver staining standard protocol.
Table 3. Composition of a polyacrylamide gel
Component Volume
Acrylamide solution
(Acrylamide/Bisacrylamide 19:1 (40%))
3 ml
Ammonium Persulfate (APS) 2.5% 170 µl
Tetramethylethylenediamine (TEMED) 7 µl
3.1.4- Sanger Sequencing and electropherogram analysis
The amplified products were initially purified with ExoSAP-IT® (USA Products)to remove residues of primers and excess dNTPs not used in the PCR. For the purification reaction, 0.5 µl of the enzyme were mixed with 1.5 µl of amplified product and incubated at 37°C for 15 minutes and another 15 minutes at 85°C. Then, the sequencing reaction was prepared adding to each tube 2 µl of the purified PCR product, 1 µl of oligonucleotide primer 5’ or 3’ at 10 mM,1 µl of BigDye® Sequencing Standard Kit and 1 µl of sequencing buffer (Applied Biosystems). The sequencing reactions were carried out in a 2720 Thermal Cycler (Applied Biosystems) or in a Thermal Cycler (BioRad) with the conditions described in the table 4.
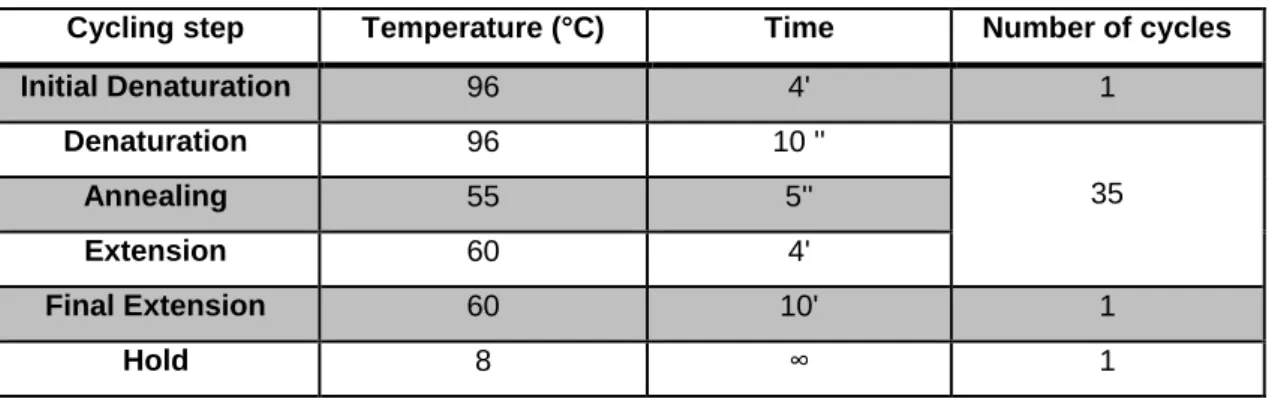
Table 4. Thermal cycler conditions for the sequencing reaction
Cycling step Temperature (°C) Time Number of cycles
Initial Denaturation 96 4' 1 Denaturation 96 10 '' 35 Annealing 55 5'' Extension 60 4' Final Extension 60 10' 1 Hold 8 ∞ 1
At the end of the reaction, the sequencing products were purified in SEPHADEX® columns (GE Healthcare) through centrifugation for 4 minutes at 4400 rpm to remove all the oligonucleotide primers, dNTPs and ddNTPs that have not been used in the reaction. Finally, the purified products were ressuspended in 12 µl of the denaturing agent Hi-Di formamide and the capillary electrophoresis was performed on an ABI Prism 3130xl DNA Sequencer (Perkin-Elmer, Applied Biosystems).
The electropherograms obtained were compared to reference sequences
available in the on-line database Ensembl Genome Browser -
http://www.ensembl.org/index.html, using Geneious 5.5.8 program.
3.1.5- Bioinformatic analysis
To predict the impact of novel missense alterations discarded to be polymorphisms the program PolyPhen-2 (http://genetics.bwh.harvard.edu/pph2/) was used.
In silico analysis of a likely splicing mutation was performed using the following
bioinformatics programs:
GenScan (http://genes.mit.edu/GENSCAN.html) (Burge and Karlin 1997) NNSplice: Splice Site Prediction by Neural Network (http://www.fruitfly.org/)
MaxEnt (http://genes.mit.edu/burgelab/maxent/Xmaxentscan_scoreseq.html) Human Splicing Finder (http://www.umd.be/HSF/)
NetGene2 (http://www.cbs.dtu.dk/services/NetGene2/).
3.1.6- Protein structural analysis
The E1β protein structural model with a newly identified mutation was built with MODELLER (Eswar et al., 2006), using the normal human sequence (PDB ID: 1X7Y) as template (Wynn et al., 2004).
Generation of protein plots was performed using PyMOL (http://www.pymol.org) (DeLano).
3.2- Functional characterization of the alteration c.108+6T>C within BCKDHA gene – Construction of reporter minigenes