Faculdade de Engenharia da Universidade do Porto
Disserta¸c˜
ao de Mestrado
Mestrado em Engenharia Biom´
edica
Contributions to the segmentation
of dermoscopic images
Pedro Miguel Martins Ferreira
Faculdade de Engenharia da Universidade do Porto
Disserta¸c˜
ao de Mestrado
Contributions to the segmentation
of dermoscopic images
Autor:
Pedro Miguel Martins Ferreira (MEB09015)
Orientadora:
Prof. Paula Rocha
Co-Orientadora:
Prof. Teresa Mendon¸ca
Tese submetida `
a Faculdade de Engenharia
da Universidade do Porto para obten¸c˜
ao do
grau de Mestre em Engenharia Biom´
edica
Acknowledgments
I would like to thank both my supervisors, Prof. Paula Rocha and Prof. Teresa Mendon¸ca, for their permanent support, guidance and availability. They were a great inspiration for me, giving me useful ideas and improving my knowledge during the development of this dissertation.
To Dr. Jorge Rozeira, Director of the Dermatology Service of the Hospital Pedro Hispano, many thanks for his precious help in providing the dermoscopic images and the manual segmen-tations used as ground truth to validate the results of this work.
A special thanks to my family, who always gave me the best conditions to study and to follow my dreams. It would not be possible to accomplish this work without their support, understanding, encouragement, and love.
Thanks to all my friends and classmates, for their friendship, and specially for every moment of entertainment and relaxation that they have shared with me.
Abstract
Melanoma is the most dangerous and deadly type of skin cancer. However, if it is diagnosed in an early stage there is a high probability of being cured. In this regard, several imaging techniques have been explored to improve the diagnosis accuracy of skin lesions. Dermoscopy is one of the most relevant of such diagnosis techniques, since it allows the in vivo observation and inspection of skin lesions, and hence a better visualization of their morphological structures.
Since the diagnosis accuracy of dermoscopy significantly depends on the experience of the dermatologists, and the visual interpretation and examination of this kind of images is time consuming, several computer-aided diagnosis systems have been introduced to assist the clinical diagnosis of dermatologists. Image segmentation is one of the most relevant tasks in these systems, since the accuracy of segmentation may determine their success or failure.
The availability and generation of manually segmented images performed by expert derma-tologists, to be used as ground truth, is an essential aspect in the evaluation and validation of automatic segmentation methods. Herein, a novel annotation tool for manual segmentation of dermoscopic images is proposed. This tool, called DerMAT, allows building up a ground truth database with the manual segmentations both of pigmented skin lesions and of other re-gions of interest. The developed tool was set up based on the requirements and suggestions of dermatologists, and has been used and tested in clinical environment. Compared with other existing annotation tools, DerMAT presents some advantages with respect to others, namely better freehand drawing and reshaping functionalities.
Furthermore, different kinds of algorithms for the automatic segmentation of the skin lesion in dermoscopic images are implemented and evaluated. Some performance metrics are computed for the quantitative assessment of the segmentation results, using as ground truth a database of images manually segmented by an expert dermatologist. Among the implemented segmentation approaches, the GVF snake method achieves the best segmentation performance.
Resumo
O melanoma ´e a forma de cancro cutˆaneo mais agressiva e letal. No entanto, quando ´e diagnos-ticado numa fase ainda precoce e n˜ao invasiva, tem grande probabilidade de cura. Neste sentido, diversas t´ecnicas de imagiologia tˆem sido exploradas para melhorar a precis˜ao no diagn´ostico de les˜oes cutˆaneas. A dermoscopia ´e uma das t´ecnicas de diagn´ostico mais importantes, uma vez que permite a observa¸c˜ao e inspe¸c˜ao in vivo de les˜oes cutˆaneas, e assim uma melhor visualiza¸c˜ao das suas estruturas morfol´ogicas.
Como a precis˜ao do diagn´ostico em dermoscopia depende significativamente da experiˆencia dos dermatologistas e a interpreta¸c˜ao deste tipo de imagens ´e uma tarefa demorada, v´arios sistemas de diagn´ostico assistido por computador tˆem sido introduzidos para auxiliarem os der-matologistas. A segmenta¸c˜ao de imagem ´e uma das tarefas mais importantes destes sistemas, uma vez que a precis˜ao da segmenta¸c˜ao determina o seu eventual sucesso ou insucesso.
A existˆencia e cria¸c˜ao de imagens segmentadas manualmente por dermatologistas, para serem utilizadas como referˆencia, ´e um aspecto essencial na avalia¸c˜ao e valida¸c˜ao dos m´etodos de segmenta¸c˜ao autom´atica. Deste modo, uma ferramenta de anota¸c˜ao para a segmenta¸c˜ao manual de imagens dermatosc´opicas ´e proposta neste trabalho. Esta ferramenta, denominada DerMAT, permite a constru¸c˜ao de uma base de imagens de referˆencia com as segmenta¸c˜oes manuais tanto das les˜oes cutˆaneas como de outras regi˜oes de interesse. A ferramenta desenvolvida foi criada com base nas sugest˜oes e requesitos dos dermatologistas, tendo vindo a ser utilizada e testada por eles em ambiente cl´ınico. Comparado com outras ferramentas de anota¸c˜ao existentes, o DerMAT apresenta algumas vantagens, nomeadamente melhores funcionalidades de segmenta¸c˜ao manual e edi¸c˜ao das segmenta¸c˜oes.
Al´em disso, foram implementados e avaliados diferentes tipos de algoritmos para a seg-menta¸c˜ao autom´atica da les˜ao cutˆanea em imagens dermatosc´opicas. Para a avalia¸c˜ao quantita-tiva dos resultados da segmenta¸c˜ao s˜ao determinadas algumas medidas de desempenho, usando como referˆencia uma base de imagens segmentadas manualmente por um dermatologista expe-riente. Entre os m´etodos de segmenta¸c˜ao implementados, o m´etodo “GVF snake” apresenta os melhores resultados.
Contents
Acknowledgments i
Abstract iii
Resumo v
List of Figures xiii
List of Tables xv
1 Introduction 1
1.1 Motivation . . . 1
1.2 Aims . . . 2
1.3 Contributions . . . 2
1.4 State of the art . . . 3
1.4.1 Annotation tools for manual segmentation and ground truth creation . . 3
1.4.2 Segmentation methods for dermoscopic images . . . 4
1.5 Outline of the dissertation . . . 7
2 Dermoscopy 9 2.1 Dermoscopy: the technique . . . 9
2.2 Differential diagnosis of pigmented skin lesions . . . 10
2.2.1 Pattern analysis . . . 11 2.2.2 ABCD Rule . . . 12 2.2.3 7-point checklist . . . 14 2.2.4 Menzies method . . . 15 3 DerMAT 17 3.1 DerMAT description . . . 17
3.1.1 Image upload and display . . . 18
3.1.2 Manual segmentation . . . 19
3.1.4 Boundary reshaping . . . 22
3.1.4.1 Pointwise boundary reshaping . . . 22
3.1.4.2 Local boundary reshaping . . . 23
3.1.5 A posteriori boundary edition . . . 24
3.1.6 Multi-user ground truth annotation and segmentation comparison . . . . 24
3.1.7 Storage of segmented images . . . 25
3.2 Functional evaluation of DerMAT . . . 26
4 Dermoscopic image segmentation 29 4.1 Pre-processing . . . 29
4.1.1 Conversion of the image from RGB to grayscale . . . 29
4.1.2 Image filtering . . . 31
4.1.2.1 Hair removal . . . 31
4.1.2.2 Image smoothing . . . 33
4.1.3 Detection of the dark regions in the four corners of the image . . . 34
4.2 Segmentation methods . . . 34 4.2.1 Automatic thresholding . . . 35 4.2.1.1 Otsu’s method . . . 36 4.2.1.2 Triangle method . . . 37 4.2.1.3 Implementation . . . 38 4.2.2 k -means . . . 40 4.2.2.1 Implementation . . . 40 4.2.3 Mean shift . . . 42 4.2.3.1 Implementation . . . 43 4.2.4 Region growing . . . 44 4.2.4.1 Implementation . . . 45 4.2.5 GVF snakes . . . 47 4.2.5.1 Implementation . . . 48 4.2.6 Watershed . . . 53 4.2.6.1 Implementation . . . 54 4.3 Post-processing . . . 55 4.4 Experimental results . . . 56
5 Conclusions and future work 63 5.1 Conclusions . . . 63
List of Figures
2.1 Manual dermatoscope . . . 9
2.2 Two-step procedure for the differential diagnosis of pigmented skin lesions . . . . 10
2.3 Examples of melanocytic lesions: (a-d) Benign melanocytic lesions; (e-h) Melanomas 11
2.4 Differential diagnosis using the ABCD rule: (a) Benign skin lesion with a TDS value of 2.8 → Asymmetry: 0 × 1.3=0; Border: 8 × 0.1=0.8; Color: 2 (light-brown, dark-brown) × 0.5=1; Differential structures: 2 (network, globules) × 0.5=1; and (b) Melanoma with a TDS value of 6.9 → Asymmetry: 2 × 1.3=2.6; Border: 3* × 0.1=0.3; Color: 4 (light-brown, dark-brown, blue-gray, black) × 0.5=2; Differential structures: 4 (network, homogeneous areas, streaks, globules) × 0.5=2 . . . 13
2.5 Differential diagnosis using the 7-point checklist: (a) Melanoma with a total score of 7; (b) Clark nevus with a total score of 1 . . . 14
2.6 Differential diagnosis using the Menzies method: (a) Example of a benign melanocytic nevus; (b) Example of a melanoma . . . 15
3.1 Initial aspect of the graphical user interface. Toolbar Buttons: 1-“Load Im-ages”; 2-“Save as”; 3-“Zoom in”; 4-“Zoom out”; 5-“Manual segmentation”; 6-“Pointwise boundary reshaping”; 7-“Local boundary reshaping”; 8-“Region label-ing”. . . 18
3.2 Dialog box that enables the user to browse and select the images to be segmented. 19
3.3 Manual segmentation: (Image on the left) Initial contour drawn by the user, with some undesirable extra lines (marked with circles); (Image on the right) Final contour after morphological filtering. Note that the final contour is smoother than the initial one and without undesirable extra lines. . . 19
3.4 Morphological filtering: (a) Initial contour drawn by the user; (b) Binary mask of initial contour; (c) Binary image after morphological filtering; and (d) Final contour obtained from image “c”. . . 20
3.5 Segmentation example of other regions of interest with the respective labels. . . . 21
3.6 “Region labeling” window, in which there are several default labels that the user can select. . . 21
3.7 Pointwise boundary reshaping: (Image on the left) Initial contour (solid line) and the reshaped contour (red line with control points); (Image on the right) Final
contour. . . 22
3.8 Local boundary reshaping: (a) Initial contour; (b) Initial contour and a new line to reshape the contour; (c)-(g) Intermediate steps; and (h) Final contour. . . 23
3.9 Image dataset selection. . . 24
3.10 Segmentation comparison. . . 25
4.1 Conversion of the image from the RGB color space to grayscale. . . 30
4.2 Hair detection: (a) Original grayscale image; (b) DoG filters response; (c) Binary hair mask; and (d) Hair mask superimposed on the original grayscale image. . . . 32
4.3 Hair disocclusion: (a) Original grayscale image; (b) Hair removal after image inpainting. . . 33
4.4 Corner mask creation: (a) Original grayscale image; (b) Binary mask of the dark regions in the four corners of the image. . . 34
4.5 Classification of image segmentation methods . . . 35
4.6 Optimal thresholding, kopt, achieved by Otsu’s algorithm . . . 37
4.7 Illustration of the triangle algorithm. The triangle algorithm selects the intensity threshold (T ) that maximizes the distance, D, between the line and the histogram 38 4.8 Examples of histograms of dermoscopic images: (a) Dermoscopic image; (b) His-togram of (a); (c) Another example of dermoscopic image; and (d) HisHis-togram of (c). . . 38
4.9 Algorithm for significant histogram peaks detection: (a) Original image histogram; (b) Histogram peaks detection (note that two local maxima/peaks are detected, and this histogram is smoother than (a) and without the outlier). . . 40
4.10 k -means clustering segmentation: (a) Original grayscale image; and (b) Result of k -means segmentation, for k = 3. . . 41
4.11 Mean shift clustering applied to obtain 3 clusters: (a) Original RGB image; (b) Result of mean shift clustering; and (c) Bad segmentation result. . . 43
4.12 Mean shift clustering applied to obtain at least 5 clusters: (First column) Original RGB images; (Second column) Result of mean shift clustering; (Third column) Final segmentation result after merging procedure. . . 44
4.13 Automatic seed finding procedure: (a) Original RGB image; (b) Vertical projec-tion Py; (c) Horizontal projecprojec-tion Px; and (d) Seed region (marked as a green rectangle) superimposed on the original image. . . 45
4.14 Segmentation examples obtained using region growing: (First column) Seed re-gions superimposed on the original images; (Second column) Final segmentation results. . . 46
4.15 GVF snake segmentation: (a) Initial snake contour; (b) Final segmentation seg-mentation result (green contour) after 70 iterations. . . 49
4.16 Automatic snake initialization method: (a) Original RGB image; (b) Edge map obtained through the Canny edge detector; (c) Edge map after removing some false positives edge segments; (d) Determination of the normalized mean intensity difference between the peripheral regions; (e) Initial snake points finding process; and (f) Initial snake curve. . . 51
4.17 GVF snake segmentation in difficult dermoscopic images: (a) Presence of hairs; (b) Fragmented skin lesion; and (c) Skin lesion with multiple colors. In these images the dotted red contour represents the initial snake curve, whereas the green contour corresponds to the final segmentation. . . 53
4.18 Flooding simulation of the watershed transform: (a) Input signal; (b) Punched holes; (c) Dam creation; and (d) Final flooding . . . 53
4.19 Watershed segmentation: (a) Original RGB image; (b) Magnitude of the image gradient; and (c) Watershed segmentation result - oversegmentation. . . 54
4.20 Merging procedure: (a) Watershed object histogram; (b) Watershed segmentation result after object merging. . . 55
4.21 Post-processing: (a) Initial segmented image; (b) Segmented image after holes filling, removing of the regions in the four corners, and elimination of the small isolated regions; and (c) Final segmentation result after boundary smoothing. . . 56
4.22 Three examples of successful segmentations. In these cases the segmentations results are close to the ground truth segmentation. . . 59
List of Tables
2.1 Definition of some dermoscopic structures that are used in the diagnosis of melanocytic
lesions . . . 12
2.2 ABCD rule of dermoscopy . . . 13
2.3 7-Point Checklist . . . 14
3.1 Functional evaluation of DerMAT. . . 27
4.1 Results of the segmentation methods. . . 57
Chapter 1
Introduction
1.1
Motivation
Skin cancer is one of the most frequent cancers among human beings. Malignant melanoma is the most aggressive and deadly type of skin cancer, and its incidence has been quickly increasing over the last years. In Portugal there are 10 000 new cases of skin cancer diagnosed each year, of which 1000 are malignant melanomas [1,2].
The success of melanoma treatment depends directly on early diagnosis because, when de-tected in an early and non-invasive stage, the malignant melanoma can easily be excised with an excellent prognosis for the patient [3, 4].
In order to improve the accuracy of melanoma diagnosis various imaging techniques have been explored, including photography, dermoscopy, spectral imaging, LASER Doppler perfusion imaging, magnetic resonance imaging, and infrared thermal imaging [4]. Among these, der-moscopy is currently the most relevant imaging technique for melanoma diagnosis. Derder-moscopy is a non-invasive diagnostic technique for the in vivo observation of pigmented skin lesions in a greater magnification, allowing a better visualization of their surface and subsurface structures. This is a very useful technique for the analysis of skin lesions and, when performed by experi-enced physicians, it has been shown to increase the diagnosis accuracy, specially of the melanoma [2,5,6].
Nevertheless, the visual interpretation and inspection of dermoscopic images is time consum-ing, subjective, and prone to bias even for trained dermatologists. Moreover, it was shown by Kittler et al. [7] that the diagnosis accuracy of dermoscopy significantly depends on the expe-rience of the dermatologists, and when performed by untrained or less expeexpe-rienced physicians, dermoscopy was no better than clinical inspection with the unaided eye [7,8].
Therefore, in the last few years, several computer-aided diagnosis systems of digital der-moscopic images have been introduced. An automatic derder-moscopic image analysis system has
usually three stages, namely: image segmentation, feature extraction and selection, and lesion classification. The segmentation step is one of the most important ones, since a good segmen-tation is fundamental for subsequent classification, and also because some clinical features, such as asymmetry and border irregularity, can be directly obtained from the boundary of the le-sion [9,10]. Thus, the further investigation of automatic segmentation methods for dermoscopic images is of crucial importance.
The evaluation and validation of automatic segmentation methods requires a reliable ground truth database of manually segmented images. To our knowledge there is no available standard ground truth database of dermoscopic images that can be used by all the research community. As the ground truth databases have to be created manually by expert dermatologists, which is a quite cumbersome task, there is also a need for the development of graphical user interfaces/annotation tools that can support the manual segmentation of dermoscopic images, and this way make this task easier and practicable for dermatologists.
1.2
Aims
The purpose of this dissertation is twofold.
The first aim is the development of an annotation tool that supports the manual segmentation of dermoscopic images. This tool should allow building up a ground truth database with the manual segmentations both of pigmented skin lesions and of other regions of interest.
The second aim is the implementation and evaluation of different kinds of algorithms for the automatic segmentation of the pigmented skin lesion in dermoscopic images.
1.3
Contributions
In this dissertation, our efforts were targeted towards the manual segmentation/ground truth creation issue as well as to the implementation of fully automated algorithms for the segmentation of dermoscopic images. In this regard, the main contributions of this work can be summarized as follows:
• A completely new annotation tool for manual segmentation of dermoscopic images is pre-sented. Besides the manual segmentation itself, this tool has other interesting functionali-ties, such as: boundary reshaping, region labeling, multi-user ground truth annotation and segmentation comparison;
• Several algorithms for the automatic segmentation of the pigmented skin lesion are ap-plied and evaluated, including automatic thresholding, region growing, watershed, k -means, mean-shift, and gradient vector flow (GVF). For some of these algorithms adaptations were
made in order to improve their performance and/or make the segmentation process com-pletely automatic;
• In the automatic thresholding, an algorithm for automatic detection of the number of sig-nificant histogram peaks is developed in order to classify the image histogram as unimodal or bimodal. Thus, according to each situation one of two distinct algorithms, either the triangle method or Otsu’s method, is used;
• An algorithm for automatic seed region creation in order to make the region growing method fully automatic is developed and implemented. For a given image, the seed region creation and definition is based on the horizontal and vertical projections of the image;
• In the gradient vector flow method, an approach for automatic initialization is proposed and applied. The initial contour is automatically defined for each image, mainly based on the information obtained from the canny edge detector.
Part of the work presented in this dissertation was published in the papers [11,12,13].
1.4
State of the art
1.4.1
Annotation tools for manual segmentation and ground truth
cre-ation
A reliable ground truth image database is necessary for the evaluation of the automatic segmen-tation algorithms performance. The creation and construction of a ground truth image database is of crucial importance, specially in the dermoscopy field, due to the non-existence of a public ground truth database of dermoscopic images. This task must be performed by expert derma-tologists who have to manually segment and annotate each dermoscopic image, which can be a quite cumbersome and time-consuming task. There are some available annotation tools or image processing software systems that can be used for manual ground truth annotation. However, there is no available customized tool for dermoscopy, and moreover most of the existing tools are not uniquely directed for the manual segmentation and annotation tasks, since they also include many other functionalities (automatic segmentation methods, image filters, image enhancement algorithms, etc). Therefore, we focused our research into the annotation tools or image software systems that support the manual segmentation, and hence can be used for ground truth creation (typically drawing the boundary of the desired objects in an image and labeling each segmented object). Some of such tools are: ImageJ [14], Labelme [15], and Annotor [16]. The main features and functionalities of these tools are described below.
ImageJ is a public domain image processing and analysis tool. Overall, ImageJ can be used to display, edit, process, analyze, save, and print images. It supports a wide number of standard image formats, including TIFF, GIF, JPEG, BMP, DICOM, FITS and “raw” images. More-over, this tool incorporates many image processing methods, such as histogram and contrast manipulation, edge detection, some standard image filters (mean, median, etc.), and a wide range of automated image segmentation algorithms. With ImageJ it is possible to create/draw user-defined regions of interest within an image in order to perform the manual segmentation. The selection of the region of interest can be performed using rectangular, elliptical, polygonal, and freehand drawing tools. The created region of interest can be filtered, filled in, and several measurements can be obtained directly from each segmented region (for instance area, circular-ity, etc.). The regions of interest can be resized and reshaped, but only when obtained using rectangular or elliptical drawing tools [14,17].
Labelme is a database and a web-based tool for image annotation and instant sharing of such annotations. The purpose of the Labelme project is to provide and build up a large image dataset with ground truth labels to be used by computer vision researchers. The online annotation tool allows users to draw the boundary of the objects in an image through a polygonal drawing tool. The segmentation is completed when the user closes the polygon along the object’s boundary. Once the polygon is closed, it is possible to define a label for the segmented object. Afterwards, the annotation is added to the database and becomes available for immediate download [18,19]. Annotor is a manual image annotation tool that can be used to create ground truth data (labeled images). Overall, this tool allows drawing polygons along the object boundaries in an image, and associating a class/label to each segmented polygon. Then, the annotations can be exported into different files (XML, PNG, and TXT) to be used as input for machine learning algorithms. The main output is a XML file, which contains a list of the segmented polygons defined by a color, a class, and the corresponding control points positions. Moreover, it is possible to generate cropped images (PNG images with transparent background) sorted by class, where each cropped image corresponds to a segmented polygon [16].
There are many other image processing and image analysis tools that could be used to manually segment and to trace a region of interest in an image, such as Endrov [20], Mango [21], and FreeSurfer [22]. However, as these tools are more directed towards the application of image processing algorithms, or to handle a specific type of medical imaging (for instance FreeSurfer is a brain imaging software), they are not considered or described in this work.
1.4.2
Segmentation methods for dermoscopic images
Dermoscopic images are a great challenge for segmentation algorithms, because there are a great diversity of lesion shapes, boundaries, and colors along with several skin types and textures.
In some images there is a low contrast and/or a smooth transition between the lesion and the surrounding skin. Moreover, dermoscopic images usually contain some intrinsic skin features such as hairs, black frames, skin lines, blood vessels, and air bubbles [9, 10]. Therefore, several segmentation algorithms have been suggested to overcome these difficulties. These segmentation algorithms can be roughly divided into four main groups, namely thresholding, region-based, edge/contour-based, and clustering-based methods.
A comprehensive survey of the methods applied to the segmentation of skin lesions in dermo-scopic images is provided in [10], in which the pre-processing, segmentation, and post-processing steps involved in each method are described. The authors also give a particular attention to the evaluation of the segmentation results according to the most widely used performance metrics.
A thresholding segmentation method is described in [23], where the segmented skin lesion is obtained by a fully automated histogram-based thresholding technique in which the thresholding is performed in each of the three color planes. Another example of thresholding is presented in [24]. In this paper, an automated threshold fusion method for the segmentation of the skin lesion is proposed, since a single thresholding algorithm is hardly robust enough to work well in a wide variety of dermoscopic images. This method involves the fusion of four popular thresholding algorithms, namely Huang’s algorithm [25], Kapur’s algorithm [26], Kittler’s algorithm [27], and Otsu’s algorithm [28]. The results demonstrate that the fusion method has a better performance when compared to each individual method. Most recently, Humayun et al. [29] propose a multilevel thresholding algorithm which iteratively divides the image histogram into multiple classes with an optimized selection of the threshold values using Otsu’s method.
Thresholding techniques have the advantages of being computationally simple and fast, and produce good results on images where there is good contrast between the lesion and the sur-rounding skin. However, in the dermoscopic images these methods generally produce inconsistent results, since in some images there is a low contrast and a smooth transition between the lesion and the skin, which leads the algorithm to fail [9,30].
Several region-based methods have been used in the segmentation of dermoscopic images. Celebi et al. [31] suggest a modified version of the JSEG algorithm for the skin lesion segmen-tation. In this algorithm the segmentation process is divided into two independent phases: (i) a color quantization, and (ii) a multiscale region growing segmentation. Moreover, Celebi et al. [32] propose a color image segmentation technique based on region growing and merging, called statistical region merging algorithm (SRM). In this paper, SRM is compared with four state of the art automatic segmentation methods (orientation-sensitive fuzzy c-means, dermatologist-like tumor extraction algorithm, mean shift clustering, and the modified JSEG method), and it is shown that this algorithm achieves the best segmentation results. Another region-based segmentation method can be found in [33], where the flooding variant of the watershed
algo-rithm is implemented for the segmentation of dermoscopic images. The watershed algoalgo-rithm uses an intensity-based topographical representation, in which the holes are punched at each regional minimum in the image, and then the topography is slowly flooded from the holes at each regional minimum to define different regions in the image [34].
Generally, region-based methods have difficulties when the pigmented skin lesions present a great variety of colors or textures along with different skin types and textures, which leads to oversegmentation [9,31].
An example of an edge-based method can be found in [35], where the skin lesion is segmented either by the geodesic active contours model or the geodesic edge tracing approach. The de-formable active contours or snakes are one of the most commonly used approaches to segment objects, particularly in medical images. This technique is based on deforming a curve towards the minimization of a given energy function [35]. In [36], the gradient vector flow (GVF) snakes method is used to find the border of skin lesions in dermoscopic images. Here, an automatic snake initialization method is introduced to make the skin lesion segmentation automatically. The GVF snake has some advantages over a traditional snake, such as its insensitivity to initial-ization and its ability to move into boundary concavities. In [37] the pigmented skin lesion is segmented using an improved snake model. The authors propose a new type of dynamic energy force for snakes which incorporates a mean shift field term within the standard GVF objective function. The experimental results show that their mean shift based GVF algorithm has a better segmentation performance than the classical GVF algorithm.
One of the main problems of the edge-based approaches applied to dermoscopic images is the existence of weak edges in some images, resulting from a smooth transition between the lesion and the skin. In these cases, the contour can pass over the weak edges. Another drawback of edge-based methods is the presence of noise points in the images, which can be derived from some image artifacts, such as hairs, air bubbles, and skin lines. The result can be the convergence of the contour to noise points and an incorrectly segmented skin lesion. Moreover, in these techniques a great number of parameters, which affect the contour’s behavior and performance, must be validated [9,36].
Clustering approaches are used in [38], [39], [40], [41] and [42] for the segmentation of der-moscopic images. Generally, these methods involve the partitioning of a feature space into homogeneous regions. In [38] the skin lesion is segmented using a modified version of the fuzzy c-means clustering technique that takes into account the cluster orientation. G´omez et al. [39] propose a contrast enhancement method based on independent histogram pursuit (IHP). The algorithm estimates a linear multispectral color space transformation that enhances the contrast between the lesion and the surrounding skin. Then, the skin lesion segmentation is performed using the k -means clustering technique. Melli et al. [40] compare the most spread color
clus-tering algorithms, namely median cut, k -means, fuzzy c-means and mean shift. According to the authors the best segmentation results are achieved by mean shift algorithm. The algorithm proposed in Zhou et al. [41] proceeds in a coarse-to-fine approach. First, the normalized cut algorithm is applied to a down-sampled version of the original image. Then, this segmentation result is adapted to the original image by using a histogram-based Bayesian classifier. Most recently, Devi et al. [42] suggest and compare several fuzzy based clustering techniques for skin lesion segmentation, including the fuzzy c-means algorithm, the possibilistic c-means algorithm, and the hierarchical c-means algorithm. According to their experimental results, the hierarchical c-means algorithm provides better performance when compared with the other two clustering algorithms.
The segmentation methods applied to dermoscopic images can also be divided into supervised and unsupervised methods. The supervised segmentation methods require user intervention, for instance in their initialization whereas unsupervised methods generally perform the segmentation without user interaction, or any kind of initialization. Moreover, unsupervised methods are preferred to ensure a reproducible result. However, user interaction is still required to correct an inadequate segmentation result [43].
Silveira et al. [9] propose and evaluate six different methods for dermoscopic image segmen-tation, including supervised and unsupervised segmentation methods, namely adaptive thresh-olding, gradient vector flow, adaptive snake, level set method of Chan et al. [44], expectation-maximization level set, and the fuzzy-based split-and-merge algorithm. They conclude that the best segmentation results are obtained by two supervised segmentation methods, more concretely by the adaptive snake and by the expectation-maximization level set methods. Fully automatic methods achieve slightly worse results.
It is important to note that the segmentation results in dermoscopic images are tightly cou-pled to the pre-processing step. Generally, the pre-processing step can include a color space transformation, contrast enhancement, and artifact removal. Celebi et al. [10] provide a useful review, in which the most widely used methods as pre-processing are presented. Recently, Abbas et al. [45] propose an effective pre-processing stage, where some image artifacts such as specu-lar reflection, dermoscopic gel, and intrinsic cutaneous features (hair, blood vessels, skin lines, and ruler markings) are removed by homomorphic filtering, weighted median filtering, and an exemplar-based inpainting scheme.
1.5
Outline of the dissertation
In Chapter 2 the dermoscopy technique is introduced. Furthermore, the most widely used di-agnosis algorithms for the evaluation of the pigmented skin lesions are presented, such as: the
pattern analysis, the ABCD rule, the 7-point checklist, and the Menzies method.
Chapter 3 presents the developed annotation tool, DerMAT, for manual segmentation and ground truth creation of dermoscopic images. Herein, the main functionalities of this tool are described in detail. Moreover, a functional evaluation of DerMAT is presented based on a comparison with other state of the art tools that can be also used for ground truth generation.
A detailed presentation of the implemented segmentation methods for the automatic detection of the pigmented skin lesions is given in Chapter4. Here, the pre-processing step that is applied to the images is first presented, followed by a description of the theoretical aspects as well as the implementation methodology of each segmentation method. Afterwards, three performance metrics are given for the quantitative assessment of the segmentation performance, using as ground truth a set of manually segmented images performed by an expert dermatologist.
Chapter 2
Dermoscopy
2.1
Dermoscopy: the technique
Dermoscopy, also known as dermatoscopy or skin surface microscopy, is a non-invasive diagnosis technique for the in vivo observation of pigmented skin lesions, providing a better visualization of their morphological structures, which would otherwise not be visible by the unaided eye [2].
This technique involves the use of an optical instrument with a magnification ranging from 6x to 40x and even up to 100x. One of the most widely used instruments is the dermatoscope (Figure 2.1), in which a spherical and achromatic lens is paired with a bright halogen beam that falls on the cutaneous surface, providing intra- and sub-epidermal illumination. Generally, around 4 − 7% of the light is reflected from the dry skin surface, limiting the visualization of deeper structures. In order to reduce the reflected light, an immersion fluid (oil, gel, water, etc) is placed at the interface between the epidermis and the dermatoscope, or as an alternative polarized light dermatoscopes are used. The optically magnified image of the skin surface and subsurface is then either visually inspected or captured by a computer for subsequent digital image analysis and examination at the computer screen [4, 5,46].
Figure 2.1: Manual dermatoscope (Adapted from [2]).
Digital dermoscopy uses digital or digitized dermoscopic images. It allows the storage, re-trieval, and follow-up of pigmented skin lesions. Moreover, some systems can support teleder-moscopy, and may offer the possibility of computer-aided diagnosis in order to assist the clinical
evaluation by dermatologists [8].
2.2
Differential diagnosis of pigmented skin lesions
The differential diagnosis of pigmented skin lesions can be a challenging task even for trained dermatologists. Thence, the Board of the Consensus Net Meeting on Dermoscopy (CNMD) agreed on a two-step procedure for the classification of pigmented skin lesions (Figure2.2) [4,47].
Figure 2.2: Two-step procedure for the differencial diagnosis of pigmented skin lesions (Adapted from [48]).
The purpose of the first step is to classify the lesion either as melanocytic or non-melanocytic. This decision is performed based on the presence of certain dermoscopic features, such as pigment network, globules, streaks, homogeneous blue pigmentation, and parallel pattern (Table 2.1). Overall, a pigmented skin lesion is considered as melanocytic when at least one of these criteria is present. Otherwise, the lesion should be one of the four main types of non-melanocytic lesions: seborrheic keratosis, basal cell carcinoma, vascular lesions, or dermatofibroma (this distinction is made based on another dermoscopic criteria) [48,49].
Once the skin lesion is classified as melanocytic, the second step is to evaluate whether it is benign, suspicious, or malignant. Melanocytic lesions appear as a dark spot on the skin, resulting from an aggregation of the skin color pigment, called melanin, that is produced by a special type of cells, the melanocytes. The common melanocytic lesions are benign in nature (harmless), and usually called moles or melanocytic nevi. On the other hand, melanoma is a malignant type of melanocytic lesions, originating from an uncontrolled proliferation of melanocytes, that has the potential to metastasize [2,4]. However, when melanoma is detected in a non-invasive, and early stage it can easily be treated and removed through a simple excision. Therefore, the early and correct diagnosis of melanocytic lesions is of crucial importance. In this regard, several diagnosis algorithms have been introduced in order to help differentiating between benign nevi and melanoma. The most widely used diagnosis algorithms are the pattern analysis, the ABCD
rule, the 7-point checklist, and the Menzies method. The ABCD rule and the 7-point checklist are semiquantitative models whereas Menzies method and pattern analysis are qualitative diagnosis models (these diagnosis methods are described in the following subsections) [2,48,49].
However, the diagnosis of melanocytic lesions is still a challenging task even using these diagnosis methods. Figure2.3 shows some examples of melanocytic lesions, containing benign melanocytic nevi as well as melanomas. It demonstrates that sometimes melanomas and benign melanocytic lesions appear very similar. This could lead to one of the major problems in the diagnosis of melanocytic lesions, which is the underdiagnosis of a melanoma as being a benign lesion [2].
(a) (b) (c) (d)
(e) (f) (g) (h)
Figure 2.3: Examples of melanocytic lesions: (a-d) Benign melanocytic lesions; (e-h) Melanomas (Adapted from [2]).
2.2.1
Pattern analysis
Pattern analysis is the classical approach for diagnosing the pigmented skin lesions. This di-agnosis procedure is based on a qualitative and simultaneous evaluation of several dermoscopic criteria. Therefore, the pigmented skin lesions are analyzed, in a first stage, with regard to their global pattern, and afterwards to their local pattern. Some of the most common global features that must be assessed are:
• Reticular pattern: these melanocytic lesions are composed almost entirely of a predom-inant pigment network.
• Globular pattern: characterized by the presence of numerous round to oval globules.
• Cobblestone pattern: it is a variant of globular pattern, which is characterized by the prevalence of closely, aggregated, large, angulated globules.
• Starburst pattern: characterized by the presence of radial streaks or globules regularly distributed around the periphery of the lesion.
• Parallel pattern: the parallel pattern is characterized by the presence of parallel pig-mented lines.
Besides the global patterns, several local features have to be analyzed, such as: streaks, dots/globules, blue-whitish veil, regression structures, blotches, hypopigmented areas, and vas-cular patterns. These local dermoscopic structures are described in Table 2.1. Generally, the dermoscopic structures and colors are symmetrically distributed in benign lesions, whereas in melanomas these features are asymmetrically distributed and/or have an atypical shape [48,49]. However, because of problems inherent to the reliability and reproducibility of the dermo-scopic criteria used in pattern analysis, other diagnosis algorithms have been introduced in order to increase the accuracy, such as the ABCD rule, the 7-point checklist, and the Menzies method [2].
Table 2.1: Definition of some dermoscopic structures that are used in the diagnosis of melanocytic lesions (Adapted from [2,50]).
Dermoscopic structure
Definition
Pigment network Grid-like network consisting of pigmented lines (brown or black) and hypopigmented holes.
Dots/Globules Spherical or oval, variously sized, black, brown or gray structures (dots are smaller than globules).
Streaks or Pseudopods Brown-black, finger-like projections of the pigment network from the periphery of the lesion.
Blue-whitish veil Confluent, opaque, irregular blue pigmentation with an overlying, white, ground-glass haze.
Regression structures White sclike depigmentation often combined with pepperlike ar-eas (speckled blue-gray granules).
Blotches Dark brown to black, usually homogeneous, areas of pigment ob-scuring underlying structures.
Hypopigmented areas Localized or diffuse areas of decreased pigmentation within an oth-erwise ordinary pigmented lesion.
Vascular patterns Vascular structures may include “comma vessels”, “point vessels”, “tree-like vessels”, “wreath-like vessels”, and “hairpin-like vessels”.
2.2.2
ABCD Rule
The ABCD rule of dermatoscopy was introduced after pattern analysis in an attempt to simply the diagnosis process. This algorithm consists in a semiquantitative analysis of four different criteria of a given melanocytic lesion, including asymmetry (A), border (B), color (C), and differential structures (D) (Table2.2). Each of these criteria is individually scored, based on how atypical they are identified in a lesion, and then multiplied by a given weight factor in order to
calculate the total dermatoscopy score (TDS) [2,50]:
T DS = [(Ascore× 1.3) + (Bscore× 0.1) + (Cscore× 0.5) + (Dscore× 0.5)] (2.1)
The TDS ranges from 1 to 8.9. A lesion with a TDS value less than 4.75 can be considered as a benign melanocytic lesion. A lesion with a TDS value between 4.75 and 5.45 should be considered suspicious, and should either be excised or followed. Finally, a TDS value greater than 5.45 indicates that the lesion is highly suspicious of being a melanoma [2, 5,50].
Table 2.2: ABCD rule of dermoscopy (Adapted from [2, 50]).
Criterion Description Score Weight factor
Asymmetry The lesion is divided by two orthogonal axes, and the asymmetry is assessed with regard to contour, colors, and structures (full symmetry - 0 points; asymmetry in one axis - 1 point; full asymmetry - 2 points).
0-2 1.3
Border The lesion is divided into eight parts. Each eighth with an abrupt ending of pigment pattern at the pe-riphery has a score of 1.
0-8 0.1
Color 1 point for the presence of each color (white, red, light-brown, dark-brown, blue-gray, black).
1-6 0.5
Differential structures
1 point for the presence of each structure (pigment network, structureless or homogeneous areas, streaks, dots, and globules).
1-5 0.5
In Figure2.4two examples of the application of the ABCD rule for diagnosing the melanocytic lesions are presented. The skin lesion in Figure2.4(a)has a TDS value of 2.8, corresponding to a benign melanocytic lesion. Figure2.4(b)contains a melanoma, which has a TDS value of 6.9.
(a) (b)
Figure 2.4: Differential diagnosis using the ABCD rule: (a) Benign skin lesion with a TDS value of 2.8 → Asymmetry: 0 × 1.3=0; Border: 8 × 0.1=0.8; Color: 2 (light-brown, dark-brown) × 0.5=1; Differential structures: 2 (network, globules) × 0.5=1; and (b) Melanoma with a TDS value of 6.9 → Asymmetry: 2 × 1.3=2.6; Border: 3* × 0.1=0.3; Color: 4 (light-brown, dark-brown, blue-gray, black) × 0.5=2; Differential structures: 4 (network, homogeneous areas, streaks, globules) × 0.5=2 (Adapted from [2]).
2.2.3
7-point checklist
The 7-point checklist is another semiquantitave approach that can be used for the diagnosis of melanocytic lesions. There are fewer dermoscopic features to analyze than in pattern analysis, and its scoring system is simpler than the one used in the ABCD rule of dermatoscopy.
In this algorithm, only seven dermoscopic features have to be assessed, which are divided into major and minor criteria (Table 2.3). Each major criterion identified in a given lesion receives 2 points, whereas each minor criterion receives only 1 point. Afterwards, the total score is computed by a simple addition of each individual score. If the total score is less than 3, the lesion is considered to be benign, but a lesion with a total score of 3 or greater has a high probability of being a melanoma [5,47,50].
Table 2.3: 7-Point Checklist (Adapted from [2]).
Criteria 7-Point score
Major criteria:
1. Atypical pigment network 2
2. Blue-whitish veil 2
3. Atypical vascular pattern 2
Minor criteria:
4. Irregular streaks 1
5. Irregular pigmentation 1
6. Irregular dots/globules 1
7. Regression structures 1
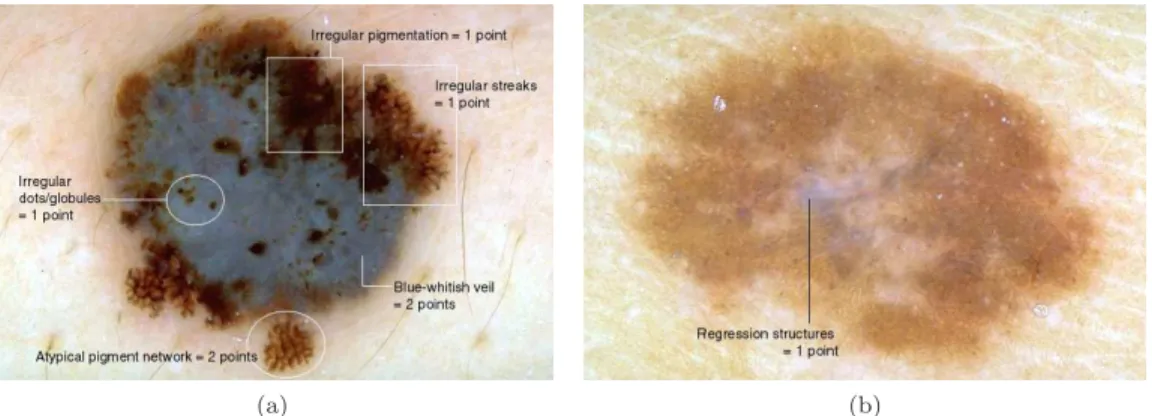
Figure2.5shows two examples of diagnosis using the 7-point point checklist. The pigmented skin lesion in Figure2.5(a)corresponds to a melanoma, in which five dermoscopic characteristics can be identified, corresponding to a total score of 7. Figure2.5(b)contains a Clark nevus, where only one dermoscopic characteristic is identified which corresponds to a score of 1.
(a) (b)
Figure 2.5: Differential diagnosis using the 7-point checklist: (a) Melanoma with a total score of 7; (b) Clark nevus with a total score of 1 (Adapted from [2]).
2.2.4
Menzies method
Menzies method is a qualitative diagnosis model like pattern analysis, and it is another attempt to simplify the assessment and analysis of the features present in dermoscopic images. According to this method, eleven dermoscopic features have to be assessed, which are divided in two main groups: negative and positive features. All of these dermoscopic features are scored as categori-cally present or absent, in order to reduce the observer errors that occur when criteria are graded [5,50].
The negative features are the symmetry of pattern and the presence of a single color. Both of these criteria define a melanocytic lesion as benign. The symmetry of pattern can be defined as the symmetry of colors and/or structures observed in a lesion across all axes through the center of the lesion (it does not require symmetry of shape). The set of colors that are scored includes the black, gray, blue, red, dark brown, and tan. On the other hand, there are nine positive features, including the blue-whitish veil, multiple brown dots, pseudopods, radial streaming, scar-like depigmentation, peripheral black dots/globules, multiple colors (5-6), multiple blue/gray dots, and broad pigment network.
Therefore, a melanocytic lesion in which at least one of the nine positive features is present, added to the absence of both negative features is classified as a melanoma [2,5].
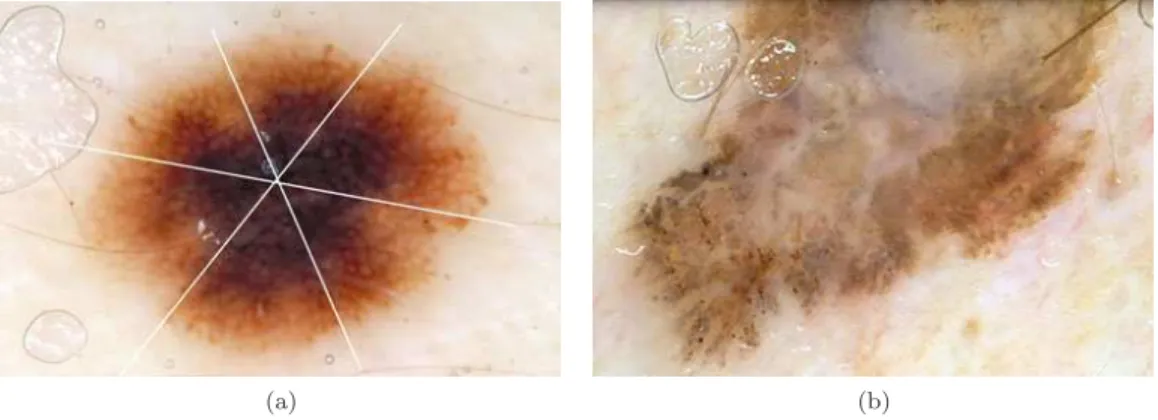
Figure 2.6illustrates two examples of the application of the Menzies method for diagnosing the melanocytic lesions. The skin lesion in Figure2.6(a) is classified as a benign lesion, since it demonstrates symmetry of pattern across all axes drawn through the center of the lesion. Figure
2.6(b)contains a melanoma, since this lesion lacks symmetry of pattern, presents more than one color, and has two positive features (white scar-like areas and peripheral brown dots).
(a) (b)
Figure 2.6: Differential diagnosis using the Menzies method: (a) Example of a benign melanocytic nevus; (b) Example of a melanoma (Adapted from [2]).
Chapter 3
DerMAT
The generation and collection of manually segmented images performed by expert dermatologists, to be used as ground truth, is an essential issue in the evaluation and validation of automatic segmentation methods.
In this chapter an annotation tool for manual segmentation of dermoscopic images, called DerMAT (Dermoscopic images Manual Annotation Tool), is presented. DerMAT allows build-ing up a ground truth database with the manual segmentations both of pigmented skin lesions and of other regions of interest to be used in the assessment and validation of automatic segmen-tation and classification methods. This is a customized tool for dermoscopy, but it can easily be adapted to other medical imaging applications.
Therefore, in this chapter the main functionalities and features of DerMAT are first presented, followed by a functional comparison between DerMAT and other existing annotation tools.
3.1
DerMAT description
Overall, the developed tool allows drawing the boundary of the desired regions in an image, labeling each segmented region, and storing the result of segmentation. For this purpose, the user has a set of tools to be used sequentially to achieve the desired result. The main functionalities of DerMAT are as following:
(i) Image upload and display;
(ii) Manual segmentation (of the lesion or other regions of interest); (iii) Region labeling;
(iv) Boundary reshaping;
(v) A posteriori boundary edition;
(vi) Multi-user ground truth annotation and segmentation comparison; (vii) Storage of segmented images.
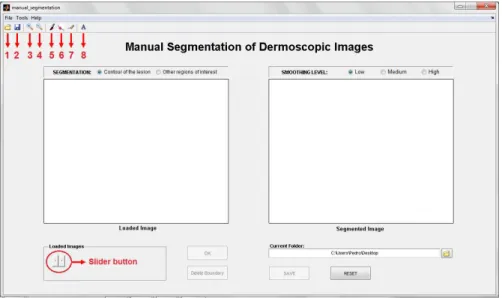
Figure 3.1: Initial aspect of the graphical user interface. Toolbar Buttons: 1-“Load Images”; 2-“Save as”; 3-“Zoom in”; 4-“Zoom out”; 5-“Manual segmentation”; 6-“Pointwise boundary reshaping”; 7-“Local boundary reshaping”; 8-“Region labeling”.
The graphical user interface (GUI) of DerMAT was set up based on the requirements and suggestions of dermatologists and was implemented in a MATLAB environment (7.9.0 R2009b) taking into account its image processing toolbox and graphical facilities. Figure 3.1 shows the initial aspect of the GUI.
The developed tool has already been used by dermatologists at the Hospital Pedro Hispano for ground truth creation. More concretely, it was used in the scope of a task1within the project ADDI [51] for the manual segmentation of the color classes present in a set of 28 dermoscopic images. Furthermore, DerMAT has been used by non-clinical members of the project to perform the manual segmentation of the skin lesion in a dataset of 400 images, that are currently being validated by the expert dermatologists using this tool.
3.1.1
Image upload and display
With this application it is possible to load one image or several images at once. For this purpose, it is necessary to select the option “Load images” in the “File” menu, or simply press the button 1 on the toolbar (Figure3.1).
Then a dialog box appears that enables the user to browse and select the image to be seg-mented. To load multiple images, simply press CTRL key and select the desired images (Figure
3.2). The loaded image is displayed on the left side of the interface. If several images have been loaded, the user can easily change the image that is being displayed through the slider button (Figure3.1).
1C. S. P. Silva, A. R. S. Marcal, M. Pereira, T. Mendon¸ca, and J. Rozeira, “Separability analysis of color
Figure 3.2: Dialog box that enables the user to browse and select the images to be segmented.
3.1.2
Manual segmentation
In order to perform the manual segmentation, this application allows to draw either single or multiple freehand regions of interest on the loaded image (using a pen tablet or a mouse). The user can choose between performing the manual segmentation of the lesion or other regions of interest through the radio buttons on the panel “Segmentation”.
To achieve the manual segmentation it is necessary to select in the “Tools” menu the option “Manual Segmentation”, or simply press the button 5 on the toolbar (Figure3.1). Afterwards, the user must click and drag the pen tablet to draw the contour of the desired region.
When the user confirms the segmentation, the image with the final contour is displayed on the right side of the interface (Figure3.3).
Figure 3.3: Manual segmentation: (Image on the left) Initial contour drawn by the user, with some undesirable extra lines (marked with circles); (Image on the right) Final contour after morphological filtering. Note that the final contour is smoother than the initial one and without undesirable extra lines.
It is important to note that the user can only confirm and complete the segmentation when a closed contour is drawn. When the user lifts the pen from the tablet before closing the contour,
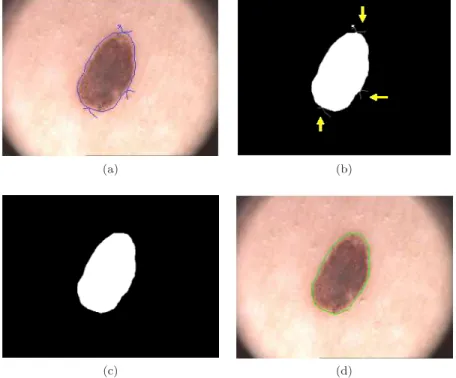
(a) (b)
(c) (d)
Figure 3.4: Morphological filtering: (a) Initial contour drawn by the user; (b) Binary mask of initial contour; (c) Binary image after morphological filtering; and (d) Final contour obtained from image “c”.
the contour remains open. However, while the contour is open there is the possibility of resuming drawing until the user completes and closes the contour.
To our knowledge other available manual segmentation tools, such as ImageJ, do not have this possibility, since when the drawing is interrupted the contour is automatically closed with a straight line between the beginning and the end point. A functional comparison between DerMAT and other three state of the art softwares is presented in subsection3.2.
To obtain the final contour from the initial one (drawn by user), a binary mask of the initial contour is first created, in which pixels with intensity value of 1 correspond to the segmented object, while pixels with value 0 correspond to the background. Then a morphological filtering is applied to this binary mask in order to smooth and remove extra lines that not belong to the contour. These lines may arise when the contour is drawn by means of multiple segments, specially at the points of intersection of these segments (Figures3.3and3.4).
Basically, morphological filtering is divided into three stages (i) morphological erosion, (ii) selection of the biggest binary object from the image, and (iii) morphological dilation. The user has also the possibility to select the degree of smoothing of the morphological filter between low, medium and high. In each of these morphological operations a flat disk-shaped structuring element is used, with a specific radius for each smoothing level (low: radius 1; medium: radius 3; high: radius 7).
The manual segmentation of other regions of interest can be done in a very similar procedure to the manual segmentation of the lesion. For this purpose, the user must select the “Other
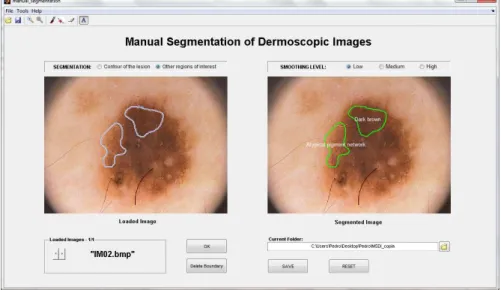
Figure 3.5: Segmentation example of other regions of interest with the respective labels.
regions of interest” radio button in the panel “Segmentation”, and perform the segmentation of the desired regions in the same way as for the whole lesion. The contours of all segmented regions are shown simultaneously in the right window (Figure3.5).
3.1.3
Region labeling
Another available functionality of this annotation tool is “Region labeling”, which allows labeling the segmented regions. The user must select the option “Region labeling” in the “Tools” menu, or simply press the button 8 on the toolbar (Figure3.1).
Figure 3.6: “Region labeling” window, in which there are several default labels that the user can select.
it. This produces another window where a number of default labels are available for selection. These labels include the main dermoscopic features and also the six typical colors that can be present in a dermoscopic lesion (Figure 3.6). The possibility of making a different annotation is also available. After selecting the desired label for each segmented region, the corresponding text annotation is placed inside the respective region (Figure3.5).
3.1.4
Boundary reshaping
Even after finishing the manual segmentation it is possible to make some adjustments in the contour, if necessary. Two distinct methods were implemented to reshape the contour previously done, namely “Pointwise boundary reshaping” and “Local boundary reshaping”.
3.1.4.1 Pointwise boundary reshaping
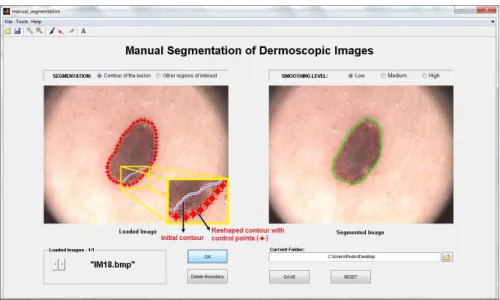
This method should be used to make small adjustments in the contour, because the reshaping is done point-by-point. For this, the user must select the option “Pointwise Boundary Reshaping” in the “Tools” menu, or simply press the button 6 on the toolbar (Figure 3.1). Forthwith the boundary turns red with some control points. From these points it is possible to change the shape of the contour. To accomplish this purpose, the user must click and drag the control points to their new positions (Figure3.7).
Figure 3.7: Pointwise boundary reshaping: (Image on the left) Initial contour (solid line) and the reshaped contour (red line with control points); (Image on the right) Final contour.
The interactive behaviors supported by this tool are described below:
• Boundary reshaping: Move the pointer over a control point. The pointer changes to a circle. Then, click and drag the control point to its new position.
• Adding a new control point: Move the pointer over the boundary and press the A key. Click the left mouse button to create a new control point at that position on the boundary.
• Deleting a control point: Move the pointer over a control point. The pointer changes to a circle. Then, click the right mouse button and select the option “Delete Vertex” from the context menu.
3.1.4.2 Local boundary reshaping
This method should be used when it is necessary to make great adjustments in the initial contour. For this purpose, the user must select the option “Local Boundary Reshaping” in the “Tools” menu, or simply press the button 7 on the toolbar (Figure3.1).
Basically, this method allows the user to draw a line to define the new shape of the contour. The line must intersect the initial contour at least in two points to form a closed contour. This can be used to increase or reduce the size of the initial contour. Note that it is possible to increase and reduce the size of the contour with a single line (Figure3.8).
(a) (b) (c) (d)
(e) (f) (g) (h)
Figure 3.8: Local boundary reshaping: (a) Initial contour; (b) Initial contour and a new line to reshape the contour; (c)-(g) Intermediate steps; and (h) Final contour.
The final contour (Figure 3.8(h)) is obtained through a set of logical, arithmetical, and morphological operations:
(i) First, a binary image from the initial contour and another binary image from the new line are created (Figures3.8(c) and3.8(d)respectively);
(ii) Image subtraction between image(c)and(d)(Figure3.8(e));
(iii) Selection of the biggest binary object from the image, and application of a logical OR operator between image(e) and(d)(Figure3.8(f));
(iv) Application of a morphological filling in order to fill the image holes, and then a morpho-logical open is used to remove the extra lines (Figure3.8(g)).
3.1.5
A posteriori
boundary edition
This functionality was implemented to be used as a way of speeding-up the ground truth creation task. It allows the visualization and the edition of a previously existing segmentation. In this way, segmentation may be performed in a first stage by less experienced (or even non medical) staff and then corrected by specialists. This can be used for medical training as well as for reducing the workload of the experts when building a ground truth database of large dimension. Therefore, before starting the manual segmentation, the tool automatically searches in the current ground truth dataset if there exists a previously stored segmentation. In this case, the user can choose to visualize the previously existing contour and edit the border making use of the two existing boundary reshaping functionalities (“Pointwise boundary reshaping” and “Local boundary reshaping”). Otherwise, the user can discard the previous contour and perform a completely new manual segmentation.
3.1.6
Multi-user ground truth annotation and segmentation
compari-son
The manual segmentation of dermoscopic images is quite subjective and therefore it is desirable to collect segmentations performed by more than one dermatologist in order to create a reliable ground truth dataset [52]. In this regard, each user can set up and build his own manually segmented images dataset. Therefore, with this tool it is possible to collect annotations and segmentations of the same image by different users.
During the initialization of the tool the user can select an existing ground truth dataset (previously created by another user) or create his own new ground truth dataset (Figure3.9).
As each user is associated to one ground truth dataset, this tool is capable of making the comparison between segmentations of different users for the same image. To accomplish this purpose visual and quantitative comparisons are both presented. When this functionality is used for a given image another window is opened containing a list box with all datasets that have a segmentation of the current image for user selection. The user can compare his segmentation with the segmentations of one or more datasets (Figure3.10).
For visual comparison the tool shows two or more segmentations superimposed on the same image. In addition, when only two segmentations are considered for comparison three per-formance metrics are given for the quantitative assessment of the segmentation discrepancies, namely the Hammoude distance, the false negative rate, and the false positive rate. These performance metrics are described in more detail in section4.4.
Figure 3.10: Segmentation comparison.
3.1.7
Storage of segmented images
Finally, this tool also allows storing the result of each manual segmentation. The ground truth dataset is created and organized automatically as the manual segmentations are stored. For each segmented image, a main folder with the same name of the image is created. In addition, two dedicated folders are created inside the main folder, one of them is for the storage of the manual segmentation of the lesion, and the other is for the storage of the manual segmentations of other regions of interest.
The segmentation result is saved as a binary image, where pixels with intensity value of 1 correspond to the segmented object, while pixels with value 0 correspond to the background. If different regions of interest were segmented, an individually binary image is created for each segmented region. Besides the binary image, a print of the original image with the contours of
all segmented regions and the respective labels is stored. This image is created and stored since it provides a suitable global information of the manual segmentation.
3.2
Functional evaluation of DerMAT
In this subsection a functional evaluation of DerMAT is presented based on a comparison with other available software systems that can be also used for manual image segmentation and ground truth generation, namely ImageJ, Labelme, and Annotor. The functional analysis and comparison was made using four different criteria. These criteria were defined based on the fundamental functionalities that an annotation tool for ground truth creation of dermoscopic images must support, including:
1. Manual segmentation/drawing mode: the manual segmentation of dermoscopic im-ages has to be performed by a freehand drawing tool. The segmentation using polygonal selections is not precise enough in case of dermoscopic images, since skin lesions usually have complex shapes with quite irregular boundaries.
2. Multiple ROI segmentation and labeling: the annotation tool should support the segmentation and labeling of multiple ROIs in a given image, since besides the manual segmentation of the skin lesion it is also necessary to collect the manual segmentations of other regions of interest.
3. Boundary reshaping: after finishing the manual segmentation of a ROI it is sometimes necessary make some corrections in its boundary. Therefore, the annotation tool should allow reshaping the boundary of a segmented region without the necessity of redrawing it once again from the beginning.
4. Output data generation: the annotation tool should generate output data (with the boundary location and label of each segmented region) that can be easily used as an input in computer vision algorithms.
Table 3.1 summarizes the functional analysis of DerMAT according to the four different criteria. DerMAT and ImageJ are the only tools that comply with the first criterion (manual segmentation/drawing mode), since the other two applications only allow performing the manual segmentation through a polygonal selection tool. Although both DerMAT and ImageJ support a freehand manual segmentation, the freehand drawing tool supported by DerMAT has some advantages compared with that supported by ImageJ. When the user interrupts the contour drawing using DerMAT, the contour remains open, but there is the possibility of resuming drawing until the user completes and closes the contour. In ImageJ when drawing is interrupted,
Table 3.1: Functional evaluation of DerMAT.
Criterion # DerMAT ImageJ Labelme Annotor
1 Freehand Freehand and
polygonal Polygonal Polygonal
2 Yes Yes Yes Yes
3 Point-by-point and local reshaping Point-by-point reshapinga Point-by-point reshaping Point-by-point reshaping 4 Binary mask “.roi” file format
and binary mask XML file format XML file format
aThe point-by-point reshaping mode available in ImageJ only works for polygonal segmentations. the contour is automatically closed with a straight line between the beginning and the end point, and hence, if this line is not accurate enough, it is necessary to redraw the contour from the beginning. This issue is very important specially when the manual segmentation is performed using a pen tablet, since dermatologists often lift the pen from the tablet during the contour drawing (either to evaluate the correctness of the current segmentation status or simply to rest their hands).
The four tools under analysis allow segmenting and labeling multiple ROIs in an image, and hence all of them satisfy the second criterion.
The developed tool has better boundary reshaping functionalities than the other three tools under analysis. First of all, only DerMAT allows reshaping a contour performed by a freehand segmentation. Using the other three applications only polygonal segmentations can be reshaped. In addition, DerMAT has two different methods for boundary reshaping, namely pointwise and local boundary reshaping (see subsection3.1.4), whereas the other tools only support the point-by-point boundary edition. The local boundary reshaping available in DerMAT can be very useful, since it provides a faster way to make great adjustments in the initial contour than the point-by-point reshaping method.
All the tools under evaluation are capable to save the manual segmentations and generate output data to be used as input in computer vision algorithms. By using our developed tool, DerMAT, each segmented region is stored as a binary image and associated to the respective label. This binary mask can be easily used to extract the boundary coordinates of every segmented region. Labelme and Annotor can produce a XML file containing information about the boundary positions and labels of each segmented object. In case of ImageJ, the segmented ROIs are stored as an “.roi” file. There is also the possibility to create and save a binary mask of each segmented region.
Besides these four fundamental criteria, DerMAT can offer other interesting functionalities such as: a posteriori boundary edition, and multi-user ground truth annotation and segmentation comparison (both described in subsections3.1.5and3.1.6, respectively).
Summarizing, taking the four criteria into account DerMAT has some advantages with respect to other three existing annotation tools, namely better freehand drawing and boundary reshaping functionalities.
Chapter 4
Dermoscopic image segmentation
Image segmentation is one of the most important tasks in image processing, since its accuracy determines the eventual success or failure of computerized analysis procedures. The main pur-pose of the segmentation process is the partition of a given image into disjoint regions that are homogeneous with respect to one or more characteristics or features [53,54].
In this work, segmentation is used in order to automatically extract the pigmented skin lesion from the surrounding skin in dermoscopic images. Before segmentation itself, a pre-processing procedure is applied to dermoscopic images with the principal aim of artifact removal and image smoothing.
In this chapter the pre-processing steps used in this work are first presented, followed by the description of all segmentation methods that were implemented. Then some experimental results are obtained in order to evaluate the performance of the segmentation methods.
4.1
Pre-processing
The pre-processing procedure used in this work can be divided into three main steps: (i) conver-sion of the image from the RGB (red-green-blue) color space to grayscale; (ii) image filtering; and (iii) detection of the dark regions in the four corners of the image. These three pre-processing steps are described in detail in the next subsections.
4.1.1
Conversion of the image from RGB to grayscale
The dermoscopic images used in this work are 8-bit RGB color images. Due to the computa-tional simplicity of single channel (scalar) processing, the first step of the pre-processing is the conversion of the image from the RGB color space into a grayscale image. Therefore, three of the most common methods for grayscale conversion of dermoscopic images were considered and tested [9,10], namely:
![Figure 2.2: Two-step procedure for the differencial diagnosis of pigmented skin lesions (Adapted from [48]).](https://thumb-eu.123doks.com/thumbv2/123dok_br/15471639.1034497/30.918.148.752.243.497/figure-step-procedure-differencial-diagnosis-pigmented-lesions-adapted.webp)
![Table 2.1: Definition of some dermoscopic structures that are used in the diagnosis of melanocytic lesions (Adapted from [2, 50]).](https://thumb-eu.123doks.com/thumbv2/123dok_br/15471639.1034497/32.918.134.754.440.815/table-definition-dermoscopic-structures-diagnosis-melanocytic-lesions-adapted.webp)
![Table 2.2: ABCD rule of dermoscopy (Adapted from [2, 50]).](https://thumb-eu.123doks.com/thumbv2/123dok_br/15471639.1034497/33.918.135.772.300.571/table-abcd-rule-dermoscopy-adapted.webp)