Mergers & Acquisitions: buy-side advisory
solution to PepsiCo, Inc. on its acquisition of
Mondelēz International, Inc.
André Silvano
152417074
Dissertation written under the supervision of
Professor António Borges de Assunção
Dissertation submitted in partial fulfilment of requirements for the MSc in Finance,
at the Universidade Católica Portuguesa
I
Abstract
The aim of this dissertation is to issue a buy-side recommendation, based upon a combination of strategical drivers and valuation methodologies, to PepsiCo, Inc. on its acquisition of Mondelēz International, Inc. Within the non-cyclical markets framework, the F&B business sector stands out for its solid M&A activity. Product innovation and shifts in consumer preferences stimulate PepsiCo, Inc. to engage in a sizeable deal, being Mondelēz International, Inc. the optimal target. PepsiCo, Inc. intrinsic EV amount to USD 238,093 million, while Mondelēz International, Inc. intrinsic EV is equal to USD 86,076 million. The deal relies on a friendly approach with a purchase premium of 25% on Mondelēz International, Inc. current market value on the 24th of May 2019.
This proposal generates a total purchase price of USD 93,862 million, captures synergies, net of fees, of USD 5,654 million and the sources of funds correspond to 55% of stock and 45% of cash. The transaction signals shareholder value creation and presents a potential accretion of 25.40% in 2025.
Keywords: Mergers and acquisitions; non-cyclical market; F&B; synergies
Resumo
O objetivo desta dissertação consiste em emitir uma recomendação de compra, baseada na combinação de vetores estratégicos e metodologias de avaliação, à PepsiCo, Inc. na sua aquisição da Mondelēz International, Inc. No âmbito dos mercados não cíclicos, o sector de negócio dos alimentos e bebidas destaca-se pelo elevado número de fusões e aquisições. A inovação e as alterações das preferências dos consumidores estimulam a PepsiCo, Inc. a envolver-se num negócio de maior dimensão, sendo a Mondelēz International, Inc. o alvo ideal. O valor intrínseco da PepsiCo, Inc. é de 238.093 milhões de dólares, enquanto o da Mondelēz International, Inc. corresponde a 86.076 milhões de dólares. A transação assenta numa abordagem amigável com um prémio de 25% sobre o valor de mercado da Mondelēz International, Inc. a 24 de maio de 2019. Esta proposta gera um preço de compra de 93.862 milhões de dólares, cria sinergias no valor líquido de 5.654 milhões de dólares e projeta-se que ações e dinheiro sejam as fontes de financiamento do negócio em 55% e 45% respetivamente. A transação demonstra que existe criação de valor para os acionistas e apresenta um potencial lucro por ação de 25,40% em 2025. Palavras-chave: Fusões e aquisições; mercado não cíclico; alimentos e bebidas; sinergias
II
Acknowledgments
First and foremost, I would like to thank to my family for the ongoing encouragement and unconditional support throughout this rewarding journey at Católica-Lisbon School of Business and Economics.
Also, I would like to express my sincere gratitude to my friends, girlfriend and colleagues for all the motivation, enriching discussions and outstanding fellowship in the last two years.
Last but not least, I would like to thank to professor António Borges de Assunção, whose availability, insights, guidance and valuable remarks made possible the conclusion of my MSc in Finance dissertation.
III
Table of contents
List of figures ... VIII List of tables ... IX List of formulas ... XII List of abbreviations ... XIII List of variables and symbols ... XVI
1. Introduction ... 1
2. Literature review ... 2
2.1. Mergers and acquisitions overview ... 2
2.1.1. Value creation determinants ... 2
2.1.2. Takeovers and defense tactics ... 2
2.1.3. Buy-side priorities and mergers varieties ... 3
2.1.4. Motivations ... 3
2.1.5. Payment methods ... 4
2.2. Valuation techniques ... 5
2.2.1. Intrinsic valuation methodologies ... 5
2.2.1.1. Discount rate ... 6
2.2.1.1.1. Risk-free rate ... 6
2.2.1.1.2. Cost of equity... 6
2.2.1.1.3. Cost of debt ... 8
2.2.1.1.4. Weighted average cost of capital ... 9
2.2.1.2. Discounted cash flow methodologies ... 9
2.2.1.2.1. Free cash flow to the firm ... 10
2.2.1.2.2. Free cash flow to the equity ... 11
2.2.1.2.3. Adjusted present value ... 11
2.2.1.3. Dividend discount model ... 12
IV
2.2.3. Option pricing methodology ... 14
3. Industry analysis ... 15
3.1. Food and beverage industry overlook ... 15
3.1.1. Growth drivers ... 16
3.1.2. Mergers and acquisitions market overview ... 17
3.2. Food and beverage segments of interest ... 17
3.2.1. Global carbonated soft drinks ... 17
3.2.2. Global confectionery ... 18
4. Company analysis ... 19
4.1. PepsiCo, Inc. ... 19
4.1.1. Share price history ... 19
4.1.2. Ownership structure ... 20
4.1.3. Historical operating and financial analysis ... 21
4.1.4. Future prospects ... 23
4.2. Mondelēz International, Inc. ... 24
4.2.1. Share price history ... 24
4.2.2. Ownership structure ... 25
4.2.3. Historical operating and financial analysis ... 26
4.2.4. Future prospects ... 28
5. Transaction rationale ... 29
6. Valuation ... 30
6.1. PepsiCo, Inc. ... 30
6.1.1. Income statement forecasts ... 30
V
6.1.3. Cash flow statement forecasts ... 33
6.1.4. Discount rate ... 34
6.1.5. Free cash flow to the firm ... 34
6.1.6. Sensitivity and scenario analysis ... 35
6.1.7. Relative valuation ... 37
6.1.8. Valuation results ... 37
6.2. Mondelēz International, Inc. ... 37
6.2.1. Income statement forecasts ... 37
6.2.2. Balance sheet forecasts ... 39
6.2.3. Cash flow statement forecasts ... 40
6.2.4. Discount rate ... 40
6.2.5. Free cash flow to the firm ... 41
6.2.6. Sensitivity and scenario analysis ... 41
6.2.7. Relative valuation ... 43
6.2.8. Valuation results ... 43
6.3. Deal consolidation ... 44
6.3.1. Synergies ... 44
6.3.2. Transaction and integration fees ... 45
6.3.3. Discount rate ... 45
6.3.4. Valuation results ... 46
6.3.5. Synergies sensitivity analysis ... 46
7. Transaction issues ... 47
7.1. Takeover methodology ... 47
VI
7.3. Form of payment ... 48
7.4. Accretion/dilution analysis ... 49
7.5. Acquisition risks and integration ... 50
8. Conclusion ... 51
Appendices ... 52
Appendix 1 – Global M&A motivations and recent volumes ... 52
Appendix 2 – True value of an acquisition ... 53
Appendix 3 – Porter’s five forces ... 54
Appendix 4 – SWOT analysis ... 55
Appendix 5 – Historical normalized EBITDA ... 56
Appendix 6 – PepsiCo’s forecasted income statement ... 57
Appendix 7 – PepsiCo’s forecasted balance sheet ... 58
Appendix 8 – PepsiCo’s forecasted cash flow statement ... 60
Appendix 9 – PepsiCo and Mondelēz’s unlevered betas ... 61
Appendix 10 – PepsiCo and Mondelēz’s terminal value growth rates ... 63
Appendix 11 – PepsiCo’s share price ... 64
Appendix 12 – PepsiCo’s sensitivity analysis on share price ... 65
Appendix 13 – PepsiCo and Mondelēz’s relative valuation and cluster allocation ... 65
Appendix 14 – Mondelēz’s forecasted income statement ... 67
Appendix 15 – Mondelēz’s forecasted balance sheet ... 68
Appendix 16 – Mondelēz’s forecasted cash flow statement ... 70
Appendix 17 – Mondelēz’s share price ... 71
Appendix 18 – Mondelēz’s sensitivity analysis on share price ... 72
VII
Appendix 20 – Fees forecast ... 73
Appendix 21 – Discount rate of the merged entity ... 73
Appendix 22 – Synergies’ sensitivity analysis ... 74
Appendix 23 – Recent deals in the consumer staples sector ... 75
Appendix 24 – True value of Mondelēz’s acquisition ... 75
Appendix 25 – Pro-forma income statement forecast ... 76
Glossary ... 77
VIII
List of figures
Figure 1 – F&B industry deduction according to Global Industry Classification Standard ... 15
Figure 2 – Traditional F&B value chain ... 15
Figure 3 – Companies with higher market capitalization in the consumer staples sector as of May 2019, in USD billions ... 16
Figure 4 – Deals, in the United States and Canada, by types of buyer as of December 2018, in percentage ... 17
Figure 5 – PepsiCo and S&P 500 10-year cumulative returns ... 20
Figure 6 – Historical 10-year daily returns of PepsiCo and S&P 500, in percentage ... 20
Figure 7 – Mondelēz’s and S&P 500 10-year cumulative returns ... 25
Figure 8 – Historical 10-year daily returns of Mondelēz and S&P 500, in percentage ... 25
Figure 9 – PepsiCo's forecasted income statement, in USD millions ... 31
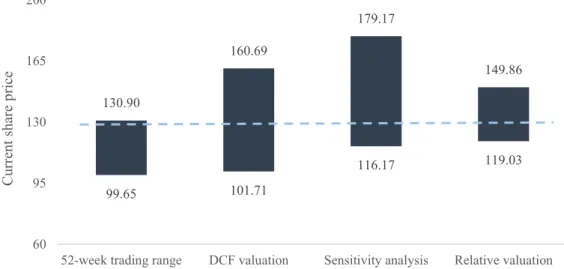
Figure 10 – PepsiCo’s valuation, or equity value per share, summary, in USD ... 37
Figure 11 – Mondelēz’s forecasted income statement, in USD millions ... 38
Figure 12 – Mondelēz’s valuation, or equity value per share, summary, in USD ... 43
Figure 13 – PV of transaction synergies divided by categories, in percentage ... 45
Figure 14 – EV of the combined corporation, in USD millions ... 46
Figure 15 – Global M&A volumes between 2014-2018, in USD trillions ... 52
Figure 16 – True value of an acquisition ... 53
Figure 17 – Radar chart of Porter's five forces in the global carbonated soft drinks and global confectionery segments ... 54
Figure 18 – PepsiCo SWOT analysis ... 55
Figure 19 – Mondelēz SWOT analysis ... 55
IX
List of tables
Table 1 – FCFF ... 10
Table 2 – FCFE... 11
Table 3 – Most popular multiples in valuation divided by categories... 13
Table 4 – Global carbonated soft drinks market value forecasts between 2018 and 2022, in USD millions ... 18
Table 5 – Global confectionery market value forecasts between 2018 and 2022, in USD millions ... 18
Table 6 – PepsiCo segments, underlying core businesses and percentage of total revenue as of December 2018 ... 19
Table 7 – PepsiCo’s top investors as of December 2018, in millions ... 21
Table 8 – PepsiCo’s P&L statement overview between 2014 and 2018, in USD millions... 22
Table 9 – Profitability ratios of PepsiCo between 2014 and 2018, in percentage ... 22
Table 10 – Liquidity, leverage and performance ratios of PepsiCo between 2014 and 2018 ... 23
Table 11 – Mondelēz segments, underlying core businesses and percentage of total revenue as of December 2018 ... 24
Table 12 – Mondelēz’s top investors as of December 2018, in millions ... 26
Table 13 – Mondelēz’s P&L statement overview between 2014 and 2018, in USD millions ... 27
Table 14 – Profitability ratios of Mondelēz between 2014 and 2018, in percentage ... 27
Table 15 – Leverage, liquidity and performance ratios of Mondelēz between 2014 and 2018 .... 28
Table 16 – PepsiCo debt maturity disclosure in 2017 and 2018, in USD millions ... 33
Table 17 – PepsiCo’s FCFF, in USD millions ... 35
Table 18 – Summarized PepsiCo share value sensitivity analysis, in USD ... 36
Table 19 – PepsiCo share value in terms of conservative, normal and optimistic scenarios, in USD and percentage ... 36
X
Table 20 – Mondelez debt maturity disclosure in 2017 and 2018, in USD millions ... 39
Table 21 – Mondelēz’s FCFF, in USD millions ... 41
Table 22 – Summarized Mondelēz share value sensitivity analysis, in USD ... 42
Table 23 – Mondelēz share value in terms of conservative, normal and optimistic scenarios, in USD and percentage ... 42
Table 24 – Maximum bid price and transaction premium, in USD millions ... 48
Table 25 – Stock issuance and pro-forma FD shares outstanding, in USD millions ... 49
Table 26 – Accretion/dilution analysis, in USD millions and percentage ... 50
Table 27 – Porter's five forces in the global carbonated soft drinks and global confectionery segments ... 54
Table 28 – Normalized EBITDA... 56
Table 29 – PepsiCo and Mondelēz normalized EBITDA and margins between 2014 and 2018, in USD millions and percentage ... 56
Table 30 – PepsiCo’s historical and forecasted income statement, in USD millions ... 57
Table 31 – PepsiCo’s historical and forecasted balance sheet, in USD millions ... 59
Table 32 – PepsiCo’s forecasted cash flow statement, in USD millions ... 60
Table 33 – PepsiCo’s adjusted unlevered beta, in USD millions and percentage ... 62
Table 34 – Mondelēz’s adjusted unlevered beta, in USD millions and percentage ... 62
Table 35 – PepsiCo and Mondelēz growth rate in perpetuity, in percentage ... 63
Table 36 – PepsiCo’s WACC, FCFF and value per share, in USD millions and percentage ... 64
Table 37 – PepsiCo share value sensitivity analysis, in USD and percentage ... 65
Table 38 – PepsiCo relative valuation ... 66
Table 39 – Mondelēz relative valuation ... 66
Table 40 – Mondelēz’s historical and forecasted income statement, in USD millions ... 67
XI
Table 42 – Mondelēz’s forecasted cash flow statement, in USD millions ... 70
Table 43 – Mondelēz’s WACC, FCFF and value per share, in USD millions and percentage ... 71
Table 44 – Mondelēz share value sensitivity analysis, in USD and percentage ... 72
Table 45 – Transaction synergies estimation, in USD millions and percentage ... 72
Table 46 – Integration and transaction fees forecast, in USD millions and percentage ... 73
Table 47 – Pro-forma WACC, in USD millions and percentage ... 73
Table 48 – Synergies sensitivity analysis, in USD and percentage ... 74
Table 49 – Most recent and larger comparable deals in the consumer staples sector ... 75
XII
List of formulas
Formula 1 – Present value ... 6
Formula 2 – Beta estimation regression... 7
Formula 3 – Conventional unlevered beta approach ... 7
Formula 4 – Cost of equity according to CAPM ... 8
Formula 5 – Cost of equity according to FF three-factor model ... 8
Formula 6 – After-tax cost of debt ... 9
Formula 7 – WACC ... 9
Formula 8 – Firm value according to FCFF ... 10
Formula 9 – Equity value according to FCFE ... 11
Formula 10 – Base-case APV ... 12
Formula 11 – Stock value according to DDM ... 12
Formula 12 – PP&E end of period value ... 32
Formula 13 – Intangibles end of period value ... 32
Formula 14 – Retained earnings end of period value ... 33
Formula 15 – Unlevered beta smoothing process ... 61
XIII
List of abbreviations
AMEX American Stock Exchange
APV Adjusted present value
BSM Black-Scholes model
CAGR Compounded annual growth rate
CAPEX Capital expenditure
CAPM Capital asset pricing model
CCF Capital cash flow
CEO Chief executive officer
CF Cash flow
COGS Cost of goods sold
CRSP Center for Research in Security Prices
DCF Discounted cash flows
DDM Dividend discount model
DOJ Department of Justice
EBIT Earnings before interest and taxes
EBITDA Earnings before interest, taxes, depreciations and amortizations
EBT Earnings before taxes
EPS Earnings per share
EV Enterprise value
F&B Food & beverage
F&SR Food & staples retailing
FB&T Food, beverage & tobacco
XIV
FCFF Free cash flow to the firm
FD Fully diluted
FF Fama and French
H&PP Household & personal products
ICR Interest coverage ratio
IMF International Monetary Fund
ITS Interest tax shields
LBO Leveraged buyout
LT Long term
M&A Mergers & Acquisitions
MRP Market risk premium
NASDAQ National Association of Securities Dealers Automated Quotations
NOPLAT Net operating profit less adjusted taxes
NYSE New York Stock Exchange
P&L Profit & loss
PER Price-to-earnings ratio
PP&E Property, plant & equipment
PV Present value
R&D Research & development
ROE Return on equity
ROIC Return on invested capital
S&P 500 Standard & Poor’s 500
SG&A Selling, general & administrative
XV
ST Short term
SWOT Strengths, weaknesses, opportunities and threats
TCJA Tax Cuts and Jobs Act
USD United States dollar
WACC Weighted average cost of capital
WC Working capital
YOY Year-over-year
XVI
List of variables and symbols
𝜷𝒊 Beta coefficient i 𝜷𝑳 Levered beta
𝜷𝑼 Unlevered beta
𝑫 Debt
𝑫𝒕 Dividend per share at time t
𝑬 Equity
𝑬[𝑪𝑭𝒕] Expected cash flow at time t
𝑭𝑪𝑭𝑬𝒕 Free cash flow to the equity at time t
𝑭𝑪𝑭𝑭𝒕 Free cash flow to the firm at time t 𝒈 Growth rare
𝑯𝑴𝑳 High minus low 𝒌 Discount rate 𝒌𝒅 Cost of debt
𝒌𝒆 Cost of equity
𝑷𝑽(𝑰𝑻𝑺) Present value of interest tax shields 𝒓𝒇 Risk-free interest rate
𝒓𝒊 Return on investment i
𝒓𝑴 Return on market index
𝑺𝑴𝑩 Small minus big 𝒕 Marginal tax rate 𝑻 Corporate tax rate
1
1. Introduction
Continuous improvement is a challenging process during periods with an increasing pace of change and disruption. In order to thrive, corporations need to draw up growth strategies tailored toward progress.
Amongst the non-cyclical markets encompassed in the consumer staples sector, the F&B industry arises as a particularly relevant business segment to examine. As a result of product innovation, shifts in consumer demand, new legislation, original sustainable packaging practices and intensive competition, M&A activity becomes a viable alternative for leading players like PepsiCo, Inc. Hence, a merger with a powerful corporation that allows PepsiCo, Inc. to strengthen its competitive position and enhance its brand image, would, perhaps, generate higher added value and delight the management team. Thus, this dissertation aims to answer the following fundamental research question: should PepsiCo, Inc. start bargaining the acquisition of Mondelēz International, Inc. on
the 27th of May 2019?
In truth, to explore the likelihood of closing this megadeal successfully, it is mandatory to investigate external and internal factors, cross-reference economic, financial and operational findings, as well as compare results. One secondary research question that emerges from this study is: what is PepsiCo, Inc. and Mondelēz International, Inc.’s current fair value on the 24th of May
2019?
Accordingly, to respond to the aforesaid questions, this dissertation is divided into seven sections: section 2 describes the prevailing academic literature on M&A and main valuation techniques; section 3 provides an in-depth analysis of the F&B industry and the two segments of interest, global carbonated soft drinks and confectionery; section 4 introduces PepsiCo, Inc. and Mondelēz International, Inc. activity, historical performance and future plans; section 5 discusses the deal rationale; section 6 valuates each stand-alone company and the combined firm; section 7 defines critical transaction issues and explores the deal acceptance; section 8 presents financial advisory conclusions to PepsiCo, Inc.
2
2. Literature review
2.1. Mergers and acquisitions overview
2.1.1. Value creation determinantsM&A represent a form of organizational restructuring with the ultimate goal of improving overall performance (Lubatkin, 1983) and creating net value (Bruner, 2004). Bauer and Matzler (2014) state that the success of this source of external growth and corporate development depends on the interaction of strategic complementarity, cultural fit and integration, whilst Bruner (2004) declare that financing deals mainly with cash, acquiring firms from related industries and having rigorous governance practices are three factors that increase the likelihood of having higher post-merger returns. Moreover, the premium size does not always correlate with the success of the underlying deal (Eccles, Lanes, & Wilson, 1999). In this sense, pre-merger and post-merger phases need to be properly managed and should be based upon a clear strategy (Bower, 2001).
2.1.2. Takeovers and defense tactics
According to Schnitzer (1996), friendly and hostile takeovers are two approaches that relate to specific disadvantages. The first creates agency problems between shareholders and executives, and the second often leads to a target-oriented tender offer without prior management consent (Schnitzer, 1996). Further, Schnitzer (1996) shows empirical evidence that raiders search hostile takeovers in uncertain environments, essentially due to management’s inside information. Nevertheless, target entities might protect themselves and reduce the probability of success of these unwelcome bids through shark repellants (Pound, 1987), such as, poison pills and white knights. The former post-bid defense tactic is associated with contingent securities that harm acquirer’s goals as a result of unwanted financial obligations, loss of voting rights, or dilution of equity holdings (Mallette & Fowler, 1992), whereas the latter allows the target organization to be purchased by a friendly acquirer, invited by the target management (Shleifer & Vishny, 1986), with favorable takeover conditions. In addition, one must have thorough and independent governance mechanisms to avoid negative reactions of the market when triggering anti-takeovers defenses (Bruner, 2004).
3
2.1.3. Buy-side priorities and mergers varieties
Kaplan and Schoar (2005) observe that private equity average fund returns, net of fees, are barely equal to the ones from S&P 500, notwithstanding a large level of heterogeneity in the industry and throughout time. Thereby, it is regular to see financial buyers, especially LBO funds, leveraging their investments, by way of operational and capital restructuring, in order to maximize equity returns1 (Shivdasani & Zak, 2007). Aside from leverage, focus on cash returns, organizational
culture, capital structure flexibility and shareholder expectations are other drivers of private equity value creation (Shivdasani & Zak, 2007).
Still, some buy-side agents are more focused on horizontal mergers, which occur between competitors or companies from the same industry, and vertical expansions, which arise between firms in different supply chain stages (Meador, Church, & Rayburn, 1996). Other common natures of M&A transactions are the conglomerates, deals made by companies with unrelated lines of business (Bruner, 2002) and perhaps, from different geographies, and product-congeneric mergers, transactions between firms that share similar production but different portfolios of products (Lubatkin & O’Neill, 1987). At the end, these sorts of strategic investments are, in essence, attempting to identify and reach synergies (Damodaran, 2005).
2.1.4. Motivations
There are several reasons to engage in M&A, and Bower (2001) stresses that acquisitions are made to: deal with overcapacity through consolidation; roll-up competitors in geographically fragmented industries; boost the range of products offered; substitute R&D; explore the limits of an eroding industry.
The term synergy, frequently used in M&A, is defined by Damodaran (2005) as the value generated by combining two companies into a new and more valuable one, forming opportunities that would not be available if both entities operate separately. Hence, Damodaran (2005) divides this concept in two categories: operating and financial.
4 On the one hand, operating synergies are relevant M&A determinants (Bernile & Bauguess, 2011) and allow companies to improve their operating margins from existing assets, growth rate, or both (Damodaran, 2005). Better growth rates, higher pricing power, combination of different functional strengths2 and economies of scale3 are four types of operating synergies (Damodaran, 2005).
On the other hand, financial synergies resemble financial conditions which lead to a lower cost of capital, higher expected CFs, or both, and show up under the form of higher debt capacity, more
uses for excess cash, tax benefits and diversification (Damodaran, 2005). Debt refinancing, capital management optimization and tax-engineering make transactions feasible and can produce value for shareholders (Eccles et al., 1999). However, financial synergies might be negative if the firms involved have fairly different risks and default costs (Leland, 2007).
Meanwhile, Berkovitch and Narayanan (1993) demonstrate empirically that despite the fact that synergies are the main motivation behind transactions with positive returns, the hubris effect is also identifiable in the same sample of deals. Furthermore, Grinstein and Hribar (2004) mentioned that a CEO, who has the power to persuade the board of directors and expects bonuses from M&A activity, may wish to maximize her own wealth rather than shareholder value. Berkovitch and Narayanan (1993) add that this transfer of value from shareholders to managers is the primary motivation behind takeovers with negative total gains4.
2.1.5. Payment methods
Corporate acquisitions are linked to methods of payment that rely on certain characteristics of the acquirer and target firm, as well as features of the underlying environment (Martin, 1996). Those characteristics, such as, mode of acquisition and type of investment opportunity for the acquirer, determine the amount of cash and stock in each M&A deal (Martin, 1996).
2 Often produce revenue enhancements through, for instance, distribution channels (Eccles et al., 1999)
3 Cost savings come from eliminating duplication, like jobs and facilities, or purchasing in volume (Eccles et al., 1999) 4 Appendix 1 enumerates major global M&A motivations of 2018 and illustrates transaction volumes of recent years
5 Additionally, one should consider that cash is utilized to signal high target value and prevent other companies from bidding (Martin, 1996). Indeed, it not only influences announcement effects (Travlos, 1987) but also impacts on post-acquisition returns, since returns from stock-financed M&A are lower than the ones from cash-financed M&A5 (Agrawal, Jaffe, & Mandelker, 1992).
However, as stated by Faccio and Masulis (2005), cash offers normally require debt financing, in consequence of limited liquidity, which rises financial distress costs and constrain the bidder’s payment choice.
Bruyland, Lasfer, De Maeseneire and Song (2019) show evidence that bidders with high default risk are more likely to finance acquisitions with shares. Hence, target corporations accept these transactions due to the high premia paid, which justify the risk taken (Bruyland et al., 2019). Stock deals with high premiums appear, for instance, when a huge amount of synergies will be captured by the acquiring company (Eccles et al., 1999). Further, shares are mainly used as a method of payment in cases of friendly takeovers, smoothly overvalued acquirer’s stock price, decentralized ownership, lack of cash and larger deals in size (Bruner, 2004).
Other types of deal designs relate to LBOs, whereby target shareholders earn large abnormal returns, earnouts, which provide stronger performance incentives to the seller management team, and collars, that make stock-for-stock offers more likely to succeed (Bruner, 2004).
2.2. Valuation techniques
2.2.1. Intrinsic valuation methodologies
The intrinsic value6 of a company corresponds to its net present value of expected future CFs
(Eccles et al., 1999) and it is based upon a DCF approach, which emerged as a best practice, and became the standard, in terms of valuing corporate assets (Luehrman, 1997b). Formula 1 indicates how to compute the present value of an asset (Luehrman, 1997b).
5 Tender offers amplify the relationship between cash and shares, meaning, when the payment is in cash, the expected
average returns are even higher (Bruner, 2004)
6 Intrinsic values are usually lower than market values (Eccles et al., 1999). Appendix 2 shows the true value of an
6 𝑃𝑟𝑒𝑠𝑒𝑛𝑡 𝑣𝑎𝑙𝑢𝑒 = ∑ 𝐸[𝐶𝐹𝑡]
(1 + 𝑘)𝑡 𝑛
𝑡=0
Where, n indexes for number of periods in the asset’s life 𝐸[𝐶𝐹𝑡] for expected cash flow at time t
𝑘 for discount rate
Formula 1 – Present value
2.2.1.1. Discount rate
Since investors require higher returns, the discount rate is composed by the sum of the risk-free rate of return7 and a risk premium8 (Luehrman, 1997b).
2.2.1.1.1. Risk-free rate
The risk-free rate does not have default nor reinvestment risk, and, in mature markets like, for instance, F&B, it is measured by a 10-year treasury bond consistent with how CFs are defined (Damodaran, 2008). Apart from that, the risk-free rate of return is the basis for estimating the cost of equity and the cost of debt (Damodaran, 2008).
2.2.1.1.2. Cost of equity
In the aftermath of choosing the correct proxy for the risk-free interest rate, it is important to estimate the risk premium for equity market exposure9, which consists of an extra return from
investing in the stock market (Jacobs & Shivdasani, 2012).
7 Risk-free fluctuations change the value of existing and growing assets (Damodaran, 2008) 8 Bearing more risk brings greater returns (Luehrman, 1997b)
9 Jacobs and Shivdasani (2012) specify that the majority of the firms use MRPs within a range between 5% and 6%,
7 Subsequently, one quantifies the systematic risk through a measure that replicates the sensitivity of a security’s returns relative to the market’s returns (Jacobs & Shivdasani, 2012). This tool, widely recognized as beta, is estimated by the regression in Formula 2 (Damodaran, 1999).
𝑟𝑖 = 𝛼 + 𝛽 . 𝑟𝑀
Where, 𝑟𝑖 indexes for return on investment i 𝑟𝑀 for return on market index
Formula 2 – Beta estimation regression
Non-cyclical companies, like the ones from F&B industries, have lower betas than firms sensitive to market conditions, like automobile organizations (Damodaran, 1999). Besides the business type, operating and financial leverage are the remaining determinants of betas (Damodaran, 1999). Thereby, a bottom-up approach should be developed, with unlevered betas, as expressed by Formula 3 (Damodaran, 1999), followed by leverage (Jacobs & Shivdasani, 2012) and market adjustments (Blume, 1975).
𝛽𝑈 = 𝛽𝐿
1 + (1 − 𝑇) . 𝐷𝐸 Where, 𝛽𝑈 indexes for unlevered beta
𝛽𝐿 for levered beta
𝑇 for corporate tax rate 𝐷 for debt
𝐸 for equity
Formula 3 – Conventional unlevered beta approach
Then, one has the required elements to calculate the cost of equity according to a largely used model, the CAPM (Jacobs & Shivdasani, 2012). The model assumes that expected excess returns from an asset are proportional to its beta (Merton, 1973) as described by Formula 4 (Ross, 1976).
8 𝑘𝑒 = 𝑟𝑓+ 𝛽𝑖 . (𝑟𝑀− 𝑟𝑓)
Where, 𝑘𝑒 indexes for cost of equity
𝑟𝑓 for risk-free interest rate 𝛽𝑖 for market beta i
Formula 4 – Cost of equity according to CAPM
An alternative method is the FF three-factor model, which expands the aforementioned model by adding two common risk factors in the returns on stock: size and value10 (Fama & French, 1993).
The mathematical representation is described in Formula 5 (Fama & French, 1993). 𝑘𝑒 = 𝑟𝑓+ 𝛽1 . (𝑟𝑀 − 𝑟𝑓) + 𝛽2 . 𝑆𝑀𝐵 + 𝛽3 . 𝐻𝑀𝐿
Where, 𝛽 indexes for factor coefficient
𝑆𝑀𝐵 for small minus big factor (average returns on small-cap portfolios minus large-cap portfolios)
𝐻𝑀𝐿 for high minus low factor (average returns on high book-to-market value portfolios minus low book-to-market value portfolios)
Formula 5 – Cost of equity according to FF three-factor model
2.2.1.1.3. Cost of debt
Koller et al. (2010) argue that companies with low risk of default estimate their pre-tax cost of debt through the YTM of LT bonds, a suitable proxy for firms with an investment-grade rating. Formula 6 determines the after-tax cost of debt11 (Koller et al., 2010).
10 There are results which favor the CAPM-based approach over the FF three-factor model (Kaplan & Ruback, 1996) 11 It includes tax-adjustments (ITS) as a result of the firm’s debt capacity (Luehrman, 1997b)
9 𝐴𝑓𝑡𝑒𝑟 − 𝑡𝑎𝑥 𝑐𝑜𝑠𝑡 𝑜𝑓 𝑑𝑒𝑏𝑡 = 𝑘𝑑 . (1 − 𝑡)
Where, 𝑘𝑑 indexes for pre-tax cost of debt 𝑡 for marginal tax rate
Formula 6 – After-tax cost of debt
2.2.1.1.4. Weighted average cost of capital
The WACC is the most common discount rate in valuation, it shows whether value is created or destroyed by the funding program (Luehrman, 1997b) and it is interpreted as the weighted average of the costs of equity and debt (Jacobs & Shivdasani, 2012).
It bundles all the financing side effects into the discount rate12 (Luehrman, 1997b), which is
expressed in Formula 7 (Koller et al., 2010). 𝑊𝐴𝐶𝐶 = 𝑘𝑒 . 𝐸
𝐸 + 𝐷+ 𝑘𝑑 . 𝐷
𝐸 + 𝐷 . (1 − 𝑡) Where, 𝐸
𝐸+𝐷 indexes for target level of equity to firm value using market-based values 𝐷
𝐸+𝐷 for target level of debt to firm value using market-based values
Formula 7 – WACC
2.2.1.2. Discounted cash flow methodologies
Valuation is a function of cash, timing and risk (Luehrman, 1997b) and the DCF methodology follows this pattern13. This approach valuates businesses as a range of future risky CFs, in which
expected future CFs are forecasted and discounted to the present value at the opportunity cost (Luehrman, 1997b). Furthermore, a DCF valuation is divided in four standard methods: FCFF, FCFE, APV and CCF14 (Oded & Michel, 2007). Discount rates and CFs are the factors that
distinguish the methods formerly cited (Oded & Michel, 2007).
12 The typical WACC approach assumes a constant debt-to-capital ratio (Kaplan & Ruback, 1996) 13 DCF methodologies prompt reliable forecasts of market value (Kaplan & Ruback, 1996)
10
2.2.1.2.1. Free cash flow to the firm
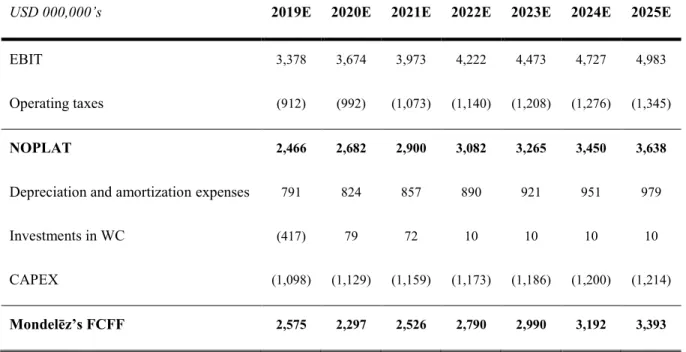
Pinto, Henry, Robinson and Stowe (2010) claim that the after-tax CF available to all company’s shareholders and bondholders is the FCFF. It is independent of non-operating items, financing (Koller et al., 2010) and, as reported before, is vastly adopted in finance (Luehrman, 1997b). Table 1 identifies how the FCFF is computed (Pinto et al., 2010).
EBIT
- Operating taxes = NOPLAT
+ Depreciation and amortization expenses - Investments in WC
- Investments in CAPEX
= FCFF
Table 1 – FCFF
Because FCFF is regarded as the CF to all suppliers of capital (Pinto et al., 2010), the value of the firm makes use of the WACC (Oded & Michel, 2007), as shown in Formula 8 (Pinto et al., 2010).
𝐹𝑖𝑟𝑚 𝑣𝑎𝑙𝑢𝑒 = ∑ 𝐹𝐶𝐹𝐹𝑡 (1 + 𝑊𝐴𝐶𝐶)𝑡 𝑛 𝑡=0 + 𝐹𝐶𝐹𝐹𝑛+1 𝑊𝐴𝐶𝐶 − 𝑔 . 1 (1 + 𝑊𝐴𝐶𝐶)𝑛
Where, 𝐹𝐶𝐹𝐹𝑡 indexes for FCFF at time t 𝑔 for growth rate
Formula 8 – Firm value according to FCFF
Thereafter, to reach the equity value, one should subtract, from the enterprise value, the market value of debt, and excess cash/cash equivalents if not deducted beforehand (Pinto et al., 2010).
11
2.2.1.2.2. Free cash flow to the equity
The FCFE is the CF from operations less CAPEX and payments to debtholders15 (Pinto et al., 2010)
therefore, the act of increasing dividends to shareholders lead to better valuations and higher FCFE (Koller et al., 2010). Table 2 exemplifies how to calculate the FCFE (Pinto et al., 2010).
Net Income + Cash charges - Investments in WC - Investments in CAPEX + Net borrowing = FCFE Table 2 – FCFE
Once FCFE represents the CF available to equity holders, after all other dues have been satisfied, the equity value of the firm discounts the FCFE at the cost of equity, as expressed in Formula 9 (Pinto et al., 2010). 𝐸𝑞𝑢𝑖𝑡𝑦 𝑣𝑎𝑙𝑢𝑒 = ∑ 𝐹𝐶𝐹𝐸𝑡 (1 + 𝑘𝑒)𝑡 𝑛 𝑡=0 +𝐹𝐶𝐹𝐸𝑛+1 𝑘𝑒− 𝑔 . 1 (1 + 𝑘𝑒)𝑛
Where, 𝐹𝐶𝐹𝐸𝑡 indexes for FCFE at time t
Formula 9 – Equity value according to FCFE
2.2.1.2.3. Adjusted present value
The common framework of the APV methodology is based on valuing the components of the business distinctly, meaning, the sum of the present value of the project as if it was financed with equity and the present value of financing effects, such as, interest tax shields, cost of financial distress and issue costs (Luehrman, 1997a).
12 To have a more comprehensive and schematic approach, a basic APV analysis should be subdivided in five different steps: prepare performance forecasts of the target; discount base-case CFs and terminal value; value financing side effects; add the components of value; adapt or modify the model according to the managers’ preferences and needs (Luehrman, 1997a).
In sum, the APV is a flexible and reliable tool in terms of valuation methods (Luehrman, 1997a) and can be better tailored to make substantial changes in capital structure16 (Koller et al., 2010).
Formula 10 indicates how to calculate a base-case APV17 (Koller et al., 2010).
𝐴𝑃𝑉 = 𝑉𝑢+ 𝑃𝑉(𝐼𝑇𝑆)
Where, 𝑉𝑢 indexes for present value of the unlevered firm
𝑃𝑉(𝐼𝑇𝑆) for present value of ITS
Formula 10 – Base-case APV
2.2.1.3. Dividend discount model
One of the most straightforward and old present value methodologies to valuing common stock is the DDM (Pinto et al., 2010). This approach claims that a value of stock depends on future dividends, as determined by Formula 11(Pinto et al., 2010).
𝑆𝑡𝑜𝑐𝑘 𝑣𝑎𝑙𝑢𝑒 = ∑ 𝐷𝑡 (1 + 𝑘𝑒)𝑡 𝑡=1
Where, 𝐷𝑡 indexes for dividend per share at time t
Formula 11 – Stock value according to DDM
Nonetheless, this model does not accurately forecast a significant number of dividends and has debatable assumptions, like a stable dividend growth rate (Pinto et al., 2010).
16 Particularly relevant when firms need to issue a huge level of debt to proceed with the purchase (Koller et al., 2010) 17 On a more detailed view, APV should also value bankruptcy costs (Koller et al., 2010)
13
2.2.2. Relative valuation methodology
Dealmakers and investment bankers generally price acquisitions using transaction or trading multiples (Kaplan & Ruback, 1996). This valuation method is based upon two major assumptions: comparable firms are presumed to have expected future CFs that grow at the same rate and with the same underlying risks as those of the company being valued; value varies, in the same proportion, with changes in performance (Kaplan & Ruback, 1996).
Even though there are no perfect matches and the abovementioned assumptions are not completely valid (Kaplan & Ruback, 1996), multiples are useful after performing a valuation which relies on a different methodology (Fernández, 2001).
Considering that relative valuation analysis provide insights in terms of key value drivers of one industry18, it is pertinent to form a proper comparable set (Goedhart et al., 2005). Yet one may first
organize multiples in three major groups: multiples based on the firm’s capitalization, value and growth (Fernández, 2001). Table 3 expresses five of the most used multiples in valuation (Fernández, 2001).
Type Name Formula
Capitalization Price-to-earnings ratio Share price/EPS Value Enterprise-value-to-EBITDA ratio EV/EBITDA Growth-referenced Price/earnings to growth ratio PER/growth of EPS
Capitalization Price-to-sales ratio Share price/SPS Value Enterprise-value-to-sales ratio EV/sales
Table 3 – Most popular multiples in valuation divided by categories
Despite of different industries being valued with distinct multiples19, in general, the most used
multiples are the EV/EBITDA and the PER20 (Fernández, 2010). Then, one should bear in mind
that finding the adequate peer group is a picky process that requires knowing operating and financial specifics of one market (Goedhart et al., 2005).
18 Multiples should be based on recent data and not contain one-time events (Goedhart, Koller, & Wessels, 2005) 19 The F&B sector is commonly valued through the EV/EBITDA multiple (Fernández, 2010)
14
2.2.3. Option pricing methodology
Option pricing computes a value for each option that a deal can create as a consequence of several possible outcomes (Eccles et al., 1999). It values, for example, companies with new technologies in fast growing markets, such as, telecommunication firms, and one broadly used model is the BSM21 (Luehrman, 1997b).
21 This valuation methodology will not be further analyzed since it will not be used to valuate neither PepsiCo, Inc.
15
3. Industry analysis
3.1. Food and beverage industry overlook
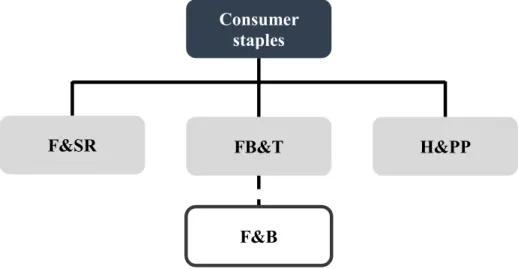
Aligned with the Global Industry Classification Standard (2018), within the consumer staples sector, it is possible to identify three key industry groups, being the F&B industry deducted from the FB&T industry group22 – Figure 1 reflects the aforementioned hierarchy.
Figure 1 – F&B industry deduction according to Global Industry Classification Standard
Additionally, the food products industry incorporates two sub-industries, agricultural products, as well as packaged food and meats, while beverages span three sub-industries, brewers, distillers and vintners, as well as soft drinks (Global Industry Classification Standard, 2018). In short, when it comes to F&B, the industry is composed by various categories and classes of participants, Figure 2 systematizes the F&B value chain (Natural Capital Coalition, 2016).
Figure 2 – Traditional F&B value chain
22 In other words, the F&B business sector might be taken from a blend of two industries, more precisely, food products
and beverages (Global Industry Classification Standard, 2018) Production Input companies Farmers Manufacturing Traders F&B companies Distribution Supermarkets Independents Consumption Retail and corporate consumers Consumer staples
F&SR FB&T H&PP
16 One consumer staples index, launched in 1996, with 33 constituents classified as consumer staples companies, according to the Global Industry Classification Standard, is the S&P 500 consumer staples index (Thomson Reuters, 2019). This index has a market value of around USD 2.04 trillion and Figure 3 presents the components with higher market capitalization (Thomson Reuters, 2019).
Figure 3 – Companies with higher market capitalization in the consumer staples sector as of May 2019, in USD billions
From the group of corporations exposed above, there are three organizations that belong to the F&B business sector: The Coca-Cola Company (USD 212 billion), PepsiCo, Inc. (USD 182 billion) and Mondelēz International, Inc. (USD 75 billion).
3.1.1. Growth drivers
A crucial global growth driver of the F&B industry is the premiumization process of the products offered, being value one of the most highlighted features (Fitch Solutions, 2019). Hence, considering that volume is not a main determinant and consumer preferences continue to change, disruption is what boosts growth (Fitch Solutions, 2019). The access to information and consumers’ healthful diets are two other critical growth drivers of the F&B industry – gluten-free products are an example of a niche segment that gain value as access to information and health concerns increase (Mellentin, 2018). In this sense, larger corporations, like PepsiCo, Inc., face substantial pressure, and in order to remain competitive, as well as diminish their limitations, these companies need to reduce costs, diversify through new products and perform acquisitions (Fitch Solutions, 2019).
59.8 61.1 75.1 98.0 108.8 131.7 181.5 211.6 267.6 294.4 0 40 80 120 160 200 240 280 320 Estée Lauder Companies Inc.
Colgate-Palmolive Company Mondelēz International, Inc. Altria Group, Inc. Costco Wholesale Corporation Philip Morris International Inc. PepsiCo, Inc. The Coca-Cola Company Procter & Gamble Company Walmart Inc.
17
3.1.2. Mergers and acquisitions market overview
In the United States and Canada, M&A activity in the F&B industry remained strong, with a total of 276 transactions in 2018 (Duff & Phelps, 2019). From the previously cited deal volume, 89% of the deals were closed by strategic buyers, whereas 11% were done by financial buyers. Also, in 68% of the cases a private buyer was involved, as displayed in Figure 4 (Duff & Phelps, 2019).
Figure 4 – Deals, in the United States and Canada, by types of buyer as of December 2018, in percentage
Recent activity revealed that the segments with greater transaction volumes in 2018 were: alcoholic beverages, namely, craft brewers, distillers and vintners; general food products, especially oil producers, sauces, condiments and frozen foods; non-alcoholic beverages, to a certain extent due to cannabis-infused beverage drinks (Duff & Phelps, 2019).
3.2. Food and beverage segments of interest
PepsiCo, Inc. and Mondelēz International, Inc. are market leaders in two different segments. Hereupon global carbonated soft drinks and global confectionery markets will be briefly discussed.
3.2.1. Global carbonated soft drinks
In a summarized matter, the global carbonated soft drinks market is dominated by The Coca-Cola Company and PepsiCo, Inc.23 (MarketLine, 2018a). This segment, whose market value CAGR is
likely to be around 3.04% between 2018 and 2022, encompasses the retail sale of carbonated soft drinks, Table 4 forecasts its market values between 2018 and 2022 (MarketLine, 2018a).
23 Player with higher market share in the global savory snacks segment (MarketLine, 2018b)
89%
11%
Strategic buyer Financial buyer
68%
32%
18
USD 000,000’s 2018 2019 2020 2021 2022 CAGR
(2018-2022)
Market value 291,500 301,584 310,661 319,768 328,552 3.04% Table 4 – Global carbonated soft drinks market value forecasts between 2018 and 2022, in USD millions
Furthermore, carbonated soft drinks’ product innovation relies on the appearance of opportunities that are associated with novel government legislation, as well as health and well-being (MarketLine, 2018a). The former relates to, for instance, new regulation to help prevent obesity whereas the latter is connected to higher demand for sugar-free drinks24 (MarketLine, 2018a).
3.2.2. Global confectionery
In broad terms, the global confectionery market comprises the retail sale of chocolate, gum and sugar confectionery products (MarketLine, 2019). Mars, Inc., Mondelēz International, Inc. and Nestlé S.A. are the players with superior market share in this segment (MarketLine, 2019). Market value forecasts illustrate that the segment should grow at a similar pace than previous years, reflecting a CAGR of 4.19% between 2018 and 2022, as estimated in Table 5 (MarketLine, 2019).
USD 000,000’s 2018 2019 2020 2021 2022 CAGR
(2018-2022)
Market value 168,623 175,990 183,407 190,908 198,733 4.19% Table 5 – Global confectionery market value forecasts between 2018 and 2022, in USD millions
In addition, confectionery growth is influenced by conventional factors, like higher disposable income and fast urbanization, and modern aspects, such as greater health awareness andthe upward trend of gifting confectionery products25 (MarketLine, 2019). Consequently, manufactures
innovate via new healthy snacks and original packaging26(MarketLine, 2019).
24 To complement the analysis, Appendix 3 illustrates Porter’s five forces in the global carbonated soft drinks segment 25 Brand loyalty and assertive marketing strategies also bear market growth (MarketLine, 2019)
19
4. Company analysis
4.1. PepsiCo, Inc.
PepsiCo, Inc.27 is an American global F&B firm, quoted in the NASDAQ stock market, with a
portfolio of leading and widespread brands, including Pepsi-Cola, Frito-Lay, Gatorade, Quaker and Tropicana28 (Thomson Reuters, 2019). The company is headquartered in New York, United States
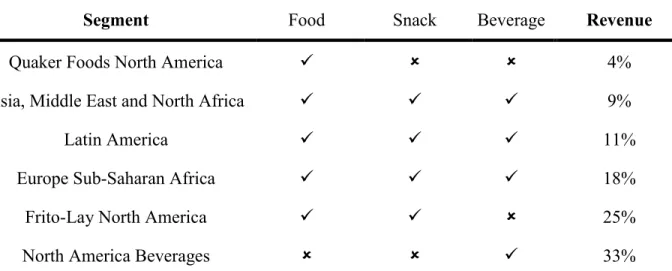
and produces, markets, distributes and sells its products in six divisions, which, alongside their core businesses29 and percentage of total revenue, are outlined in Table 6 (Thomson Reuters, 2019).
Segment
Business
Revenue
Food Snack Beverage
Quaker Foods North America ✓ 4%
Asia, Middle East and North Africa ✓ ✓ ✓ 9%
Latin America ✓ ✓ ✓ 11%
Europe Sub-Saharan Africa ✓ ✓ ✓ 18%
Frito-Lay North America ✓ ✓ 25%
North America Beverages ✓ 33%
Table 6 – PepsiCo segments, underlying core businesses and percentage of total revenue as of December 2018
4.1.1. Share price history
PepsiCo’s quote history shows evidence that in a time-span of ten years30 its CAGR was
approximately 9.71%. Throughout this period of time, PepsiCo had a minimum stock price of USD 50.0 in May 27, 2009 and a maximum of USD 130.5 in May 17, 2019. Figure 5compares PepsiCo’s cumulative returns with the S&P 500 index (Thomson, Reuters, 2019).
27 Henceforth denominated as PepsiCo
28 In order to analyze PepsiCo’s internal and external competitive strands, Appendix 4 presents its SWOT analysis 29 Primarily include potato and tortilla chips in the snack business, pasta, rice and cereals in the food business and
finished beverages and beverage concentrates in the beverage business (Thomson Reuters, 2019)
20 Figure 5 – PepsiCo and S&P 500 10-year cumulative returns
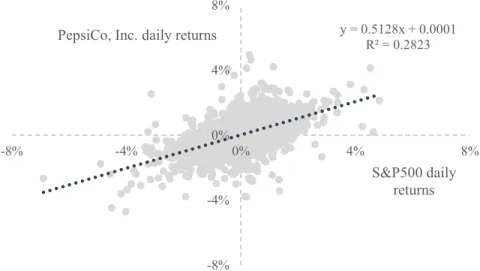
In regard to volatility, the last 1-year standard deviation of PepsiCo’s daily returns and S&P 500 correspond to 0.17 and 0.15 respectively31. Moreover, since 2009, it is verifiable a robust
correlation between the non-cyclical company daily returns and the benchmark, as expressed in Figure 6(Thomson Reuters, 2019).
Figure 6 – Historical 10-year daily returns of PepsiCo and S&P 500, in percentage
4.1.2. Ownership structure
As of May 2019, the number of PepsiCo’s net shares outstanding was 1,402 million32 and Table 7
reports the company’s dominant stockholders (Thomson, Reuters, 2019).
31 From May 24, 2018 to May 24, 2019
32 Free float of 99.77% (Thomson Reuters, 2019)
1 2.5 4
2009 2011 2013 2015 2017 2019
PepsiCo, Inc. S&P 500
y = 0.5128x + 0.0001 R² = 0.2823 -8% -4% 0% 4% 8% -8% -4% 0% 4% 8% S&P500 daily returns PepsiCo, Inc. daily returns
21
Shareholder Shares Value (USD) Position (%)
The Vanguard Group, Inc. 124.2 13,721.3 8.84% BlackRock Institutional Trust Company, N.A. 66.0 7,293.6 4.70% State Street Global Advisors 63.6 7,024.4 4.53% Wellington Management Company, LLP 30.0 3,312.9 2.14% Geode Capital Management, LLC 19.5 2,151.1 1.39% Bank of America Merrill Lynch 18.3 2,023.8 1.30%
Table 7 – PepsiCo’s top investors as of December 2018, in millions
4.1.3. Historical operating and financial analysis
In a brief, historical operating and financial analysis will be managed over the past five years, between 2014 and 2018, with special emphasis on 2018.
Although revenue dropped at a 0.77% CAGR since 2014, organic revenue growth remained positive in the same time-span, reaching a YOY organic growth rate of around 3.70% at the end of 2018 (PepsiCo, 2019b). Once PepsiCo’s aforesaid metric excluded adverse impacts of acquisitions, foreign exchange translation, structural charges and other charges in 2018 (PepsiCo, 2019b), organic revenue is perceived as a decisive cornerstone for mature companies involved in markets with recurring consolidation processes and M&A activity.
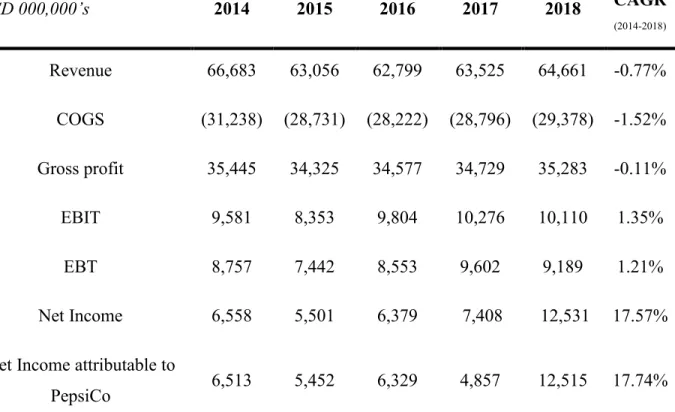
In the meantime, gross profit’s CAGR, over the last five years, went down by approximately 0.11% each year, as expressed in Table 8 (Thomson Reuters, 2019). On the whole, excluding net income and net income attributable to PepsiCo items33, the firm appears to present a low CAGR in its
margins between 2014 and 2018.
33 Values abundantly affected by negative tax provisions in 2018, which, on account of tax benefits related to
international operations reorganization, as well as non-cash tax benefits from certain international tax audits and past years audit resolutions, amount to USD 3,342 million (PepsiCo, 2019b)
22 USD 000,000’s 2014 2015 2016 2017 2018 CAGR (2014-2018) Revenue 66,683 63,056 62,799 63,525 64,661 -0.77% COGS (31,238) (28,731) (28,222) (28,796) (29,378) -1.52% Gross profit 35,445 34,325 34,577 34,729 35,283 -0.11% EBIT 9,581 8,353 9,804 10,276 10,110 1.35% EBT 8,757 7,442 8,553 9,602 9,189 1.21% Net Income 6,558 5,501 6,379 7,408 12,531 17.57% Net Income attributable to
PepsiCo 6,513 5,452 6,329 4,857 12,515 17.74% Table 8 – PepsiCo’s P&L statement overview between 2014 and 2018, in USD millions
Despite the overall small positive adjustment between 2014 and 2018, the reported gross margin, in 2018, fell down 10 basis points compared to the previous year. Likewise, this negative tendency, in the last two years, was valid for the EBIT margin34 presented in Table 9.
2014 2015 2016 2017 2018 CAGR
(2014-2018)
Gross margin 53.15% 54.44% 55.06% 54.67% 54.57% 0.66% EBIT margin 14.37% 13.25% 15.61% 16.18% 15.64% 2.14%
Table 9 – Profitability ratios of PepsiCo between 2014 and 2018, in percentage
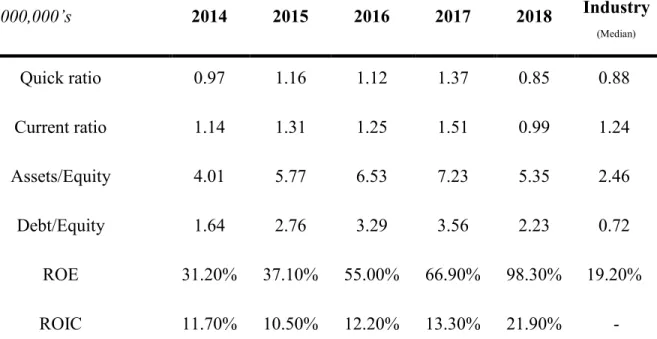
23 Further, PepsiCo’s liquidity patterns have swung over the past four years, with a quick ratio ranging from 0.85 to 1.37 and a current ratio oscillating from 0.99 to 1.51 (Thomson Reuters, 2019). Parallel to this, the firm’s leverage have been quite unstable, manifesting higher debt levels than the industry median. A final remark relates to PepsiCo’s increasing ROE and ROIC, which went up by around 67% and 10% respectively, as expressed in Table 10 (Thomson Reuters, 2019).
USD 000,000’s 2014 2015 2016 2017 2018 Industry (Median) Quick ratio 0.97 1.16 1.12 1.37 0.85 0.88 Current ratio 1.14 1.31 1.25 1.51 0.99 1.24 Assets/Equity 4.01 5.77 6.53 7.23 5.35 2.46 Debt/Equity 1.64 2.76 3.29 3.56 2.23 0.72 ROE 31.20% 37.10% 55.00% 66.90% 98.30% 19.20% ROIC 11.70% 10.50% 12.20% 13.30% 21.90% -
Table 10 – Liquidity, leverage and performance ratios of PepsiCo between 2014 and 2018
4.1.4. Future prospects
PepsiCo’s current solid momentum suggests that its past investments went as planned and that the CEO transition, in October 2018, was conducted efficiently (PepsiCo, 2019b).
On the one hand, as strategic measures is concerned, in 2019, the firm intends to: develop structural changes, in order to become more agile to commercial opportunities; invest in north America F&B segments to sustain its leadership and provide more benefits, like variety and desirability, to its consumers; improve automation and demand forecasting; focus on progressing sustainability (PepsiCo, 2019b). On the other hand, in terms of financial goals for 2019, PepsiCo plans to: achieve an organic revenue growth of 4%, improving shareholder value; reach core EPS of around USD 5.50; have total cash returns of approximately USD 8 billion, USD 5 billion in dividends and USD 3 billion in share repurchases (PepsiCo, 2019b).
24
4.2. Mondelēz International, Inc.
Mondelēz International, Inc.35 is an American global F&B company, quoted in the NASDAQ stock
market, that manufactures and markets snacks and beverages and has a portfolio of renowned brands36, such as, Oreo biscuits, Milka chocolates, Trident gum and Tang powdered beverages37
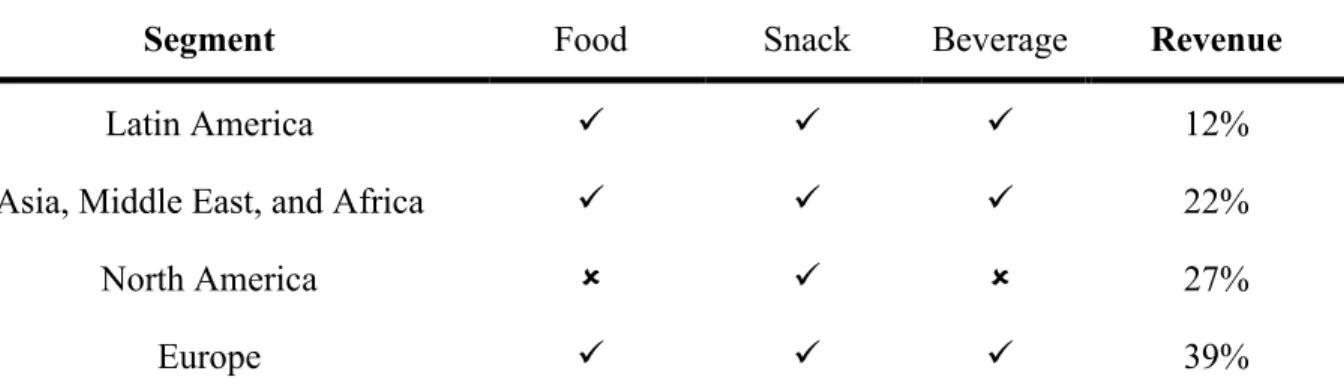
(Thomson Reuters, 2019). The firm is headquartered in Illinois, United States and it is segmented in four geographic regions addressed in Table 11 (Thomson Reuters, 2019).
Segment
Business
Revenue
Food Snack Beverage
Latin America ✓ ✓ ✓ 12%
Asia, Middle East, and Africa ✓ ✓ ✓ 22%
North America ✓ 27%
Europe ✓ ✓ ✓ 39%
Table 11 – Mondelēz segments, underlying core businesses and percentage of total revenue as of December 2018
4.2.1. Share price history
Mondelēz’s share price evolution in the latter ten years38 displayed a CAGR of roughly 11.91%.
During this historical period, the company recorded a maximum share price of USD 52.8 in May 16, 2019 and a minimum of USD 16.2 in June 16, 2009. Mondelēz’s scrutinized cumulative returns, compared to the S&P 500, are detailed in Figure 7 (Thomson Reuters, 2019).
35 Hereafter named as Mondelēz
36 Comprises mainly gum, candy, biscuits and chocolate in the snack business, cheese and grocery in the food business
and coffee and powdered beverages in the beverage business (Thomson Reuters, 2018)
37 In order to analyze Mondelēz’s internal and external competitive strands, Appendix 4 presents its SWOT analysis 38 From May 26, 2009 to May 24, 2019
25 Figure 7 – Mondelēz’s and S&P 500 10-year cumulative returns
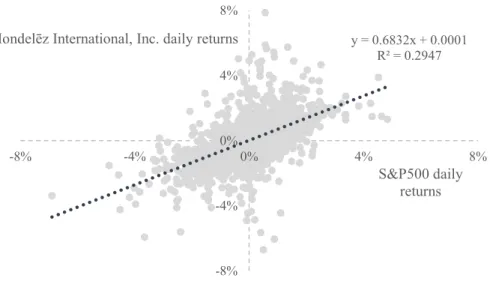
In addition, the last 1-year standard deviation of Mondelēz’s daily returns equals 0.1639. Even
though in some cases one may observe significant share price variations, mature F&B corporations tend to be less volatile, andMondelēz is no exception. Figure 8 contrast Mondelēz historical daily returns with the S&P 500 index (Thomson Reuters, 2019).
Figure 8 – Historical 10-year daily returns of Mondelēz and S&P 500, in percentage
4.2.2. Ownership structure
The company’s number of shares outstanding, as of May 2019, was 1,440 million40 and Table 12
discloses Mondelēz’smost influential shareholders (Thomson, Reuters, 2019).
39 From May 24, 2018 to May 24, 2019
40 Free float of 99.82% (Thomson Reuters, 2019)
1 2.5 4
2009 2011 2013 2015 2017 2019
Mondelēz International, Inc. S&P 500
y = 0.6832x + 0.0001 R² = 0.2947 -8% -4% 0% 4% 8% -8% -4% 0% 4% 8% S&P500 daily returns Mondelēz International, Inc. daily returns
26
Shareholder Shares Value (USD) Position (%)
The Vanguard Group, Inc. 107.6 4,308.1 7.44% State Street Global Advisors 63.5 2,541.8 4.39% BlackRock Institutional Trust Company, N.A. 62.5 2,503.0 4.32% J.P. Morgan Asset Management 30.9 1,236.9 2.14% Lindsell Train Limited 30.7 1,229.3 2.12% Capital International Investors 21.9 877.4 1.52%
Table 12 – Mondelēz’s top investors as of December 2018, in millions
4.2.3. Historical operating and financial analysis
Mondelēz’s historical operating and financial analysis will be organized over the past five years, given greater prominence to 2018.
In line with the PepsiCo’s case, Mondelēz reported a negative revenue CAGR of around 6.71% since 2014, and a positive organic revenue growth in the same period, announcing a YOY organic growth rate of approximately 2.40% at the end of 2018 (Mondelēz, 2019c).This prepotent variable reflected positive values among all Mondelēz’s segments in 2018 annual results, being Latin America the region with highest YOY organic growth, around 3.60%, and North America the division with the lowest YOY organic growth, approximately 0.60% (Mondelēz, 2019c).
Unlike gross profit’s negative CAGR, Mondelēz operating income’s CAGR corresponded to 3.66% between 2014and 201841, as it is possible to validate in Table 13 (Thomson Reuters, 2019).
Furthermore, over the last five years, the net income attributable to Mondelēz item exhibits a CAGR of 11.54% – largely due to earnings, not distributed as dividends, from affiliates, joint ventures or associated organizations (Thomson Reuters, 2019).
27 USD 000,000’s 2014 2015 2016 2017 2018 CAGR (2014-2018) Revenue 34,244 29,636 25,923 25,896 25,938 -6.71% COGS (21,647) (18,124) (15,819) (15,862) (15,586) -7.88% Gross profit 12,597 11,512 10,104 10,034 10,352 -4.79% EBIT 2,747 8,897 2,127 3,451 3,172 3.66% EBT 2,554 7,884 1,454 3,124 2,842 2.71% Net Income 2,201 7,291 1,340 2,414 2,088 -1.31% Net Income attributable to
Mondelēz 2,184 7,267 1,635 2,828 3,381 11.54% Table 13 – Mondelēz’s P&L statement overview between 2014 and 2018, in USD millions
Overall, the firm profitability margins show positive CAGRs between 2014 and 201842, stressing,
for instance, a notable EBIT margin of 11.12%, as expressed in Table 14. However, in 2018, the gross profit margin was the ratio with the greatest increase when compared to 2017 – 116 basis points.
2014 2015 2016 2017 2018 CAGR
(2014-2018)
Gross margin 36.79% 38.84% 38.98% 38.75% 39.91% 2.06% EBIT margin 8.02% 30.02% 8.21% 13.33% 12.23% 11.12%
Table 14 – Profitability ratios of Mondelēz between 2014 and 2018, in percentage
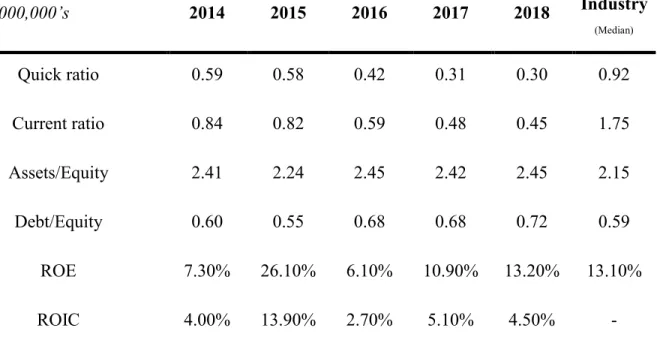
28 Meanwhile,sinceMondelēz’s quick ratio and current ratio are lower than the industry median, the firm’s capacity to meet its ST obligations might be jeopardized. Nevertheless, despite the lack of liquidity, the company’s financial leverage ratios have small fluctuations throughout time,with an assets-to-equity ratio varying from 2.24 to 2.45 and a debt-to-equity ratio ranging from 0.55 to 0.72, as illustrated in Table 15 (Thomson Reuters, 2019). Lastly, reliable performance indicators leave, in practice, investors relatively optimistic (Thomson Reuters, 2019).
USD 000,000’s 2014 2015 2016 2017 2018 Industry (Median) Quick ratio 0.59 0.58 0.42 0.31 0.30 0.92 Current ratio 0.84 0.82 0.59 0.48 0.45 1.75 Assets/Equity 2.41 2.24 2.45 2.42 2.45 2.15 Debt/Equity 0.60 0.55 0.68 0.68 0.72 0.59 ROE 7.30% 26.10% 6.10% 10.90% 13.20% 13.10% ROIC 4.00% 13.90% 2.70% 5.10% 4.50% -
Table 15 – Leverage, liquidity and performance ratios of Mondelēz between 2014 and 2018
4.2.4. Future prospects
Mondelēz’s strategic and structural plan allowed the company to meet its financial estimates and start 2019 with transparent consumer-centric priorities (Mondelēz, 2019c).
On the one hand, the firm’s growth-oriented strategic plan for 2019 relies on: a more complete view of the snack business to refine brand positioning; marketing and digital transformation in order to increase ROIC; brand extension and balanced investments; continuous operational excellence; higher investments in talent and building capability; a new employee reward system (Mondelēz, 2018). On the other hand, Mondelēz’s financial targets for 2019 and LT goals relate to: an organic revenue growth of 3%; a FCFF of USD 3 billion; a high-single digit adjusted EPS growth at constant currency (Mondelēz, 2019c).
29
5. Transaction rationale
According to Bruner (2004), reshaping businesses in order to reply to changes in external environments creates value. As stated in aforesaid sections, PepsiCo belongs to a non-cyclical industry, in which the degree of premiumization, innovation and cost efficiencies are the principal drivers of growth (Fitch Solutions, 2019).
Nonetheless, one of the major threats in the carbonated soft drinks segment is the competition among leading players (MarketLine, 2018a). Thus, to diversify its portfolio, bear more effectively the current market constraints (Fitch Solutions, 2019), continue to invest in F&B segments and maintain strong operating performance (PepsiCo, 2019b), the firm should engage in sizeable M&A activity. Additionally, PepsiCo’s new CEO might be willing to accept a deal that allows the firm to have more international scale.
In the aftermath of PepsiCo’s strategic interests, Mondelēz fits as a worthwhile target. This multinational snack and beverages corporation seems to be able to complement current PepsiCo’s business, once it has a set of operational and financial advantages that may appeal to PepsiCo. Therefore, this target choice can be justified by the following reasons: strong presence in emerging markets through a differentiated portfolio of powerful brands (Thomson Reuters, 2019);same most influential shareholders, such as The Vanguard Group, Inc., and Mondelēz’s stockholders higher demand for earnings and dividends (Thomson Reuters, 2019); revenue enhancements from Mondelēz’s ample global distribution network and cost savings from workforce optimization (MarketLine, 2019); striking profitability margins (Thomson Reuters, 2019) and positive organic revenue growth in prior years (Mondelēz, 2019c).
Henceforth, to price this transaction, PepsiCo and Mondelēz will be valued as two stand-alone companies, in accordance with their estimated future performance, and, consequently, it will be structured a pro-forma model, combining both F&B firms.