i Universidade Católica Portuguesa
Católica Lisbon School of Business & Economics
Banco Popular
Equity Research
João Miguel Martins Gonçalves, 152110322
Abstract
There are several valuation methods available for equity research; their suitability varies with each specific company’s characteristics. The objective of this dissertation is to choose from the existing methods, the one which is more appropriate for Banco Popular, in order to come up with a recommendation target price. Finally I will compare my results with those obtained by Bankia in the equity research report published on the 2nd February 2012
Advisor: Prof. José Carlos Tudela Martins
Dissertation submitted in partial fulfillment of requirements for the degree of MSc in Business Administration, at the Universidade Católica Portuguesa, date 4th June 2012
i
II. Acknowledgments ... iii
1. Executive summary ... 1
2. Literature review ... 2
2.1. Valuation ... 2
2.2. Choosing a valuation model ... 3
2.3. Relevant valuation models ... 4
2.3.1. Enterprise vs. Equity ... 4
2.3.1.1. Dividend Discount Model ... 5
2.3.1.2. Free Cash Flow Equity ... 6
2.3.1.3. Excess return model (RIM) ... 7
2.3.1.4. DuPont ... 8
2.4. Cost of equity ... 10
2.4.1. CAPM ... 10
2.4.2. Risk Free ... 11
2.4.3. Beta ... 11
2.4.4. Equity Risk Premium... 13
2.4.5. Ke ... 13
2.5. Relative valuation ... 14
2.5.1. Enterprise vs. Equity multiples ... 15
2.5.1.1. PER ... 16 2.5.1.2. PBV ... 16 3. Characteristics of banks ... 17 3.1. Regulation ... 18 3.2. Accounting rules ... 19 3.2.1. Provisions ... 19 3.2.2. Mark to market ... 19
3.3. Cash flow estimation ... 19
3.4. Debt ... 20 4. Company presentation ... 21 4.1. Shareholders structure ... 21 4.2. Business volume ... 22 4.3. Profitability ... 23 4.4. Solvency... 27 4.5. Efficiency ... 28
ii
4.6. Liquidity ... 29
4.7. Assets’ quality ... 30
5. Macroeconomic overview ... 32
6. Regulation ... 35
7. Spanish banking sector ... 37
8. Valuation Methodology... 41
9. Assumptions ... 42
9.1. Discount rate ... 42
9.1.1. Beta ... 42
9.1.2. Risk Free ... 42
9.1.3. Equity risk premium ... 42
9.1.4 Country risk premium... 43
9.2. Balance sheet ... 44
9.2.1. Deposits and loans ... 44
9.2.2. Available-for-sale financial assets ... 45
9.2.3. Tangible assets ... 45
9.2.3.1. Reinsurance assets ... 46
9.2.4. Non-current assets held for sale. ... 46
9.2.5. Net asset value ... 47
9.2.6. Other items ... 47
9.3. Income statement ... 47
9.3.1. Net interest margin ... 47
9.3.2. Fees and commissions ... 47
9.3.3. Administrative expenses ... 48
9.3.4. Provisions ... 49
9.4. NPLs ... 49
9.5. Risk weighted assets ... 49
10. DuPont valuation ... 50
10.1. Sensitivity analysis ... 51
11. Relative valuation ... 52
12. Comparison with investment bank ... 55
13. Conclusions... 56
14. Appendixes ... 59
iii
I. Acknowledgments
The dissertation involves individual work in its majority, but during the writing process there was also the need to contact with several people, who in different ways were helpful regarding my overall learning experience and final outcome; I would like to express my gratitude to:
Professor José Carlos Tudela, for his prompt availability and pertinent comments, concerning difficulties I had along my thesis writing period.
Dr. Rui Semedo; for the facilitation of personal meetings with the staff of Banco Popular located in Lisbon and Dr. Javier Bernat, for making available his equity research report.
Finally I would like to thank my equity research seminar colleagues for their support and constructive arguments
1
1. Executive summary
Spanish banks: Banco Popular It’s a tough road ahead
The macroeconomic scenario is unfavorable; recession’s contagion is being felt in Spain, as the economy is facing defying obstacles. EBA urges banks to comply with capital requirements, while at the same time banks can’t overlook the need to offer a stimulating flow of funding to the real side of the economy in order to promote economic growth.
Shrinking interest rate margins are affecting the main revenue driver of Banco Popular; labeled as a pure commercial bank it strives on the difference between its funding and lending rates, the net interest rate margin has achieved all-time lows since the 2008 crisis.
Non-performing loans are on the rise, with sector average reaching 7%, while real estate sector tops 12%, Spanish government urges banks to clean up their balance sheet and cover their construction exposure to restore confidence in the Spanish economy. Banks need to increase their provisioning efforts, dragging down their ROEs
Capital requirements make banks cautious in their lending activity, as they adopt more restrictive measures and lend less overall, while engaging in a deposit luring war. The sovereign crisis leads banks to ECB funding and less dependence on wholesale funding.
Recommendation: SELL
Price Target FY12: 1,44€
Price (as of 13-Feb-2012): 3,56€
(€)
Figure 1. POP’s price evolution Previous 2 years Source: Bloomberg 52week range (€): 3,55-4,64 Market cap (€bn): 4,98 Outstanding shares (m) 1,4 0 2 4 6 8
2
2. Literature review 2.1. Valuation
Every valuation independently of the method used has one objective only, which, is to price an asset. According to (Damodaran, 2006) the price derives from the cash flows the asset is expected to generate in the future.
Valuations are not static, there are different methods which can be used and even though some are more appropriate than others depending on the asset in question, different approaches can be used to value the same asset. Valuations should yield similar results as all of them derive from the same financial valuation theories, (Young, Sullivan, Nokhasteh, & Holt, 1999) defend that every valuation approach is no more than the same underlying model expressed in a different way, however that is when similarities end and challenges arise.
Even if the models have the same financial background, assumptions are also determinant on the final outcome, the value of the asset is influenced by its future, however as history has showed us, the future is uncertain and even if some variables can be predicted with a fair amount of certainty others are left under analysts/investors liberty leaving room for informational and personal beliefs.
In light of different valuation outcomes (Koller, Goedhart, & Wessels, 2005) argue that the final valuation depends on the subjectivity of the assumptions considered, as well as, the way that expectations are managed by the analyst/investor, for instance changes in growth rate and/or expected cash flows in the terminal value can generate huge disparities, as the terminal value alone usually represents the lion’s share of the valuation (Young, Sullivan, Nokhasteh, & Holt, 1999).
3
2.2. Choosing a valuation model
The nature of the company addressed to in this dissertation only allows for certain valuation approaches to be used with relevant and realistic results. When valuing a financial services firm one must take into account its inherent characteristics and understand that “even if the basic principles of valuation apply just as much for financial services as they do to other firms” (Adams & Rudolf, 2006), there are however a “few aspects related to these types of firms that can and most probably will affect how they are ultimately valued” (Damodaran, 2006).
Therefore valuation wise I will focus on the approaches referring to residual income (DuPont in particular) and to relative valuation, notwithstanding I find it both interesting and enriching to explain the preference on the above models in detriment to the other existing ones, highlighting the main differences and specifications that make DuPont and multiples the most appropriate choices.
It is globally accepted in finance that there are three main possible valuation approaches; Damodaran (2006) refers the following. Discounted cash flow, which, is a method that prices an asset by discounting future cash flows at a rate appropriate to their riskiness. Relative valuation that estimates an asset’s value by comparing a common value driver with a relevant market priced peer group. Contingent claim valuation uses option pricing methods in order to value assets with options’ characteristics.
Discounted Cash Flow Valuation
Relative Valuation Contingent Claim Valuation
Equity Cash Flow Dividend Discount Model
Free Cash Flow Capital Cash Flow
Dynamic ROE EV/EBITDA EV/EBIT Price/Earnings Price/Book Value Price/Sales Binomial Black and Scholes
Table 1. Valuation approaches Source: Damodaran (2006)
4
2.3. Relevant valuation models 2.3.1. Enterprise vs. Equity
“Valuing a bank is conceptually difficult” (Koller, Goedhart, & Wessels, 2005), banks pose numerous difficulties that make them impossible to value on an enterprise level, and even equity wise some adjustments need to be made to capture the right value when using FCFE.
The main aspects inherent to banks that make them different from other companies are according to (Damodaran, 2009), the regulatory constraints under which they operate, accounting rules, definition of debt and definition of reinvestment needs. Considering the disparities one is forced to put aside the traditional defined FCFF models.
In order to estimate CFs, items such as net capital expenditures and working capital are necessary; however, when it comes to CAPEX and unlike other companies, banks’ revenues are not dependent on tangible assets.
Banks’ main reinvestment target is in intangible assets such as human capital and brand name which are often categorized as operating expenses in financial statements; NWC is also of little to no significance.
Debt is considered a raw material for banks and is at best loosely defined, the raw material generates cash out flows much like ordinary debt, but if considered as debt banks would end up with huge debt ratios and consequently unrealistic low cost of capital.
At a simple and condensed first glance, which will later on this dissertation be developed, one is faced with characteristics that don’t allow for the estimation of cash flows nor the calculation of cost of capital. Enterprise value is therefore put aside and equity value will be the only focus in this dissertation.
5 2.3.1.1. Dividend Discount Model
The DDM is the oldest valuation model, it measures the only tangible cash flow that is available to investors; it is simple and straightforward, therefore for a company which is in stable growth and that pays most of its earnings in dividends, it is a relevant model and it should present acceptable valuations in line with more generally used approaches.
DDM is a DCF method; it measures the present value of equity by discounting the expected cash dividends at a rate appropriate to the dividends’ riskiness. According to (Foerster & Sapp, 2005) the necessary inputs are projections of future dividends, which, will be a consequence of the company’s earnings growth and its payout ratio, and an appropriate discount rate, which in DDM’s case is the cost of equity (Ke), both of these inputs must be determined taking into consideration the presently available information. The model takes the following formula, where dividends can alternatively be defined as earnings multiplied by payout ratio:
∑
There is a detailed dividend forecast which according to (Dermine, 2009)can be up to five years, after which one adds the present value of the terminal value that corresponds to the future stream of dividends at that point growing constantly in perpetuity. (Dermine, 2009) also argues that the growth rate associated with the terminal value can’t realistically surpass the growth of the economy plus inflation (GNP).
(Damodaran, 2006), stresses the limitations of the model, arguing that paying dividends is strictly a political decision and that companies in an initial phase or companies that choose to retain earnings in order to target investment opportunities don’t pay dividends to its shareholders. One could argue that future dividends would reflect the investment opportunities and would therefore make up for the absence of present dividends, however there is no way to know for sure if the company will eventually distribute dividends in the future, as strengthening cash balances is also a major factor for some companies. There is also the case of companies that decide to
6 pay fixed dividends to its shareholders at the cost of debt or equity issue. It is obvious that one is undervaluing companies in the first case and overvaluing companies in the last case when using DDM, (Milicevic, 2009) adds “cash distribution is not necessarily tied to value generation”.
In cases where cash flow estimation is difficult or even impossible such as in banks, dividends are the only cash flow which can be estimated with some degree of precision, also (Farrell, 1985) argues that given fairly stable earning patterns, retention rates and returns on investment for banks DDM is an appropriate approach.
2.3.1.2. Free Cash Flow Equity
FCFE values a company’s equity by computing future cash flows to equity and discounting them at the expected cost of equity. Traditional CFE represent what is available for distribution to shareholders after capital expenditures and net working capital needs have been met, as well as, financial obligations.
(Damodaran, 2006) compares DDM with FCFE, renaming the latter “potential dividend model”, it means that if a company was to pay out to its shareholders all its cash flows after debt payment and reinvestment needs, both DDM (considering company doesn’t inflate dividends by borrowing) and FCFE methods would yield the same value for the company.
One can quickly realize that if CFE are not fully paid to shareholders as dividends, then the valuation using FCFE will present a higher figure than DDM as the discount rate is the same, and the only changing variable will be the numerator.
∑
When it comes to banks, reinvestment needs such as CAPEX and working capital are non-existent or negligible and debt can be defined loosely at best, however banks are
7 obliged to comply with certain capital ratios equity wise for regulatory reasons and for growth purposes as well, the need to achieve both of the previous can be used to define reinvestment, therefore FCFE to banks can still be calculated, however it will take a different formula.
2.3.1.3. Excess return model (RIM)
Excess return model is a “widely used theoretical framework for equity valuation based on accounting data” (Higgins, 2010), it measures the market value of equity by decomposing the latter into book value plus the value created by the company in the future.
Book value (invested capital) provides a starting point for the investor; according to (Ganguli, 2011) one bases their valuation on the book value which is recognized in the company’s financial statements proceeding to assess the value not recognized, that is, premium over book value. The respective unrecognized value for the company is derived through the forecast of residual income. (Dermine, 2009) refers to the residual income as economic profit which stems from what the company creates in excess of the opportunity cost of shareholders’ equity. (Goedhart & Haden, 2003)
Adding to the above equation (Higgins, 2010) refers to vt which is considered to be value stemming from firm’s intangibles, poorly measured by financial reports or factors inherent to the model mis-specification.
The book value of equity can be deceiving; however (Damodaran, 2002) considers it a reliable measure for banks for two reasons, depreciations are negligible given the asset’s nature of banks and the accounting method for banks is marked up to market. One can simply conclude that if there are no excess returns, then the future projects will only cover the cost of equity, according to (Feltham & Ohlson, 1996) in such a situation the market value of equity will converge to the equity capital invested, if
8 there are positive excess returns the market value of the company will be greater than its invested capital, and lower if the return is smaller than the required cost.
As a forecasting model RIM valuation estimates yield errors, however according to (Penman & Sougiannis, 1998) on a finite horizon RIM produces more accurate forecasts than other equity valuation models such as the DDM and the FCFE.
2.3.1.4. DuPont
DuPont method measures equity performance, it was firstly suited for the average industrial/commercial company; however (Saunders & Anthony, 2000) adapted it for financial institutions. To reach a valuation estimate there are three inputs which must be calculated, demanded ROE, forecasted ROE and NAV. Usually the demanded ROE will come from the CAPM equation, adjusting the parameters concerning risk free, company’s beta, equity risk premium and country risk premium if applicable. In order for one to measure actual ROE, DuPont method breaks it down into three distinct parameters, which are net profit margin (profitability), total asset turnover (efficiency) and equity multiplier (leverage).
DuPont separates the stream of cash flows, which are estimated based on accounting information provided by the firm’s financial statements, through future prediction of the latter one can obtain the forecasted ROE.
The net profit margin reflects what part of the total revenue is actual income for the company, after the operating costs, provisions and taxes have been deducted.
9 Comparing two similar banks with similar costs and revenues, the most conservative bank will in theory estimate larger provisions therefore, its net profit margin will be lower than that of the more aggressive bank that estimates fewer provisions.
Total revenue in the case of a commercial bank is mainly composed by the net interest income, which is its main revenue source plus all other operating revenue related activities, net fees and commissions contribute largely to the total revenue. Net interest income is the income attributed to the bank at the end of its exercise, after all the costs associated with its activity have been subtracted to its revenues.
The total asset turnover estimates the total revenue in terms of total assets. Assets are what generate profitability to the company, this ratio helps to understand how effectively and in what percentage the assets are being turned over into revenues. The quality of the assets is of extreme importance, sound loans with low probability of default will increase the bank’s net income by reducing the need to provision as much when compared with doubtful assets
Equity multiplier is related with the company’s leverage, according to this ratio the less leverage the highest ROE, all ratios remaining unaltered, banks according to nature of their business are naturally highly leveraged, what can partially explain their usually larger ROE when comparing with other companies.
Net profit margin multiplied by the total asset turnover will equal ROA, by multiplying the latter by the equity multiplier one will obtain the ROE.
Finally the last input necessary to calculate the bank’s equity value is the net asset value, which will represent the bank’s own funds corrected for any fact that today increases or decreases its value, therefore pension fund shortfalls, lack of provisions for default and unrealized capital gains/losses must be taken into account.
10 2.4. Cost of equity 2.4.1. CAPM
CAPM is the initial work of (Markowitz, 1959), being later developed by (Sharpe, 1964) and (Lintner, 1965), it relates the expected return of a security with its risk, according to (Fama & French, 2004) “CAPM offers powerful and intuitively pleasing predictions about how to measure risk”.
In order to calculate the expected return one needs the following inputs; risk free rate, security’s beta, equity risk premium and country risk premium if applicable.
{ }
In CAPM the security is associated with a well-diversified portfolio, this way the risk associated with the asset (non-systematic risk) can be minimized; (Rosenberg & Rudd, 1983) add that capital markets will not reward residual risk as it can be cheaply diversified away.
If an investor has a portfolio composed by all the market’s securities he will only by exposed to the market risk. The diversified investor will require a compensation for the risk free plus the asset’s risk, which will be accounted by the asset’s beta times the expected excess return of the market.
Despite its widespread usage, CAPM performs poorly empirically, (Fama & French, 2004) argue it might be a result of simplifying assumptions when formulating the model or even the existent difficulty of implementing valid tests, however this dissertation will not deepen into its flaws and will consider it an appropriate model for valuation purposes.
11
2.4.2. Risk Free
Risk free as pointed out by (Damodaran, 2006) is the difference between actual and expected return, therefore risk free can be broadly defined as an investment which has an expected return equal to the actual return it yields, however and according to (Brigham & Ehrhardt, 2008) a risk free asset exists only in theory, they defend that all financial instruments include at least one of the following risks; default, maturity, liquidity and inflation.
Taking into consideration the above and bearing in mind the possible limitations, the return for government bonds is generally accepted as a proxy for risk free rate, because of its default free nature, but in light of the present situation many governments don’t issue risk free bonds as there is some default risk associated with it. However both German and U.S. zero coupon bonds are still widely accepted as risk free.
In order to exclude the uncertainty about reinvestment rates one should discount asset’s cash flows at a government bond with equal maturity, usually when valuing an asset the horizon is long and the matching of maturities may be difficult to achieve, (Damodaran, 2006) considers that a 10 year government bond should offer a reasonable measure of risk free rate.
2.4.3. Beta
Beta is the risk parameter of an individual asset, according to (Fama & French, 2004) “the market beta of asset i, is the covariance of its return with the market return divided by the variance of the market return”.
There is no available index for all equities; a broad index such as S&P 500 can be used as a proxy, (MacQueen, 1986) minimizes the extent of the benchmark suggesting that betas have to be measured against something and ultimately it is up to the user to decide which market proxy is the most appropriate.
12 (Rosenberg & Rudd, 1983) add “in all but a few cases, the application of the CAPM using betas calculated against a broad stock market index should provide a good working approximation of the risks of corporate investments”.
The above formula relates the asset’s volatility with that of the market, the beta is defined as a measure of exposure to systematic risk, meaning the risk that can’t be diversified away by acquiring a portfolio representative of the market.
There are alternative ways to calculate an asset’s beta. Through the method of similar, which, consists on weighted averaging the betas of the peer group, however the difficulty in establishing an appropriate comparison group as well as the eventuality of inexistent similar companies makes the results yielding from this method not very reliable.
One can also follow a Bayesian approach, this approach consists of two inputs, the average historical beta and the conservative prediction of beta, by giving weights to both inputs one reaches the value of the beta, (Rosenberg & Rudd, 1983) consider this a conservative stance as it minimizes the value of past information, drawing predictions towards the average.
Finally fundamental information which takes the company’s specifications into consideration and the beta it yields will usually outperform the one based upon historical market co-variability.
The market portfolio’s beta, also referred to as the conservative beta above is 1, an asset with a beta lower than 1 varies less than the market, while an asset with a beta higher than 1 behaves contrarily, (MacQueen, 1986) “higher beta portfolios will outperform low beta portfolios in bull markets, but will suffer proportionately greater losses during downturns”
13
2.4.4. Equity Risk Premium
ERP is generally defined as the amount investors demand in order to hold a portfolio of risky assets rather than risk free asset. (Cohen, 2009) explains there are three ways to estimate ERP, by taking into account historical premiums data, by surveying investors “for an estimate of the value that they believe reflects their investment behavior” (Graham & Harvey, 2008) and by using actual returns on assets as unbiased estimates in order to get a forward looking premium.
When accounting for ERP, country risk premium is a subject of little agreement literature wise, on the one hand there are various methods which add the extra risk whether through adjusting CFs or changing the discount factor, on the other hand some authors defend that country risks have low correlations between them and therefore can be diversified away.
(James & Koller, 2000) prefer the CFs approach in order to incorporate the country risk, it consists on estimating CFs according to differently weighted scenarios, the authors defend the use of CFs over discount rates because “diversifiable risk is better handed by the cash flows“. The authors also add that risks depending on the nature of the industry may not apply equally, meaning they are idiosyncratic, and the fact that equity investments may carry lower yields then government ones.
Other authors such as (Goedhart & Haden, 2003) don’t have a particular preferred method instead they argue that in the long term the cost of capital should not include the country risk premium, as economies mature over time, however according to the authors “it may make sense to incorporate some country risk premium when assessing returns on capital over shorter periods of time”.
2.4.5. Ke
For the purpose of this dissertation and taking into account the valuation it involves the only cost of capital that will be necessary to estimate will be the cost of equity, as previously mentioned banks don’t allow for a firm valuation, and the ultimate goal is to arrive at a recommended share price.
14 The model used in the dissertation to calculate the expected return for investors and the respective cost of equity for the company is the CAPM.
{ }
On the above equation both and are common to the whole national market, while is the only varying variable.
2.5. Relative valuation
Multiples are regarded as the simplest way to value a company. Each company has its own which are no more than a ratio between equity or enterprise values and a value driver which according to (Liu, Nissim, & Thomas, 2007) is usually either earnings or CFs.
The valuation of the asset in question can be obtained by multiplying the respective value driver with the average ratio of the stock price to the value driver of the comparable peer group.
When using relative valuation one values an asset based upon on how similar assets are priced by the market, in an efficient market and with a suitable and adequate peer group, one should obtain a price that reflects the asset’s intrinsic value, according to (Damodaran, 2006) multiples will yield reliable values on the premise that markets correctly price assets.
The challenge lies on the suitability of the peer group. So that the final valuation can be meaningful, one must identify a group of companies that have similar growth and risk profile, regarding banks in particular (Dermine, 2009) advises to also take into account the business mix, for instance the concentration of activities on retail, private, corporate and investment banking.
Choosing the appropriate multiple is also critical, as (Lie & Lie, 2002) have showed depending on the firm’s features some multiples yield better results in detriment of others, they have also defend that valuations are more accurate for financial companies then for non-financial, this is probably due to the fact that financial
15 companies have a greater amount of liquid assets, which, are easier to value. However, overall according to (Liu, Nissim, & Thomas, 2007) earnings are preferred over operational cash flows as the most accurate value driver, also the authors have reached the conclusion that forecasted value drivers rather than reported improve the performance of all multiples, when estimating an asset’s price.
Given the simplicity inherent to multiples they are by far the most used valuation technique, however one can incur in several mistakes, in theory the market should value the companies fairly so choosing a sensible peer group should be the defining factor in the valuation’s significance, however there aren’t two companies alike, therefore (Liu, Nissim, & Thomas, 2007) state that multiples are a “quick and dirty” valuation and should be computed to complement more complex discounted cash flow valuations.
2.5.1. Enterprise vs. Equity multiples
Taking into consideration banks’ characteristics, enterprise multiples are not applicable, these multiples’ value drivers are CFs or enterprise values which cannot be computed for banks, therefore only equity multiples will be considered to value banks. Another reason defended by (Milicevic, 2009) which is not related to financial institutions is that mostly, an investor prefers using equity value multiples for market capitalization because the latter don’t require adjustments for net debt and cash piles, although there might be situations when cash piles may have a significant weight.
Enterprise Multiples Equity Multiples EV/EBITDA
EV/EBIT
Price/Earnings Price/Book Value
Price/Sales Table 2. Relative valuation multiples
16 Under equity multiples the only relevant multiples are PER and PBV, as sales are a value driver that is inexistent in the banking sector.
2.5.1.1. PER
PER is the most widely used multiple according to (Liu, Nissim, & Thomas, 2007), it relates the market value of equity with the company’s earnings. It is strictly related with three inputs, the expected growth in earnings, the payout ratio and the cost of equity.
By multiplying the average PER of the peer group by the company’s earnings in question, one obtains its equity value, however one must take into account that some characteristics inherent to banks can influence its earnings, namely provisions for credit losses. Conservative banks will usually take larger provisions when comparing with more aggressive banks, therefore such banks will have higher PERs when comparing with the latter. Whenever earnings are negative PER will have no use, unless a systemic event has led to this situation and a corrected PER can be used instead, for the situation is only temporary and exceptional.
2.5.1.2. PBV
PBV is also a popular multiple for financial institutions, it is mainly driven by return on equity and cost of equity, one can extrapolate at a first condensed glance how the investments have fared taking into consideration the initial invested amount.
There is a lot of literature support for this particular multiple, bank’s assets are accounted marked to market and therefore according to (Damodaran, 2002) “the book equity is much more likely to track the market value of equity invested in existing assets”
17
3. Characteristics of banks
Banks are seldom regarded as the centerpiece of economy, being their core function to facilitate the allocation and deployment of economic resources.
First of all, for the purpose of this dissertation there is the need to distinguish between the two main types of banks which are commercial and investment banks.
Commercial banks focus on offering checking and savings accounts to its depositors while offering liquidity to its lenders through debit/credit cards, mortgage lending and commercial loans.
Investment banks business derives from the offer of financial advice to their clients concerning underwriting, fund management, consultancy, trading, mergers and acquisitions.
As described above the source of revenues differs depending on the nature of the bank, analytically and considering the respective income statements, commercial banks’ lion share of revenues derives from interest income, while for investment banks fees and commissions represent the main value driver.
Banco Popular is a commercial bank, so it makes sense to consider only the reality inherent to commercial banking from here on after.
Commercial banks operate in two distinct markets; they acquire economic resources through deposits from its customers which then they lend at a greater rate than they borrow. Therefore value creation stems from the difference between the spread paid to the depositors and the spread received from the lenders, usually referred to as net interest rate.
In order for banks to bridge the gap between the needs of its borrowers and lenders they are exposed to three different kinds of risks, which are maturity, size and risk. Maturity risk derives from the fact that the bank’s liabilities which are predominantly composed by deposits don’t have the same maturities as its loans, usually deposits have instant access or short maturities, and there is the constant need for the bank to refinance itself in order to maintain its liquidity. In an extreme event if the majority of
18 the bank’s clients were to withdraw their funds, the bank could be faced with the inability to refund its customers, as their funds would be invested in long term loans. Notwithstanding banks are obliged to repay the funds to its customers if they wish to withdraw them, which leads to the other risk faced by banks, the risk itself.
Banks are portrayed as safe havens to deposit money, meaning that there is no risk associated with the funds, there is a rate the banks pay for the depositors money, and the depositor is able to withdraw the money whenever they want (some restrictions may apply). However when lending money there is some probability that the bank won’t be repaid back and that the collateral offered won’t be liquid enough to compensate for the loss, this is the case of the non-performing loan. Although the bank has the obligation to reward adequately its depositor the opposite does not happen and there is the chance that the bank won’t be rewarded in accordance with the terms previously agreed.
Finally size is also an issue for banks; often banks need to pool deposits in order to meet the needs for loans, therefore committing different funds from deposits to the same loan, which, as previously mentioned is associated with a risk of non-performing loan.
Banks have particular features that make them unique from an operational and valuation standpoint, previously light was shed on banks singularities, these singularities lead to particularities which must be accounted for valuation purposes. 3.1. Regulation
Banks are subject to a set of guidelines imposed by governmental agencies given their importance on the real side of the economy, they must follow rules in terms of capital ratios and liquidity which will ultimately influence investment and growth prospects. Regulation exists so that banks don’t compromise its service to the general public, so that they can provide a stable and positively economic impacting stimulus to the economy and so that crises like that of 2008 don’t repeat themselves. However the existence of a strict, restrictive and ever changing regulation in order to meet current needs affects one’s perceived risk of investing in the banking sector as well as the cash flows generated by it.
19
3.2. Accounting rules 3.2.1. Provisions
It has been previously referred to the active presence of banks both in borrowing and in lending, although they have the legal obligation to reward its depositors, it is globally accepted that banks have loan losses, in light of such, accounting wise banks are obliged to create provisions to cover the latter. Loan losses occur when debtors default and are not able to repay for the entirety of the principle and its respective interest, provisions take into account these possible outflows. Regarding the amount of provisions that will impact the profit of the bank, is of the bank’s responsibility and stems from its loan assessment, while a more conservative bank will account for more provisions and greatly impact its profit, a more aggressive bank will account for fewer provisions.
3.2.2. Mark to market
When accounting for balance sheet items in the banking sector the majority of the latter (deposits, loans, derivatives, bonds) have an active market, being therefore registered under a mark to market practice, contrasting with acquisition cost minus depreciations practice. The value of the balance sheet items is observable which allows for a fair value accounting record according to market quotations.
3.3. Cash flow estimation
Considering banking activities both CAPEX and NWC are concepts that don’t fit within the banks’ business model.
The majority of a bank’s balance sheet is composed of financial instruments, while the bank has fixed assets which mainly represent branches and headquarters, their significance in the balance sheet is borderline negligible, meaning that so are its physical reinvestment needs and depreciations. Bank’s core business doesn’t rely on physical property; therefore unlike industrial companies that incur in capital expenditures to create future benefits through physical asset acquisition/upgrades, banks seldom invest on brand name and human capital, the latter are not considered CAPEX but operating expenses under the bank’s income statement. CAPEX needs exist
20 in the banking sector, but are very marginal and are not determinant reinvestment needs for future growth.
NWC can be broadly defined as current assets minus current liabilities; it usually encloses three major accounts, on the assets side of the balance sheet, accounts receivable and inventory and on the liabilities side of the balance sheet, accounts payable. These accounts are also present on the bank’s balance sheet, but again and much like CAPEX they are meaningless and aren’t a value driver for growth. If for calculation purposes one would consider current as the time frame for NWC, then a very significant portion of the balance sheet both from the assets side and liabilities side would fall under that category, yielding a value that isn’t connected to reinvestment needs for future growth.
3.4. Debt
Debt is of difficult definition when it comes to banks, usually one would consider debt a financial instrument that involves the payment of a periodic interest and the principle. While for banks debt is also a financing choice, it is at the same time its raw material, which is transformed into more profitable products. Most of banks’ liabilities are composed by customers’ deposits which involve the payment of interest, however given the banks’ nature, the payment of interests is part of its operational activity and is accounted on the financial statements as operational expenses.
21
4. Company presentation
Banco Popular, from here on after referred as “POP” is a Spanish banking group whose main business is commercial and retail banking with the focus to meet its customer needs, essentially small and medium enterprises (SME). It is the fifth largest financial group in Spain in terms of total assets and is composed by a controlling company (Banco Popular) and by two wholly owned foreign banks, Banco Popular Portugal and Totalbank, which operates in Florida US. Besides the countries the group targets it reinforces its international presence through its representative offices and operating staff all over the world.
Being commercial banking its main activity the group is dependent on direct contact with its customers and it commits itself with financial personalization throughout its 2203 branches of which 1967 are located in Spain. Furthermore it employs approximately 14000 people, of which 12234 are referent to Spain.
In the end of 2011 exercise POP recorded total assets of 131M€, a net interest income of 2087M€ and a net income attributable to the group of 480M€.
4.1. Shareholders structure
POP’s shares are listed on the four Spanish Stock Exchanges as well as on the Lisbon Exchange, it represents a weight of 1,57% concerning capitalization of IBEX-35, which comprises the thirty five most liquid stocks in the Spanish market.
At the end of 2011 the bank’s share capital was made up of 1,4M shares corresponding to 149.618 shareholders, of which around 146.000 were individual investors owning around 32% of the total capital, institutional holdings represented around 26% of total capital and the remaining 42% was attributed to shareholders directly, indirectly or habitually represented by the board of directors.
22 Figure 1. Shareholders structure
Source: Banco Popular’s annual report
4.2. Business volume
POP is the 5th largest financial group in Spain asset wise, one of its strategy pillars concerns the strengthening of balance sheet soundness. Its assets have been growing steadily, but more importantly this growth has been based on restructuring the capacity to withstand the difficulties posed ahead.
Spain is the reference market for the group, 91% of the consolidated assets are derived from business conducted in Spain, while business conducted in Portugal only amounts to 8,4%, the marginal percentage left is attributed to the group’s activities in the U.S. stemming from TotalBank.
The gross operating income of the group reinforces the importance of Spain, 94% of the latter is attributed to Spanish activities while the remaining 6% are attributed to Portugal and to the U.S.
32% 26% 42% Shareholders structure Board of Directors Institutions Individuals
23 Figure 2. %of total assets by country
Source: Banco Popular’s annual report
Figure 3. %of operating profit by county Source: Banco Popular’s annual report
The group is concentrated in four major business areas, commercial banking, institutional and markets, asset management and insurance activity. When it comes to the group’s assets through business areas of activity, commercial banking represents 70% of total consolidated assets while institutional and markets area (“(i) raising of funds in the wholesale and inter-bank markets, (ii) treasury activity assigned to held-to-maturity, available for sale and trading portfolios, (iii) asset and liability hedging operations, (iv) management of tangible and intangible assets”) correspond to approximately 30%.
Given the group’s nature the lion’s share of assets is attributable to lending to customers, although the demand for credit has been weak this item has increased. On the other side of the balance sheet customer deposits have also been increasing, which is in line with POP’s objective to reduce its dependence on the wholesale market.
4.3. Profitability
ROE relates net income with investors’ equity; it measures POP’s efficiency at generating profits from shareholders’ invested capital, while ROA measures the efficiency at generating profits from existent assets. Banks were usually characterized by a high ROE when comparing with the average industrial/commercial company; however they were hit the hardest by the 2008 crisis.
0,91 0,084 0,006 % of total assets Spain Portugal U.S. 0,94 0,05 0,01 % of operating profit Spain Portugal US
24 Figure 4. Evolution of ROA/ROE
Source: Banco Popular’s annual report
The group’s ROE has been decreasing significantly due to a gradual reduction of its net income throughout the period from 2008 to the present. Despite the negative variation on return on equity, POP still ranks amongst the most pre-provision profitable banks.
Concerning the group’s ROA, a decrease has also been observed; again it is explained by a contraction of net income simultaneously with an asset base increase, resulting in fewer earnings generated in proportion with the available resources.
Despite a somewhat constant loans and deposits amount throughout time, both the income and cost derived from the latter have drastically decreased. Notwithstanding the net interest rate has managed to remain stable overtime, which will result in a similar net interest income year on year, except for 2011, when a significant drop has been observed in the net interest rate.
0,97% 0,67% 0,48% 0,37% 17,61% 10,98% 7,13% 5,49% 0,00% 5,00% 10,00% 15,00% 20,00% 2008 2009 2010 2011 Evolution of ROE/ROA ROE ROA
25 Figure 5. Interest rates’ evolution
Source: Banco Popular’s annual report
Net fees and commissions are becoming increasingly important as an income source for the bank, this item namely in the year of 2011 has been an important income driver for the bank representing about 23% of the entire bank’s income.
Figure 6. Operating income segmentation Source: Banco Popular’s annual report
The income detailed by nature reinforces the core activity of commercial banking, as activities related to lending to and borrowing from customers make up for the lion’s share of income generated.
Regarding administrative expenses and depreciations, the bank derived from its employees and branches policy contraction has managed to slightly reduce the overall
2,717% 3,025% 2,602% 2,439% 0,00% 2,00% 4,00% 6,00% 8,00% 2008 2009 2010 2011 Interest rates
Interest income rate Interest cost rate Net interest rate
69,33% 69,62% 71,58% 69,64% 23,64% 18,83% 19,86% 22,88% 0% 20% 40% 60% 80% 100% 2008 2009 2010 2011
Operating income segmentation
Others
Net fees and commissions Net interest income
26 costs despite the inflationary cost increasing pressure. The employees and branches decrease has managed to offset the accompanying inflation costs. In 2011 an increase was registered in other administrative expenses, stemming from informatics updates mostly.
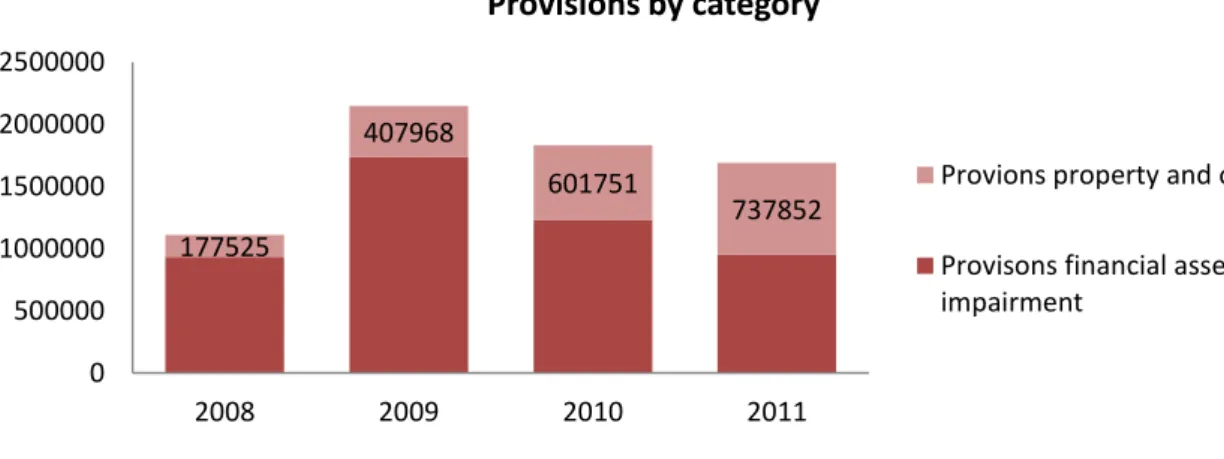
Provisions for financial asset impairment have peaked in 2009 and have since then decreased, mainly due to an effort by the bank for the new additions to non-performing loans to be of better quality, with broader guarantees on transactions. Inversely provisions for property and other items are visibly on the rise, as a result of the aggravation of the inflated Spanish real estate sector, it is possible to realize the increase in the overall weight of total provisions that correspond to provisions related to property.
Figure 7. Provisions by category Source: Banco Popular’s annual report
The net income has been consistently dropping derived from two particular independent reasons, which have worked negatively to the group’s attributed net income either jointly or individually. The two main reasons are the net interest rate fluctuation and present drop as well as the provisions the bank had to undertake.
177525 407968 601751 737852 0 500000 1000000 1500000 2000000 2500000 2008 2009 2010 2011 Provisions by category
Provions property and others
Provisons financial asset impairment
27
4.4. Solvency
Solvency plays a major role in banks, equity is the buffer against losses and the European banking agency is urging banks to comply with mandatory levels as to mainly improve the quality, consistency and transparency of the capital base and increase the risk coverage. This need stems from the actual economic situation where a greater capacity for loss absorption is crucial given the uncertainty climate.
A key priority for POP has always been the reinforcement of capital without overlooking improvements of its market share, it primes for operational comfort above the minimum levels required by regulatory agencies.
Tier 1 capital ratio is defined by shareholders’ equity plus retained earnings over the bank’s risk weighted assets, RWA are the bank’s assets multiplied by a coefficient that ranges from 0 to 1, being zero a riskless asset and 1 a very risky asset, therefore the greater the bank’s RWA, the greater the equity needed to achieve the EBA demanded ratios.
In order to comply with the mandatory margins Banco Popular works on two fronts, it relies on earnings retention to increase its equity, and also performs an ongoing effort to improve its risk weighted assets’ management by reducing its weight.
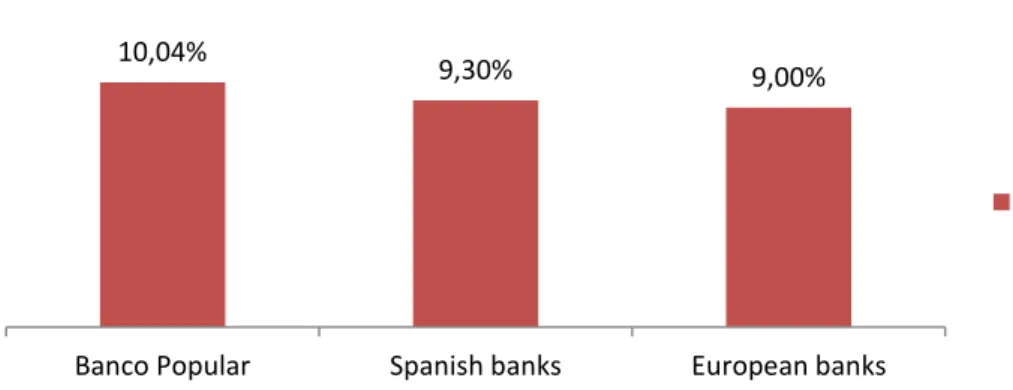
Figure 8. Core capital of different financial institutions (2011) Source: Banco Popular’s annual report
The group stands as one of the most capitalized banks both in Spain and in Europe without the injection of public capital.
10,04%
9,30% 9,00%
Banco Popular Spanish banks European banks
Core Capital 2011
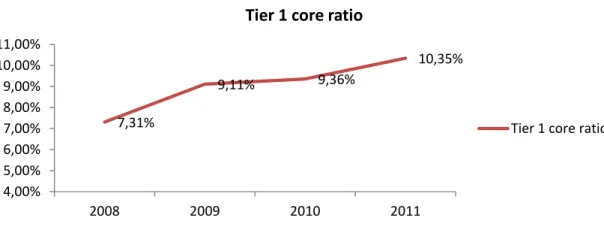
28 Figure 9. Tier core 1 evolution
Source: Banco Popular’s annual report
From the above evolution it is evident the increase in tier 1 core ratio, derived both from the group’s guidelines on capital reinforcement and the EBA’s mandatory requirements
4.5. Efficiency
Figure 10. Efficiency ratio
Source: Banco Popular’s annual report
The efficiency or commonly referred to cost to income ratio has been increasing, meaning that the bank now requires more income as a cost to generate the latter, the operating costs have been somewhat stable throughout the previous years, however
7,31% 9,11% 9,36% 10,35% 4,00% 5,00% 6,00% 7,00% 8,00% 9,00% 10,00% 11,00% 2008 2009 2010 2011
Tier 1 core ratio
Tier 1 core ratio
33% 29% 35% 42% 0% 10% 20% 30% 40% 50% 2008 2009 2010 2011 Efficiency Ratio
29 the operating profit has been decreasing. There are two main reasons for that; the increase in rates, worsened by the mismatch of maturities between the bank’s assets and liabilities, and the impairments of wholesale and retail funding.
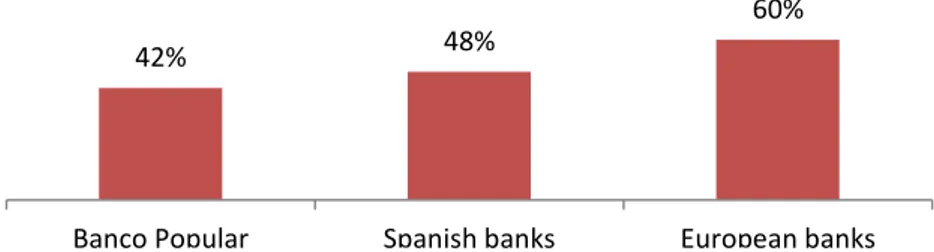
Figure 11. Efficiency ratio of different financial institutions (2011) Source: Banco Popular’s annual report
Notwithstanding the drop in the efficiency ratio, Banco Popular still ranks as one of the most efficient banks when comparing with the average Spanish and European bank. 4.6. Liquidity
(1) Loans: Total Loans to customers (net) – Other credits – Repos – Valuation adjustments of Repos – ICO credit lines - Securitisations; Deposits: Demand deposits + time deposits + other accounts and valuation adjustments + collection accounts (included in other financial liabilities) + commercial paper + Preferred shares
Figure 12. LTD ratio
Source: Banco Popular’s annual report
In order to comply with major guidelines which point out for banks to decrease their LTD ratios so that liquidity can be increased, POP has managed to reduce the
42% 48%
60%
Banco Popular Spanish banks European banks
155% 143% 135% 133% 120% 130% 140% 150% 160% 2008 2009 2010 2011 LTD ratio LTD ratio (1)
30 difference between its loans and deposits (commercial gap), through increase in customer deposits and continued effort to decrease its dependence on the wholesale markets. Currently the group presents a LTD ratio of 1,335, the latter has improved drastically in the recent years which represents the commitment of POP on its deleveraging process.
4.7. Assets’ quality
The non-performing loans of POP have been increasing, in line with the Spanish banking sector, the current economic situation has led both private and corporate entities to increase the default rate on their loans, the levels of doubtful loans over total risk are reaching industry maximums, which in turn sparkles loans provisions increases and ultimately reduces the company’s net income
Figure 1 1. Non-performing loans Source: Banco Popular’s annual report
Regarding the risk weighted assets computed according to BIS requirements, POP has managed to decrease their weight, through “an ongoing effort to improve the management of RWA, by updating accounting processes and thereby reducing transitory balances, and by enhancing the guarantees and management systems for these guarantees” 2,80% 4,81% 5,27% 5,99% 2,80% 5,04% 5,82% 7,51% 2,00% 3,00% 4,00% 5,00% 6,00% 7,00% 8,00% 2008 2009 2010 2011
Non performing loans
Non-performing loans (POP)
Non-performing loans (Avg. Spanish bank)
31 Figure 1 2. Risk weighted assets (€Bn)
Source: Banco Popular’s annual report
92,29 92,33 93,75 88,18 70,00 80,00 90,00 100,00 2008 2009 2010 2011 RWA (€Bn) RWA (€Bn)
32
5. Macroeconomic overview
Spain is the 4th largest economy in Europe and the 12th largest worldwide, it went through an expansionary boom period in the initial 00’s, but currently, much like other peripheral economies in Europe, Spain is struggling with the aftermath of the 2008 crisis, which highlighted the structural weaknesses on its economy
Spain betted on a growth model largely dependent on domestic demand and on construction and property development activities, the disproportionate growth in the real estate sector in conjunction with the increase in credit granted to finance it, led to the current economic imbalances. The actual economic situation is characterized by several interconnected imbalances, the most severe consequences are its current account deficit, which has been increasing at a steady rate, the excessive growth of the real estate sector and finally the indebt ness of its private sector.
As a result of the above referred imbalances, taking into account the worldwide macroeconomic picture and the need for adjustment there has been a strong increase in unemployment in Spain as well a rapid increase in public debt fueled by the successive current account deficits of the Spanish economy.
Figure 13. Spanish unemployment Source: IMF
The unemployment evolution since the beginning of the crisis is staggering. In late 2007 the current unemployment rate stood at 8,3%, which at the time corresponded to 1834000 unemployed, four years fast forward and the unemployment stands at 24%, with an unemployment rate among younger workers (18-25) of around 41%.
8,26% 11,32% 18,01% 20,06% 21,64% 0,00% 5,00% 10,00% 15,00% 20,00% 25,00% 2007 2008 2009 2010 2011 Unemployment Unemployment
33 Comparing with the Eurozone the increase in Spanish unemployment was 12% percentage point superior. Obviously, paired with an increase in unemployment comes higher costs and less revenues to the government, as only ¾ of the active population are contributing with tax revenues.
Another decisive factor is the drop in domestic demand, concerning housing in particular, the investment has decreased by 41%, while Spanish households reduced their savings rate to historical lows, at the same time their fixed capital investments achieved maximum levels.
There are three main reasons for the observed maximum investment in fixed capital. The ECB’s monetary policy which; defined the reference interest rate at very low levels. The Spanish government’s policy that; promoted housing acquisition in detriment of other viable alternatives, such as renting, and encouraged the acquisition of real estate assets instead of other investment assets and finally the advantages linked to a model of economic growth based on construction and property development, ranging from unemployment reduction, as it is a labor intensive activity, increase in housing value and creation of larger tax revenues.
During the pre-crisis expansion period, credit awarded to both the construction and real estate sector grew exponentially, culminating in the year of 2007, when the respective loans accounted for 45% of the then Spanish GDP.
The private debt now represents 2,2x the country’s GDP, this level of indebtedness stemmed from cheap debt that was used for consumption credit and residential investment, inflating the latter. Considering that not all the Spanish private debt is tied up to domestic assets, there are still two thirds of it that are, which, corresponds to an approximate amount of 1,6trillion euros. Most of the respective debt is backed up by the deteriorating real estate sector, which, cast doubts on its repayment. In fact, according to the bank of Spain construction debt represents 400billion euros, of which, 176 are deemed questionable and 31,6 non-performing.
34 The successive downgrades of its public debt and the proximity of its 10y bond to the value of 7%, which prompted bailout requests from Portugal and Greece, has sparkled confidence worries regarding the ability for the Spanish government to single handily recover from the current economic situation.
Notwithstanding its adverse situation, Spain still ranks fairly well regarding its public debt as a percentage of GDP when comparing with other European countries, moreover its GDP appears to have somewhat stabilized and temporarily inversed the decreasing trend.
Measures
In order to counter the current adverse macroeconomic situation the Spanish government has approved in the beginning of 2012 several reforms, ranging from the labor market, to fiscal domain and to public sector management.
Considering the labor market a greater flexibility was given to companies to adapt to the situation of the Spanish economy, being the most significant measures the reduction of dismissal costs, in line with the decrease in the degree of permanent contract workers protection. In addition the Spanish government has signed an agreement with social agents in January 2012 with a 2year duration which, emphasizes wage moderation for the private sector, as well as usage of variable wage components tied up to firm specific variables.
In the fiscal domain a law has been implemented envisioning a constitutional reform of the national fiscal framework, imposing limits to public debt and deficit, it adds stricter information requirements and coercive methods both at a personal and public level in order to guarantee compliance with new fiscal targets.
“The Central Government may initiate all the necessary actions against the Regional Government that fail to comply with the agreed fiscal targets”
In order to finance its economy in the wholesale markets at reasonable prices, Spain needs to recover its economic efficiency and boost.
35
6. Regulation
The economic and financial crisis which began in 2007 severity was mainly attributed to the banking sector excess leverage and erosion of capital base and quality, banks were not able to absorb systemic trading and credit losses. As a consequence of the latter the market’s confidence on the banks’ solvency and liquidity was lost which led to a major contraction of liquidity and credit availability to the real side of the economy. Governments were forced to intervene injecting liquidity, capital support and guarantees to the banking sector at a cost for tax payers.
Taking into account the banking system’s importance and realizing it constitutes the foundation for economic growth; the Basel Committee introduced the Basel accords, being Basel III the framework that currently sets the guidelines for financial intuitions to comply with today.
Basel III aims to strengthen the global capital and liquidity rules in order to promote a more resilient banking sector so that shocks arising from financial and economic stress can be absorbed more efficiently, reducing the risk of contagion from the financial sector to the real economy. Furthermore, it emphasis the improvement of risk management and governance, as well as, strengthen banking sector’s transparency and disclosures.
In order to apply and supervise the necessary measures on 1st of January 2011 the European banking authority (EBA) was established. “The EBA will contribute to ensure a high quality, effective and consistent level of regulation and supervision in its areas of competence. It will also promote public values such as the stability of the financial system, the transparency of markets and financial products, and the protection of depositors and investors”.
Furthermore EBA will also “work to prevent regulatory arbitrage and guarantee a level playing field, strengthen international supervisory coordination, and promote supervisory convergence. It will provide advice to the Union institutions in the areas of banking, payments and e-money regulation and supervision, and related corporate governance, auditing and financial reporting issues”.
36 In light of the current situation, the European banking agency requires for major Spanish banks to raise their core tier 1 to 9% and to value general government debt instruments at market prices, these goals are to be achieved according to EBA until the end-June 2012.
37
7. Spanish banking sector
The Spanish banking sector was composed by two main kind of financial institutions, traditional banks and savings banks “cajas de ahorro”.
Banks have a national presence while cajas, alternatively defined as saving banks, usually have a rural character and have a comprehensive knowledge of its customer, there was reportedly one caja branch for every 1.900 people in Spain.
Caja banking system was virtually unregulated, for instance until very recently cajas were not obligated to reveal their loan to value ratios or the quality of their loans’ collateral, however they assumed a central role in the Spanish banking sector, accounting roughly to 48% of loans granted and about 46% of deposits attracted. These financial institutions, during the expansionary phase have accumulated imbalance of several kinds. They had high risk concentration in activities related with construction and property development, being 41% of the total credit granted referent to acquisition and rehabilitation of housing, and were excessively dependent on wholesale financial markets.
The financial crisis and the latter sovereign debt crisis exposed cajas limitations. Given their individual low impact profile coupled with a somewhat limited capacity to raise capital, being its main source retained earnings; cajas latent flaws were exposed and represented a very delicate situation to the Spanish banking sector. In response to the latter, the Spanish government has decided to launch the FROB (fund for orderly restructuring of the banking sector) later in 2009, which aimed at conducting and overseeing integration processes between institutions (particularly cajas) and recapitalization plans. The Spanish government intention was for a less fragmented banking sector composed of financial institutions with broader choices for capital financing.
So far, as a result of FROB, the number of cajas has decreased drastically from 45 to 2 and cajas have transferred their activities from savings to commercial banking. The integration and optimization of resources is also visible in the number of people currently employed in the banking sector as well as in the number of available branches.
38 Figure 14. Number employees in the banking sector
Source:Bank of Spain Figure 15. Number of branches in the banking sector Source: Bank of Spain
Concerning core capital, the banking sector has significantly increased the capital of the highest quality, in an attempt to calm down the markets and to comply with the European requirements in the short run. A RDL (real decreto de ley) approved in February 2011 has ensured that all Spanish financial institutions are operating with core capital requirements of 8%.
Figure 16. Core capital of Spanish deposit institutions Source: Bank of Spain
In relation to the real estate sector, banks have provisioned since 2008 an amount equal to 112bn, the Spanish government urges Spanish financial institutions to disclose all significant information concerning exposures to construction and property developers, 54% of the latter sector was deemed problematic which sparkled macroeconomic tension and uncertainty. In order to restore confidence and clean-up banks’ balance sheets, Spanish government has increased provisioning needs by 210000 220000 230000 240000 250000 260000 270000 280000
Dec-96 Dec-99 Dec-02 Dec-05 Dec-08 Dec-11
Number of employees 30000 33000 36000 39000 42000 45000 48000
Dec-96 Dec-99 Dec-02 Dec-05 Dec-08 Dec-11
Number of branches 6,50% 9,20% 4,00% 5,00% 6,00% 7,00% 8,00% 9,00% 10,00% 2008 2011
39 38billion euros given the deflationary real estate sector; to address the latter outflows; Spanish government previews core capital requirements of 15.58billion euros.
Figure 17. Provisions by Spanish banks (€) Source: Bank of Spain
Increased provisions and capital add-ons will result in an increase in the levels of coverage of the problematic portfolio referent to the real estate sector.
Figure 18. Problematic coverage (%) Source: Bank of Spain
Given the financial volatility Spanish financial institutions have relied on the ECB’s two 3y LTROs (long term refinancing operation) for some of their financing needs, increasing both the amount borrowed as well as the duration of the maturities. As a
112 112 38,27 15,58 0 50 100 150 200
Since 2008 New measures
Provisions
Capital add-ons new measures Provisions, new measures Provisions since 2008 29 27 31 53 65 80 0 20 40 60 80 100 Total problematic coverage Housing under development Land
Problematic portfolio coverage %
Actual measures New measures
40 result of ECB funding Spanish financial institutions have already covered the total of 2012 wholesale funding maturities and most of its 2013 needs if needed.