doi: 10.3389/fgene.2020.00543
Edited by: L. Joseph Su, University of Arkansas for Medical Sciences, United States Reviewed by: David Lin, Cornell University, United States Mahalingam Govindaraj, International Crops Research Institute for the Semi-Arid Tropics (ICRISAT), India *Correspondence: José Cochicho Ramalho cochichor@mail.telepac.pt Ana I. Ribeiro-Barros aribeiro@isa.ulisboa.pt
Specialty section: This article was submitted to Nutrigenomics, a section of the journal Frontiers in Genetics Received: 15 December 2019 Accepted: 05 May 2020 Published: 07 July 2020 Citation: Roda FA, Marques I, Batista-Santos P, Esquível MG, Ndayiragije A, Lidon FC, Swamy BPM, Ramalho JC and Ribeiro-Barros AI (2020) Rice Biofortification With Zinc and Selenium: A Transcriptomic Approach to Understand Mineral Accumulation in Flag Leaves. Front. Genet. 11:543. doi: 10.3389/fgene.2020.00543
Rice Biofortification With Zinc and
Selenium: A Transcriptomic
Approach to Understand Mineral
Accumulation in Flag Leaves
Faustino Adriano Roda1,2,3, Isabel Marques3, Paula Batista-Santos3,
Maria Glória Esquível3, Alexis Ndayiragije4,5, Fernando Cebola Lidon6,
B. P. Mallikarjuna Swamy4,5, José Cochicho Ramalho3,6* and Ana I. Ribeiro-Barros3,6*
1Ministério de Agricultura e Segurança Alimentar, Instituto de Investigação Agrária de Moçambique, Centro Zonal Noroeste, Lichinga, Mozambique,2Universidade Eduardo Mondlane-Centro de Biotechnologia, Maputo, Mozambique,
3PlantStress&Biodiversity Lab, Forest Research Center (IM, JCR, AIRB) and Linking, Landscape, Environment, Agriculture and Food (PBS, MGE), Instituto Superior de Agronomia, Universidade de Lisboa, Lisbon, Portugal,4International Rice Research Institute, Maputo, Mozambique,5International Rice Research Institute, Laguna, Philippines,6Unidade
de Geobiociências, Geoengenharias e Geotecnologias, Faculdade de Ciências e Tecnologia, Universidade NOVA de Lisboa, Caparica, Portugal
Human malnutrition due to micronutrient deficiencies, particularly with regards to Zinc (Zn) and Selenium (Se), affects millions of people around the world, and the enrichment of staple foods through biofortification has been successfully used to fight hidden hunger. Rice (Oryza sativa L.) is one of the staple foods most consumed in countries with high levels of malnutrition. However, it is poor in micronutrients, which are often removed during grain processing. In this study, we have analyzed the transcriptome of rice flag leaves biofortified with Zn (900 g ha−1), Se (500 g ha−1), and Zn-Se. Flag leaves play an important role in plant photosynthesis and provide sources of metal remobilization for developing grains. A total of 3170 differentially expressed genes (DEGs) were identified. The expression patterns and gene ontology of DEGs varied among the three sets of biofortified plants and were limited to specific metabolic pathways related to micronutrient mobilization and to the specific functions of Zn (i.e., its enzymatic co-factor/coenzyme function in the biosynthesis of nitrogenous compounds, carboxylic acids, organic acids, and amino acids) and Se (vitamin biosynthesis and ion homeostasis). The success of this approach should be followed in future studies to understand how landraces and other cultivars respond to biofortification.
Keywords: biofortification, flag leaves, rice, RNASeq, selenium, transcriptomics, zinc
INTRODUCTION
The 2030 Agenda of the United Nations brings forward 17 Sustainable Developing Goals among which agriculture lies at the core. However, according to the last report of the Food and Agriculture Organization (FAO et al., 2019), more than 820 million people in the world face hunger and undernourishment and, thus, poor health, particularly in Africa where greater efforts should be made to achieve the Zero Hunger by 2030. Undernutrition and
micronutrient deficiencies account for three million deaths each year being more widespread problems than energy consumption (Prentice et al., 2008).
Zinc (Zn) and selenium (Se) are essential mineral nutrients (Fairweather-Tait et al., 2011). However, the intake of these minerals is deficient for ca. 30% (Zn) and 15% (Se) of the world population (White and Broadley,
2011; Moreno et al., 2013). Zn deficiency affects growth
and the immune system, being especially severe for young children and pregnant women (White and Broadley, 2011). Se deficiency also weakens the immune system and has been associated with cardiovascular diseases, cognitive decline, cancer, and AIDS (Rayman, 2002; Jablonska and
Vinceti, 2015). Thus, providing adequate contents of these
minerals in food has become an important objective to fight “hiden hunger” in vulnerable populations (Hirschi, 2009). In this context, a supplementary and diversified diet is the most straight forward strategy to mitigate Zn and Se deficiencies. However, such strategies have been inefficient and uneffective to be implemented in developing countries were livelihoods are strongly dependent on small-scale agriculture (Hartikainen, 2005; Forsman et al., 2014). In order to overcome this constraint, biofortification offers a fast, reliable, and sustainable solution solution which has been successfully achieved in several crops, such as rice, wheat, and beans (White and Broadley, 2009, 2011; Li et al., 2018;
Ramalho et al., 2020).
Rice is one of the world’s most important staple crops
(FAO, 2016), constituting one of the most important sources
of energy and micronutrients for more than half of the world population (Lucca et al., 2006; Muthayya et al., 2014). Both whole and polished rice grains contain low concentrations of Zn (6–28 mg kg−1
) and Se (0.3 mg kg−1
) (Walter
et al., 2008), and agronomic biofortification has been used
to increase these two minerals in the grain (Phattarakul
et al., 2012; Ram et al., 2016; Mangueze et al., 2018;
Lidon et al., 2017, 2019; Ramalho et al., 2020). Rice is
also a model cereal species, and its genome was the first (among crops) to be fully sequenced in 2005 (Sasaki, 2005) and fully unified in 2013 (Kawahara et al., 2013). This crop has been thoroughly used to investigate the molecular mechanisms underlying several biological processes related to plant development, metabolism, and senescence from seedlings to grains (Jackson, 2016; Qian et al., 2018; Wang et al., 2018). The role of flag leaves in photosynthesis and nutrient mobilization to the grains has been highlighted by several earlier reports (Zhou et al., 2007; Pang et al., 2009; Sperotto
et al., 2009; Tari et al., 2009; Xu et al., 2011). Thus,
the identification of the molecular mechanisms involved in mineral transport from flag leaves to grains is of utmost importance to understand the biochemical processes associated with the absorption, translocation, and fixation of minerals, such as Zn and Se.
High−throughput Omics technologies such as genomics, transcriptomics, proteomics, metabolomics, lipidomics, or interactomics are nowadays widely used to understand biological systems as a whole (Sauer et al., 2007). Such extensive and
integrated approaches allowed great advances in plant research, namely the elucidation of biological processes, such as plant development, plant-environment interactions, genomics-assisted breeding, or the discovery of phytocompounds with application in agriculture, medicine, and in a wide range of industries (Kole et al., 2015; Sundell et al., 2015;
Bode et al., 2016; Nützman et al., 2016). Transcriptome
analysis of rice flag leaves confirmed their importance in grain filling, namely, in the biosynthesis and translocation of photoassimilates and minerals to the seeds (Narayanan et al., 2007;Sperotto et al., 2009).
In this study, we have analyzed the transcriptional changes in flag leaves associated with the agronomic biofortification of rice with Zn and/or Se using a next-generation RNAseq approach that uses a high yield cultivar that is able to accumulate high levels of Zn and Se when exposed to biofortification treatments through foliar spraying (Mangueze et al., 2018).
MATERIALS AND METHODS
Plant Material and Biofortification
Experiments
Experiments were performed in the experimental fields of the International Rice Research Institute (IRRI), located at the Umbeluzi—Instituto de Investigação Agrária de Moçambique (IIAM) in Boane, Mozambique (Lat 26◦
30 3.7500 S; Long 32◦ 210 56.4800
E; Alt 8.8 m), using one rice cultivar, Makassane, containg 9.8 mg Kg−1
Zn and 0 mg Kg−1
Se in whole grains, under control conditions (that is, without any biofortification treatment with Zn or Se) (Mangueze et al., 2018). For the trials, three blocks of 95 m2 (15 × 5) each containing three biological replicates were established. Biofortification experiments were performed through single and combined foliar spraying of Zn and Se, using a back sprayer, at the beginning of grain filling, corresponding to Z51 stage in the Zadoks scale, i.e., at an adequate stage to promote the translocation to the grain (Cakmak, 2008;Cakmak et al., 2010). The following doses were applied: (i) 900 g ha−1
Zn (applied as zinc sulfate – ZnSO4 7H2O), (ii) 500 g ha−1Se (applied as sodium selenite – Na2O3Se), and (iii) 900 g ha−1Zn together with- 500 g ha−1Se. The Zn and Se doses as well as the use of Se-selenite (instead of Se-selenate) were based on previous reports in rice byPhattarakul et al. (2012),
Lidon et al. (2019), and, especially,Mangueze et al. (2018), which used the same cultivars and cropped area. Each element was applied twice (using the same volume of the solution), with an interval of 7 days to reach the desired concentration. Control plants received only water.
The basal field fertilization was carried out with NPK (12:24:12) using 100 kg ha−1
26 and 60 days after sowing. Foliar fertilization was made using 50 kg ha−1of NPK (12:24:12) plus 50 kg ha−1 urea (46%) with a total of 200 kg ha−1 for the two applications.
For RNAseq analysis, flag leaves from three different plants per treatment were harvested 15 days after spraying, stored immediately in RNA Latter (Thermo Fisher Scientific), and frozen once in the lab.
RNA Whole Transcriptome Deep
Sequencing
Total RNA was extracted from 100 mg frozen material of each biological replicate per treatment using the inuPREP extraction Kit (Analytik Jena AG) following the manufacturer’s instructions. RNA integrity and purity were first evaluated by visual inspection of RNA bands through electrophoresis in a 1.5% agarose–TBE gel containing GelRed Nucleic Acid Gel Stain (Biotium) and then by an Agilent 2100 Bioanalyzer (Agilent). All samples had an RNA integrity number (RIN) higher than 8.9. Library preparation was performed with the TruSeq RNA Sample Prep Kit v2 (Illumina) and RNA-Seq analyzes by Illumina NovaSeq 6000 of 2 × 100 bp pair-end reads (30 million reads per sample) at Macrogen (South Korea).
Alignment and Analysis of Illumina Reads
Raw reads obtained by sequencing were quality-checked using FastQC version 0.11.5 (Andrews, 2010). To reduce biases, artifacts as low-quality reads, adaptor sequences, or contaminant DNA were removed using Trimmomatic version 0.32 (Bolger
et al., 2014). HISAT2 version 2.0.5 was used for the mapping
of high-quality filtered reads against the reference genome (Os-Nipponbare-Reference-IRGSP-1.0) downloaded from the Rice Genome Annotation Project Database1(Kawahara et al., 2013). Known genes and transcripts were assembled with StringTie version 1.3.3b (Pertea et al., 2015, 2016) based on the reference genome model. After assembly, the abundance of gene transcripts was calculated for each sample and normalized as FPKM (Fragments per Kilobase of transcript per Million Mapped reads) using Cufflinks version 2.2.1 (Trapnell et al., 2010). The similarity between samples was obtained through Pearson’s coefficient of the Log2(FPKM+1) value with a range of −1 ≤ r ≤ 1 (the closer the value is to 1, the more similar the samples are) and graphically depicted using a correlation matrix.
Differentially Expressed Gene Analysis
During data preprocessing, low quality transcripts were filtered. Afterward, log2 transformation of FPKM+1 and quantile normalization were performed. To identify the differentially expressed genes (DEGs) from the dataset, an FDR adjusted P-value of <0.05 was set and a fold change (FC) of ≥2 was assigned. For significant lists, a hierarchical clustering analysis was performed to group the similarity of transcripts and samples by expression level of normalized values. Standardized expression patterns were visualized as Z-scores in a heatmap generated by hierarchical clustering (function hclust in R). The significant DEGs found were mapped on the 12 chromosomes of rice using the chromosome map tool in Oryzabase database (Yamazaki et al., 2010), and a map was drawn based on output generated. FollowingRaza et al. (2019), all DEGs with a gene ontology (GO) function related to cation ion binding/transport, heme binding, Se, Zn ion binding/transport, metal ion binding, transport, and homeostasis were filtered and considered as putative candidate genes (CGs) associated with traits of interest in biofortification. 1http://rice.plantbiology.msu.edu/
Functional Annotation, Enrichment and
Pathway Analysis
To assign functional categories to the DEGs, a gene-set enrichment analysis was performed using the DAVID 6.7 database for annotation, visualization, and integrated discovery, an online tool for the analysis of the relevant biological annotation of gene lists2. The significant DEGs were annotated for GO terms and categorized into biological process (BP), molecular function (MF), and cellular component (CC). For significant DEGs, a gene enrichment test was then performed using the DAVID default background, representing the corresponding genes with at least one annotation in the analyzing categories in the enrichment calculation.P-value for enrichment was calculated for each GO term represented and corrected via Bonferroni family-wise error rate (FWER) method. Only the GO terms exhibiting a correctedP-value of<0.05 were considered to be significantly enriched for a given set of genes. To investigate which DEGs were activated or suppressed in different class of pathways, gene expression information was mapped using the Kyoto Encyclopedia of Genes and Genomes, KEGG3. Pathway images were generated using the online tool KEGG Mapper-Colour Pathway4. Raw and processed RNA-sequencing data have been deposited in NCBI.
RESULTS
Overall Transcriptome Profiling and
Mapping Statistics
In total, the 24 RNA libraries generated an average of 38 million reads with a GC content of 53.28% (Table 1). An average of 1.64% of the reads were removed after being trimmed. The vast majority (98.36%) of the total number of reads was mapped to the reference rice genome demonstrating a high coverage over the transcriptome. From these, an additional average of 7.55% reads could not be mapped into the reference genome. Statistics of each sample are provided in detail in Supplementary Table S1. After trimming and cleaning, a total of 34 million reads were analyzed. A high similarity was found between samples through Pearson’s coefficient of the Log2(FPKM+1) value (Figure 1).
Differentially Expressed Genes
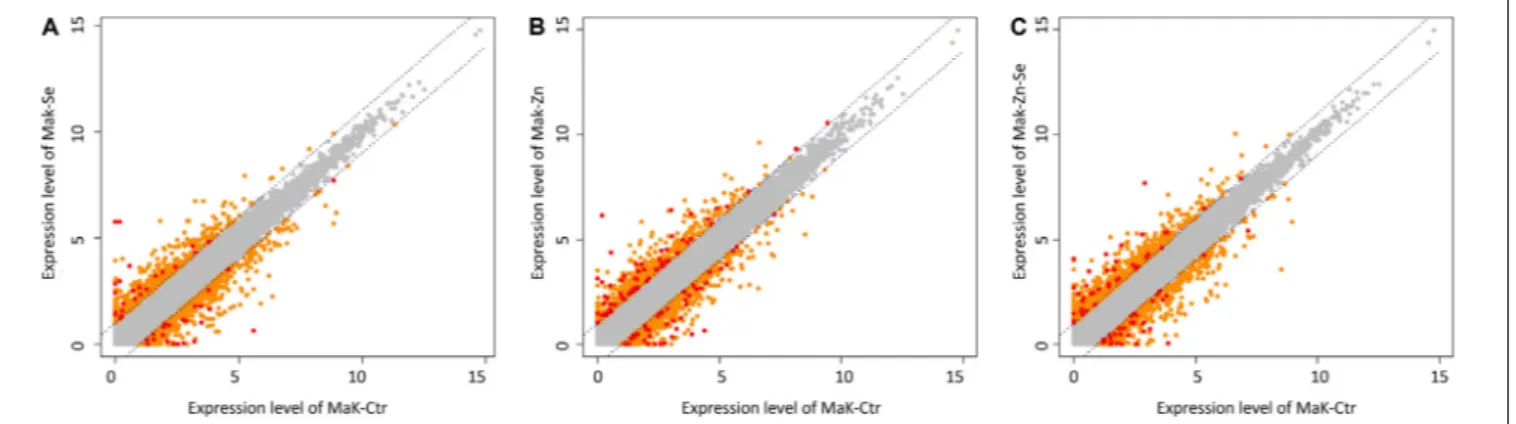
We identified 3170 genes that were differentially expressed between biofortified and control plants, of which only 224 were significantly different (FDR < 0.05) and had a FC ≥2 (Figure 2). Hierarchical clustering analysis of all DEGs showed no specific trends in expression convergence (Figure 3), suggesting that biofortification with Se, Zn, and Se-Zn led to different changes in DEGs.
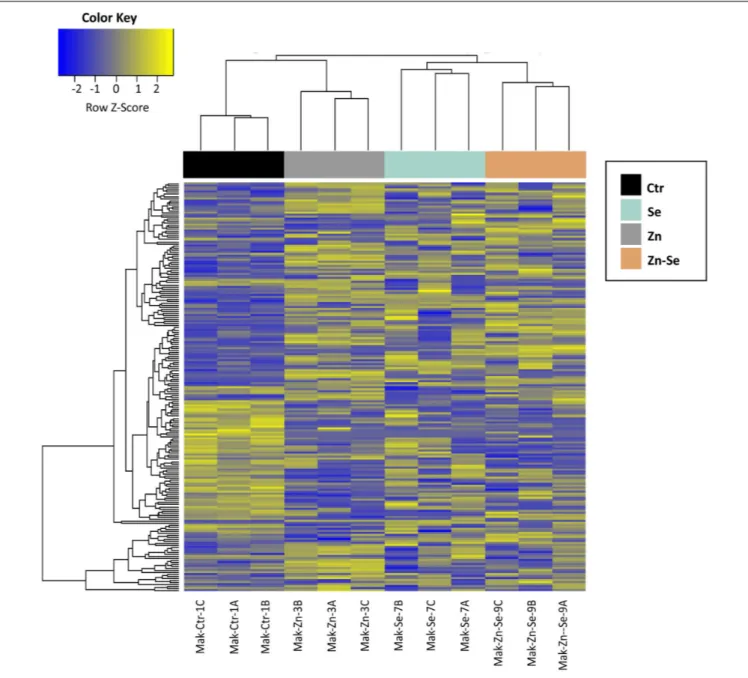
Biofortification with Zn alone triggered a higher number of DEGs (106) than in combination with Se (72) and even less when only Se was used (46) (Figure 4A). DEGs were usually 2https://david.ncifcrf.gov/home.jsp
3http://www.genome.jp/kegg/
TABLE 1 | Overview of RNA-Seq data of rice cultivar Makassane (Mak) in control conditions (Ctr) and under different treatments of Selenium (Se500: 500 g ha−1) and
Zinc (Zn900: 900 g ha−1) or with these two elements together (Zn-Se).
Genotype Setup Total reads GC (%) Processed Mapped Unmapped
Mak Ctr 36,821,836 54.03 36,205,938 (98.32%) 33,869,031 (93.55%) 2,336,906 (6.45%)
Mak Se500 34,451,820 52.81 33,907,595 (98.42%) 30,784,505 (90.79%) 3,123,090 (9.21%)
Mak Zn900 39,822,173 52.91 39,162,976 (98.36%) 36,396,575 (92.94%) 2,766,401 (7.06%)
Mak Zn-Se 41,069,693 53.35 40,394,978 (98.42%) 37,382,433 (92.54%) 3,012,544 (7.46%)
Average 38,041,381 53.28 37,417,872 (98.36%) 34,508,136 (92.45%) 2,809,735 (7.55%)
Numbers indicate the average of the three biological replicates concerning the total number of reads after trimming (total reads), GC content (GC%), number of cleaned reads after trimming (processed), number of reads mapped to the reference (mapped), and number of reads that failed to aligned (unmapped). Statistics of each sample are provided in detail in Supplementary Table S1.
FIGURE 1 | Correlation matrix for all samples obtained through Pearson’s coefficient of the Log2(FPKM+1) value. The closer the value is to 1, the more similar the samples are.
upregulated in the Zn-biofortified and the Zn-Se-biofortified pool (61 and 54%, respectively), while Se-biofortified flag-leaves expressed an equal number of up- and downregulated DEGs (23%) (Figure 4B and Supplementary Tables S2–S4).
The type of DEGs and the level of FC also varied between the three biofortified pools. For instance, distribution trends in terms of FC ranged fromca. −10 to 54 for DEGs in the Se-biofortified pool (Supplementary Table S2). Two genes were found to be highly enriched with FC 4–5 times higher than for the remaining genes: ataxin-2 C-terminal region family protein (Os03g0180300) and a CBL-interacting protein kinase 16 (Os09g0418000).
Meanwhile, GFA2 (Os06g0116800) and a hypothetical protein (Os03g0180300) were the top downregulated genes. From those 46 genes, 7 were putative CGs associated with traits of interest in Se-biofortification: Biotin synthase (Os08g0540100), Similar to inducible alpha-dioxygenase (Os12g0448900), Queuine tRNA-ribosyltransferase (Os09g0469900), Thiazole biosynthetic enzyme 1−1 (Os07g0529600), Cytochrome P450 (Os02g0221900), Zinc finger (Os01g0667700), and Protein phosphatase 2C domain (Os05g0358500).
In comparison, FC of DEGs from flag leaves of Zn-biofortified plants varied between ca. −13 to 61
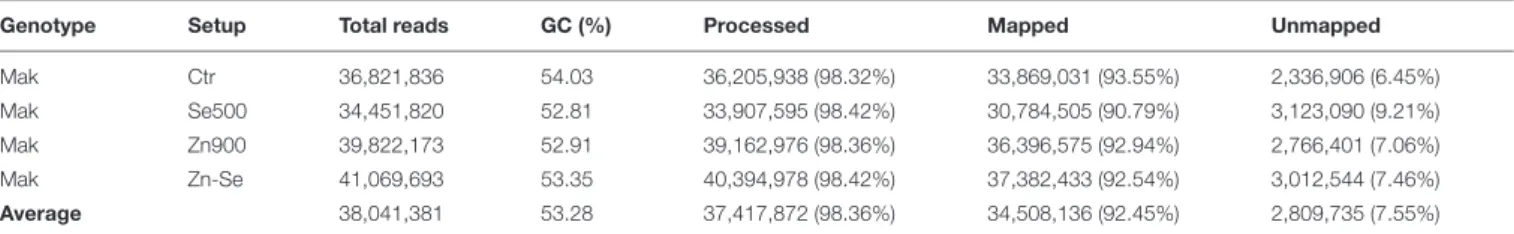
FIGURE 2 | Scatter plots of expression levels between control and the average normalized value of the Zn-biofortified pool (A) between control and Se-biofortified pool (B) and between control and Zn-Se-biofortified pool (C). Transcripts levels significantly above control levels are upregulated in response to biofortification while those below control levels are downregulated. Each plot contains all identified transcripts, including non-significant (gray dots) as well as specific DEGs that are considered significant under |FC| ≥ 2 (orange dots) and under |FC| ≥ 2 and P< 0.05 (red dots).
(Supplementary Table S3). Top downregulated included a Resistance protein candidate (Os05g0318700) and a Photosystem I protein-like (Os07g0148900) encoding genes, while a 2-oxoglutarate dehydrogenase E2 subunit gene (Os04g0394200) was found to be highly upregulated, with an FC six times higher than the remaining DEGs. From those 106 genes, eight were considered putative CGs associated with traits of interest in Zn-biofortification: NifU-like protein (Os01g0662600), WD-40 repeat containing protein (Os02g0791800), Laccase-6 (Os01g0850550), Ribose-phosphate pyrophosphokinase 3 (Os01g0723600), C-type lectin domain (Os01g0104000), Homodimeric diiron-carboxylate protein (Os04g0600300), Queuine tRNA-ribosyltransferase (Os09g0469900), and Cytochrome P450 (Os02g0173100).
In the set of plants biofortified with the two elements (Zn-Se), FC of DEGs varied between ca. -13 to 27 (Supplementary
Table S4). A DRE binding protein 2 (Os01g0733801)
was found to be the top downregulated gene, while a cystathionine gamma-synthase (CGS) (Os03g0376100) and an UDP-glucuronosyl/UDP-glucosyltransferase (UGT) family protein genes (Os01g0736100) were the top upregulated genes under Zn-Se biofortification. From those 72 genes, eight could be CGs associated with traits of interest in Zn-biofortification: Adaptin ear-binding coat-associated protein 2 (Os10g0476000), Endoribonuclease Dicer homolog 2a (Os03g0583900), Thioredoxin family Trp26 (Os01g0559000), Cytochrome family protein (Os11g0151400), Syntaxin 6 (Os08g0244100), Cytochrome P450 (Os02g0173100), Queuine tRNA-ribosyltransferase (Os09g0469900), and Secretory carrier membrane protein (Os04g0597000). Interestingly, one gene (Os03g0103300) from the Se-Zn biofortified pool was a quantitative trait loci (QLT) G-3-1 protein, targeted for low-temperature germinability (Supplementary Table S4).
Only six DEGs were shared between the three biofortified pools: Eukaryotic initiation factors 3 (Os04g0112300) and 4 (Os04g0112300), Cytochrome P450 (Os02g0173100 and Os02g0221900), UDP-glucuronosyl/UGT (Os01g0736100), and Queuine tRNA-ribosyltransferase (Os09g0469900). Additionally,
an Ethylene response factor 2 gene (Os07g0617000) and two Hypothetical proteins (Os01g0358300 and Os07g0536966) were commonly upregulated in the Zn- and in the Se-biofortified pool (Supplementary Tables S2, S3). Genes encoding a Prolin-rich protein (Os04g0612500) and a Chitinase-like protein (Os09g0494200) (both downregulated) were found to be commonly expressed between the Zn- and the Zn-Se- biofortified pool (Figure 4B and Supplementary Tables S3, S4).
DEGs were unevenly distributed among the 12 rice chromosomes being predominant on chromosome 1 (with 32 DEGs), chromosome 3 (with 23 DEGs), and chromosome 4 (with 22 DEGs; Supplementary Figure S1). Few DEGs could be mapped on chromosomes 11 (3 DEGs, none from Se-biofortification) and 10 (5 DEGs) and on chromosome 12 (7 DEGs). DEGs from biofortification with Se, Zn, and Se-Zn were predominantly mapped on chromosome 1 (7 DEGs), chromosomes 1 and 4 (13 DEGs), and chromosome 1 (10 DEGs), respectively.
Gene Ontology Annotation of DEGs
Gene ontology categories from the list of significant DEGs were overall upregulated (although at different levels) except for “metal ion binding” in the Zn-biofortified pool (Figure 5). GO categories also showed opposite profiles in the three biofortified pools, which corroborates the differential gene regulations (Figure 5). BP such as “vitamin metabolic process” and “vitamin biosynthetic process” were enriched in the Se-biofortified pool while “nitrogen compound biosynthetic process,” “carboxylic acid biosynthetic process,” “organic acid biosynthetic process,” “cellular amino acid biosynthetic process,” and “chitin metabolic process” were the in the Zn-biofortified pool. In contrast, BP categories such as “carbohydrate catabolic process,” “lipid localization,” and “lipid transport” were enriched after Zn-Se biofortification. MF such as “cation binding,” “ion binding,” and “transition metal ion binding” were enriched after Se-biofortification. Categories as “metal ion binding,” “cofactor binding,” and “coenzyme binding” were enriched after Zn-biofortification, the two latter categories also enriched after biofortification with the two
FIGURE 3 | Heatmap of rice cultivar Mak differentially expressed genes after biofortification with single and combined Zn and Se and application. Expression values are depicted as Z-standardized scores for each DEG, where blue represents downregulated DEGs and yellow upregulated DEGs.
elements together (Figure 5). Cellular components (CC) such as “cytoplasmic membrane-bounded vesicle,” “cytoplasmic vesicle,” and “ubiquitin ligase complex” were only enriched after Zn-Se biofortification (Figure 5).
Effect of Biofortification on Biological
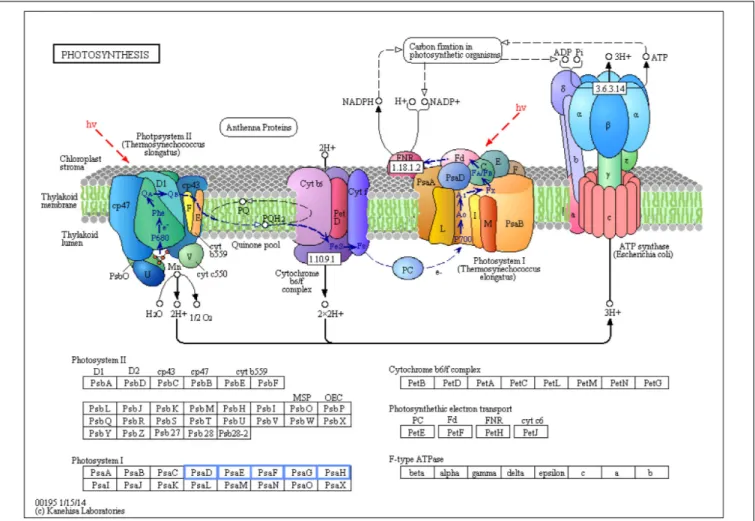
Pathways
Photosynthesis was the only biological pathway involving downregulation of gene expression and only in the biofortification with Zn. Five different genes, all involving Photosystem I (PsaD, PsaE, PsaF, PsaG, and PsaH), were significantly downregulated after Zn-biofortification
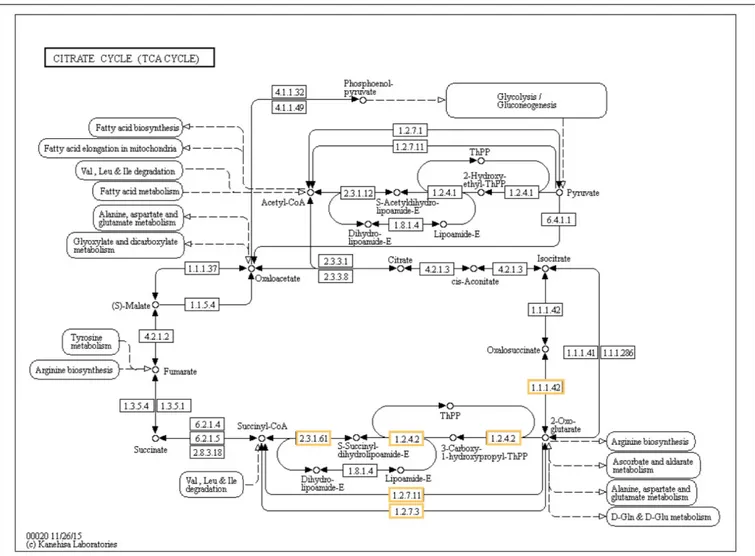
(P < 0.01; Figure 6). By contrast, four different biological pathways involving upregulated DEGs were significantly enriched after biofortification: the citrate cycle (TCA
cycle) from the carbohydrate metabolism and the
RNA degradation pathway (respectively, P < 0.001 and P < 0.05), while the vitamin metabolic pathway involving the production of thiamine and biotin were enriched after Se-biofortification (P < 0.01 in both pathways; Figure 7).
Six different upregulated genes were found to be enriched in the tricarboxylic acid (TCA) cycle: one isocitrate dehydrogenase (1.1.1.42), two 2-oxoglutarate dehydrogenase E1 component (1.2.4.2), 2-oxoglutarate dehydrogenase E1 component (2.3.1.61),
FIGURE 4 | Total number of differentially expressed genes (DEGs). Common DEGs between comparisons are indicated between brackets (A). Up- and downregulated DEGs between comparisons with | FC| ≥ 2 and p< 0.05 (B). Comparisons indicate the number of DEGs found in biofortified flag-leaves with Se, Zn, or Zn-Se in comparison with control conditions. Colors of the biofortified pools are the same as in Figure 3.
FIGURE 5 | Gene ontology enrichment analysis of biological processes (BP), molecular function (MF), and cellular component (CC) for up- and downregulated genes between biofortified flag leaves with single and combined Zn and Se and application in comparison with control conditions. The percentage of upregulated DEGs found within each category is indicated between brackets.
and two 2-oxoglutarate/2-oxoacid ferredoxin oxidoreductase subunit alpha (1.2.7.11 and 1.2.7.3; Figure 8). Three genes associated with the pathway of RNA degradation were also found after biofortification with Zn: ATP-dependent RNA helicase DDX6/DHH1 (DDX6), enhancer of mRNA-decapping protein 3 (EDC3), and enhancer of mRNA-decapping protein 4 (EDC4) (Supplementary Figure S2). In comparison,
the thiamine metabolism pathway was enriched after Se-biofortification involving the upregulation of nucleoside-triphosphatase (3.6.1.15), thiamine-monophosphate kinase (2.7.4.16), and adenylate kinase (2.7.4.3), while the biotin metabolism pathway was enriched after Se-biofortification directly through the upregulation of biotin synthase (2.8.1.6) (Supplementary Figure S3).
FIGURE 6 | Significant differentially expressed genes (DEGs) involved in photosynthesis of Zn-biofortified rice cultivar Mak (P< 0.01). Genes significantly downregulated by Zn-biofortification are shown in blue boxes. White boxes indicate non-responsive genes.
FIGURE 7 | Heatmap showing significant KEGG pathways involving upregulated DEGs after Se and Zn biofortification. Colors indicate the level of significance.
DISCUSSION
Rice is both a model plant species and one of the most important staple foods worldwide. It is, however, a poor source of micronutrients, such as Zn and Se, whose deficiency has
several impacts on human health and child growth, particularly in developing countries. To compensate nutrient-poor staples, genetic and agronomic biofortification strategies have been widely used to fight hidden hunger (Kondwakwenda et al., 2018; Neeraja et al., 2018; Hefferon, 2019; Zhou et al., 2019).
FIGURE 8 | Significant differentially expressed genes (DEGs) involved in the TCA cycle of Zn-biofortified rice cultivar Mak (P< 0.001). Genes significantly upregulated by Zn biofortification are shown in yellow boxes. White boxes indicate non-responsive genes.
While genetic biofortification approaches are powerful tools for cereals (including rice) biofortification, the extended time frame and resources needed for conventional breeding as well as the economic, ethic, and legal issues associated with genetically modified crops are among the main limiting factors, and, in both cases, mineral availability is largely dependent on the soil properties (Cakmak, 2008). On the other hand, agronomic biofortification constitute a useful and reliable short-term strategy, complementary to conventional breeding (Cakmak, 2008;White and Broadley, 2009, 2011;Ramalho et al., 2020).
However, the transcriptional basis of the biofortification process at the leaf level is still poorly understood (Sperotto et al., 2013; Neeraja et al., 2018; Tang et al., 2018). In this context, we have analyzed the transcriptome of rice flag leaves to gain insight about their contribution to mineral mobilization to grains. For that we have used a rice cultivar (Makassane) with high-yield (6–7 tonnes per hectare), high grain quality, and resistance to the two major rice diseases (bacterial leaf blight and blast) that has been bred by the IRRI and adapted to the irrigated agro-ecological conditions of Mozambique, Southern
Africa (Singh et al., 2013), that have a good perspective for future commercialization. Although a certain degree of Zn-Se antagonism has been referred in some rice cultivars, in this specific genotype co-application of Zn and Se did not interfere with Zn accumulation while also promoting Se accumulation in grains (Mangueze et al., 2018).
Transcriptome analysis of flag leaves from rice plants biofortified with Zinc (Zn; 900 g Zn ha−1
), Selenium (Se; 500 g Se ha−1
), and both minerals (Zn-Se; 900 g Zn ha−1
and 500 g Se ha−1) identified a total of 34 million reads, which is in line with the results obtained from other transcriptome studies on biofortified rice (Neeraja et al., 2018), wheat (Mishra et al., 2019), and maize (Yi et al., 2019). The number of DEGs wasca. 3000, which is also in agreement with other transcriptome projects in rice, where ca. 1000–3000 DEGs have been reported (e.g.,
Li et al., 2018; Cao et al., 2019; Chen et al., 2019; Sun et al., 2019). The response of the rice transcriptome is quite variable, depending on the organ, cultivar, and environmental conditions. For instance, in panicles of two Indian landraces (Chittimutyalu, CTT and Kala Jeera Joha, KJJ) and one improved variety (BPT
5204), with differential ability to uptake zinc, the total number of DEGs varied fromca. 1400 (BPT 5204) to ca. 2200 in CTT and KJJ, of whichca. 450–800 with significant FC (Neeraja et al., 2018). On the other hand, in roots of a Chinese rice cultivar (Nipponbare) subjected to Cadmium (Cd) stress ca. 1200 DEGs were identified, 226 with significant FC at low and 1162 at high Cd concentrations, 10 µM and 100 µM, respectively (He et al., 2015). In our study, the rice biofortification of cultivar Makassane triggered a relatively low number of DEGs (224) with significant FC. Such a low number might be anchored in the following arguments: (i) molecular changes associated with the biofortification processes are narrow and limited to specific pathways; and/or (ii) slight (statistically non-significant) changes in gene expression are enough to trigger the pathways involved in mineral absorption and translocation; and/or (iii) post-transcriptionally regulated events.
The number of significant DEGs was higher in flag leaves of biofortified plants (106) than those from Se- and Zn-Se-biofortified plants (72 and 46, respectively) (Figure 4). Differences in DEGs were extensive to FC (−10 to 54 for Se, −13 to 61 for Zn, and −13 to 27 for Zn-Se) as well as to the gene classes (Supplementary Tables S2–S4). These differences are in line with the reported variation of the rice transcriptome referred above (He et al., 2015;Neeraja et al., 2018) and might be also related to the fact the mineral concentrations used for spraying were higher for Zn than for Se, triggering greater changes related to more demanding changes during Zn accumulation.
Gene ontology analysis of DEGs showed also different profiles of the three sets of biofortified samples, corroborating the expression patterns of the individual set of DEGs (Figure 5). Thus, while, in the case of Se biofortification, vitamin biosynthesis and metabolism were among the main BP, in the case of Zn, the main BP included biosynthesis of nitrogen compounds, carboxylic acids, organic acids, amino acids, as well as chitin metabolism. Additionally, in the case of the combined Zn and Se application, the BP associated with carbohydrate metabolism and lipid dynamics were also enriched. Such distinct GO profiles are likely related to the specific roles of Se and Zn in plant functioning as well as with specificities of Zn and Se biofortification processes, even considering a certain antagonism extent between these two minerals as regards their accumulation potential (Boldrin et al., 2012; Mangueze et al., 2018). This hypothesis is supported by the classification based on the MF, i.e., ion homeostasis in Se-biofortified flag leaves, probably related to the role of this mineral in controlling oxidative stress, the coenzyme/cofactor function of Zn in Zn-biofortified flag leaves, and a rather diverse set of GOs in the double biofortified flag leaves (Sunde, 2018). Nevertheless, the three biofortification processes have in common alterations in cell metabolism inherent of the mineral mobilization and their specific cellular functions (Garg et al., 2018).
Among the top DEGs, two genes encoding an ataxin-2 and a CBL (Calcineurin B-like)-interacting protein kinase (CIPK) were the most abundant in Se-biofortified flag leaves. Ataxin-2 is a CID (CTC-interacting domains) protein highly conserved among eukaryotes (Jiménez-López and Guzmán, 2014). Although the functional characterization of ataxins in plants has not yet
been fully addressed, key and evolutionary conserved roles of this group of proteins have been proposed, namely, in post-transcriptional regulatory assembly in many biological processes, including, growth, development, and environmental responses (Jiménez-López et al., 2015;Ostrowski et al., 2017). Thus, it is possible that Se-biofortification in rice is highly regulated post-transcriptionally through Ataxin-2, explaining the low number of DEGs identified in this pool of samples. On the other hand, the activation of the plant-specific CBL-CIPK complex is likely related to the induction of a plant stress signaling cascade (Ligaba-Osena et al., 2017;Zhang et al., 2018;Aslam et al., 2019;
Liu et al., 2019) necessary to mobilize Se. In fact, although its role in plants remains controversial, Se is known to act in mechanisms of plant protection against a variety of abiotic stresses, such as cold, drought, desiccation, and metal stress (Gupta and Gupta, 2017). Furthermore, several studies have also found that CBL-CIPK pathways work as regulators in nutrient transport systems, namely, Na+
(Shi et al., 2002), K+
(Xu et al., 2006), Mg2+(Tang
et al., 2015), and NO3−(Ho et al., 2009).
With Se biofortification, the induction of vitamin metabolic pathways related to the production of the thiamine and biotin were enriched (Figure 7), the first involving the transcriptional activation of genes encoding a nucleoside-triphosphatase, a thiamine-monophosphate kinase, and an adenylate kinase and the second the upregulation of a biotin synthase (Supplementary
Figure S3). Consequently, biofortification with Se might reinforce thiamine presence in rice, which is usually very poor, ranging from 0.053 to 3 mg per 100 g of grain. These values become even lower with the elimination of the aleurone layer (where thiamine is predominantly stored) in polished rice as well in cooked rice (Minhas et al., 2018).
With regards to the flag leaves from Zn-biofortified plants, the most abundant transcript corresponded to a gene enconding a 2-oxoglutarate (2-OG) dehydrogenase (2-ODD), the largest family of non-heme oxidizing enzymes (Kawai et al., 2014), with a key function in the TCA cycle that uses 2-OG as an obligatory substrate (Scheible et al., 2000). This will link the TCA cycle (and thus ATP production) to amino acid, glucosinolate, flavonoid, alkaloid, and gibberellin biosynthesis (Araújo et al., 2014). Taking into account the wide Zn roles in plants, which include the composition of proteins and other macromolecules, its action as a functional, structural, or regulatory cofactor of a large number of enzymes, and its role in gene expression control (Brown et al., 1993), the huge activation of 2-ODD might be related to the enhanced cell metabolic activity induced by Zn biofortification. Such large accumulation of 2-ODD transcripts is also in line with the GO analysis and its involvement in several biosynthetic pathways (Araújo et al., 2014; Farrow and Facchini, 2014;
Wang et al., 2019).
In line with the GO analysis and with the proposed roles for Zn in plant cells, the analysis of the impact of Zn biofortification in biological pathways confirms the relation with the TCA cycle and carbohydrate metabolism but also with RNA degradation, highlighting its role in cell metabolism and control of gene expression (Brown et al., 1993). The genes encoding enzymes from the TCA cycle included an isocitrate
dehydrogenase, three oxoglutarate dehydrogenases, and two 2-oxoglutarate/2-oxoacid ferredoxin oxidoreductases involved in plant defense against stress (Araújo et al., 2014;Yu et al., 2018). The genes associated with RNA degradation included an ATP-dependent RNA helicase (DDX6), and two enhancers of mRNA-decapping proteins 3 and 4 (EDC3 and EDC4), factors regulating mRNA turnover in plants probably involved in developmental processes (Goeres et al., 2007) as well as in stress responses (Kawa and Testerink, 2017).
On the other hand, a Photosystem I (PSI) gene was among the top downregulated DEGs. A deeper analysis of biological pathways indicates that Zn biofortification resulted in a downregulation of several photosynthesis-related genes, namely, those related with PSI (PsaD, PsaE, PsaF, PsaG, and PsaH; Figure 6). Nevertheless, this downregulation of PSI related genes is likely linked to metabolic adjustments needed for Zn mobilization, since in our experiments Zn biofortification did not negatively affect plant growth and yield (our lab, unpublished data), and because a positive impact on photosynthesis has been frequently reported in Zn fertilized/biofortified cereals (e.g.,
Lidon et al., 2015, 2017;Liu et al., 2016;Chattha et al., 2017). This is in agreement with the fact that most Zn is taken up by active transport and that the energy demanded by this process is largely supported by photosynthesis (Nakandalage et al., 2016).
In double biofortified plants (Zn and Se), genes enconding a CGS and an UDP-glucuronosyl/UGT were transcriptionally activated. These genes are usually involved in amino acid (methionine) (Zhao et al., 2018) and flavonoid (Yin et al., 2017) biosynthesis, suggesting the activation of these two pathways during double biofortification conditions. CGS is specifically associated with perturbation of the folates pool that serve as donors and acceptors in one-carbon (C1) transfer reactions, which are essential in major metabolic pathways, such as amino acids, nucleic acids, and vitamin B5 (Loizeau et al., 2017). Crops that are able to de novo synthesize folates serve as an excellent dietary source, which is not the case of most staple crops, such as rice, potato, and maize (Gorelova et al., 2017). Thus, biofortification with Zn-Se could have a positive impact regarding the enhancement of folate content, further improving the nutritional value of rice, a result that should be tackled in future studies. One DEG (Os03g0103300) from the Se-Zn biofortification was a QLTG-3-1 protein targeted for low-temperature germinability detected on chromosome 3 (Supplementary Table S4), emphasizing the importance of this gene for further molecular characterization of biofortification traits. Improvement of cold tolerance at the germination stage is a major determinant for rice cultivation in tropical or subtropical areas causing severe reductions in the final yield and in crop productivity (Jiang et al., 2017). Further identification of major QTLs associated with the molecular basis of micronutrient uptake/homeostasis (Swamy et al., 2016;
Raza et al., 2019) will facilitate the identification of genes of interest and its exploration for breeding Se and Zn rich rice varieties. Six common DEGs were shared between the three biofortified pools, interestingly with similar FC trends in Se and Zn biofortified flag leaves and opposite expression patterns in the Zn-Se pool (Supplementary Tables S2–S4).
Among them, eukaryotic initiation factor (eIEF) 3 and eIEF 4 were, respectively, down- and upregulated in the Se (FC −6.528 and 6.860) and Zn (FC −6.452 and 6.813) set, and up- and downregulated in the Zn-Se set (FC 2.378 and −2.869). eIEFs are large protein complexes that participate in translation initiation (Yahalom et al., 2008). As referred above, rice biofortification significantly activate a specific and limited set of DEGs, and, thus, it is expected that the set of genes involved in translation is also limited. This is supported by the expression patterns of a queuine tRNA-ribosyltransferase, i.e., negative FC of −2.077 in Se, −2.245 in Zn and −2.303 in Zn-Se, involved in the biosynthesis of tRNA subunits (Zallot
et al., 2014) and known to be inhibited by Zn (Schomburg
and Schomburg, 2010). The expression pattern of a Cytochrome
P450 (CYP) gene followed also the same trend of the eIEF genes, i.e., FC of 6.860 in Se, 6.813 in Zn and −2.869 in Zn-Se, highlighting its importance in monooxygenation/hydroxylation reactions in biochemical pathways (Wei and Chen, 2018) of Se and Zn biofortified plants. The fact that an ethylene response factor 2 was commonly upregulated in the Zn-and in the Se-biofortified pool (Supplementary Tables S2,
S3) may imply that Zn and Se are sensed by the plant as a stress condition, leading to ethylene production, which is similar to what happens in Fe-biofortification (dos Santos
et al., 2017). DEGs were randomly distributed among the
12 rice chromosomes being predominant on chromosomes 1, 3, and 4, while few could be mapped on chromosomes 10, 11, and 12. Although more genomic studies are necessary to understand the molecular basis of biofortification across rice chromosomes, a meta-analysis of rice QTLs associated with iron and zinc in grains have already identified 48 meta-QTLs (MQTL) randomly distributed across rice chromosomes, though they are predominant on chromosome 7 (27 QTLs) and scarcely mapped on chromosome 11 (8 QTLs; Raza et al., 2019). Several genes/transcripts (e.g., OsATM3, OsDMAS1, OsFRO2, OsNAS1-3, OsVIT2, OsYSL16, OsZIP3, and OsZIP7) are physically located within or near these MQTL regions and are, as found here, involved in binding, oxidation reduction process, metabolic process, regulation of transcription, and transport (Raza et al., 2019).
CONCLUSION
In conclusion, we have in this work settled the foundations to understand genomic changes in the flag leaves of rice plants biofortified with the single and combined use of Zn and Se, which are mainly based on the activation of a limited number of metabolic pathways related to micronutrient mobilization and to the specific functions of Zn (i.e., its enzymatic co-factor/coenzyme function in the biosynthesis of nitrogenous compounds, carboxylic acids, organic acids and amino acids) and Se (vitamin biosynthesis and ion homeostasis). The success of this approach should be followed in future studies to understand how landraces and other rice cultivars respond to biofortification. For that, we are currently analyzing the transcriptome of a biofortified rice landrace and integrating agronomic and
molecular analyzes to further study the transcriptional patterns of putatively key biofortification genes during grain development.
DATA AVAILABILITY STATEMENT
The datasets GENERATED for this study can be found in the NCBI Sequence Read Archive under Bioproject No. PRJNA629980.
AUTHOR CONTRIBUTIONS
FR, JR, and FL conceptualized the work. FR, JR, FL, AN, and AR-B performed the experimental design. FR, JR, and AN performed the experimental assays. FR, PB-S, and AR-B performed the laboratory work. FR, IM, ME, BS, and AR-B performed the bioinformatic analysis. FR, IM, JR, and AR-B wrote the manuscript draft. ME and BS performed the critical review of the manuscript. FR, IM, JR, and AR-B were responsible
for the final version of the manuscript. All authors contributed to the article and approved the submitted version.
FUNDING
This work was supported by funds of Camões, Instituto da Cooperação e da Língua, and by Fundação para a Ciência e Tecnologia, Portugal, through the contribution to the International Rice Research Institute, Mozambique, and the research units UIDB/00239/2020 (CEF), UID/04129/2020 (LEAF), and UIDP/04035/2020 (GeoBioTec).
SUPPLEMENTARY MATERIAL
The Supplementary Material for this article can be found online at: https://www.frontiersin.org/articles/10.3389/fgene. 2020.00543/full#supplementary-material
REFERENCES
Andrews, S. (2010).Fast QC: A Quality Control Tool for High Throughput Sequence Data. Available online at: http://www.bioinformatics.babraham.ac.uk/projects/ fastqc/ (accessed October 31, 2018).
Araújo, W. L., Auxiliadora, O. M., Fernie, A. R., and Tohge, T. (2014). 2-Oxoglutarate: linking TCA cycle function with amino acid, glucosinolate, flavonoid, alkaloid, and gibberellin biosynthesis.Front. Plant Sci. 5:552. doi: 10.3389/fpls.2014.00552
Aslam, M., Fakher, B., Jakada, B. H., Zhao, L., Cao, S., Cheng, Y., et al. (2019). Genome-wide identification and expression profiling of CBL-CIPK gene family in pineapple (Ananas comosus) and the role of AcCBL1 in abiotic and biotic stress response.Biomolecules 9:293. doi: 10.3390/biom9070293
Bode, R., Ivanov, A. G., and Hu, N. P. A. (2016). Global transcriptome analyzes provide evidence that chloroplast redox state contributes to intracellular as well as long distance signalling in response to stress and acclimation inArabidopsis. Photos. Res. 128, 287–312. doi: 10.1007/s11120-016-0245-y
Boldrin, P. F., Valdemar, F., Ramos, S. J., Guilherme, L. R. G., Bastos, C., Carvalho, G., et al. (2012). Selenate and selenite on yield and agronomic biofortification with selenium in rice.Pesq. Agropec. Bras. 47, 831–837. doi: 10.1590/S0100-204X2012000600014
Bolger, A. M., Lohse, M., and Usadel, B. (2014). Trimmomatic: a flexible trimmer for Illumina sequence data.Bioinformatics 30, 2114–2120. doi: 10. 1093/bioinformatics/btu170
Brown, P. H., Cakmak, I., and Zhang, Q. (1993). “Form and function of zinc plants,” inZinc in Soils and Plants. Developments in Plant and Soil Sciences 55, ed. A. D. Robson (Dordrecht: Springer), 93–106. doi: 10.1007/978-94-011-0878-2_7 Cakmak, I. (2008). Enrichment of cereal grains with zinc: agronomic or genetic
biofortification?Plant Soil 302, 1–17. doi: 10.1007/s11104-007-9466-3 Cakmak, I., Pfeiffer, W. F., and McClafferty, B. (2010). Biofortification of durum
wheat with zinc and iron.Cereal Chem. 87, 10–20. doi: 10.1094/CCHEM-87-1-0010
Cao, Z. Z., Lin, X. Y., Yang, Y. J., Guan, M. Y., Xu, P., and Chen, M. X. (2019). Gene identification and transcriptome analysis of low cadmium accumulation rice mutant (lcd1) in response to cadmium stress using MutMap and RNA-seq. BMC Plant Biol. 19:250. doi: 10.1186/s12870-019-1867-y
Chattha, M. U., Hassan, M. U., Khan, I., Chattha, M. B., Mahmood, A., Chattha, M. U., et al. (2017). Biofortification of wheat cultivars to combat zinc deficiency. Front. Plant Sci. 8:281. doi: 10.3389/fpls.2017.00281
Chen, X., Tao, Y., Ali, A., Zhuang, Z., Guo, D., Guo, Q., et al. (2019). Transcriptome and proteome profiling of dfferent colored rice reveals physiological dynamics involved in the flavonoid pathway. Int. J. Mol. Sci. 20:2463. doi: 10.3390/ ijms20102463
dos Santos, R. S., Araujo Junior, A. T., Pegoraro, C., and de Oliveira, A. C. (2017). Dealing with iron metabolism in rice: from breeding for stress tolerance to biofortification.Genet. Mol. Biol. 40, 312–325. doi: 10.1590/1678-4685-GMB-2016-0036
Fairweather-Tait, S. J., Bao, Y., Broadley, M. R., Collings, R., Ford, D., and Hesketh, J. E. (2011). Selenium in human health and disease.Antioxid. Redox Signal. 14, 1337–1383.
FAO (2016).The State of Food and Agriculture – Climate Change, Agriculture and Food Security. Rome: Food and Agriculture Organization of the United Nations. FAO, IFAD, UNICEF, WFP, and WHO (2019).The State of Food SECURITY and Nutrition in The World 2019. Safeguarding Against Economic Slowdowns and Downturns. Rome: FAO.
Farrow, S. C., and Facchini, P. J. (2014). Functional diversity of 2-oxoglutarate/Fe(II)-dependent dioxygenases in plant metabolism. Front. Plant Sci. 5:524. doi: 10.3389/fpls.2014.00524
Forsman, C., Milani, P., Schondebare, J. A., Matthias, D., and Guyondet, C. (2014). Rice fortification: a comparative analysis in mandated settings.Ann. N. Y. Acad. Sci. 1324, 67–81. doi: 10.1111/nyas.12453
Garg, M., Sharma, N., Sharma, S., Kapoor, P., Kumar, A., Chunduri, V., et al. (2018). Biofortified crops generated by breeding, agronomy, and transgenic approaches are improving lives of millions of people around the world.Front. Nutr. 5:12. doi: 10.3389/fnut.2018.00012
Goeres, D. C., Van Norman, J. M., Zhang, W., Fauver, N. A., Spencer, M. L., and Sieburth, L. E. (2007). Components of theArabidopsis mRNA decapping complex are required for early seedling development.Plant Cell 19, 1549–1564. doi: 10.1105/tpc.106.047621
Gorelova, V., Ambach, L., Rébeillé, F., Stove, C., and Van der Straeten, D. (2017). Folates in plants: research advances and progress in crop biofortification.Front. Chem. 5:21. doi: 10.3389/fchem.2017.00021
Gupta, M., and Gupta, S. (2017). An overview of selenium uptake, metabolism, and toxicity in plants. Front. Plant Sci. 7:2074. doi: 10.3389/fpls.2016. 02074
Hartikainen, H. (2005). Biogeochemistry of selenium and its impact of food chain quality and human health.J. Trace Elem. Med. Biol. 18, 309–318. doi: 10.1016/j. jtemb.2005.02.009
He, F., Liu, Q., Zheng, L., Cui, Y., Shen, Z., and Zheng, L. (2015). RNA-seq analysis of rice roots reveals the involvement of post-transcriptional regulation in response to cadmium stress.Front. Plant Sci. 6:1136. doi: 10.3389/fpls.2015. 01136
Hefferon, K. (2019). Biotechnological approaches for generating zinc-enriched crops to combat malnutrition.Nutrients 11:253. doi: 10.3390/nu11020253 Hirschi, K. D. (2009). Nutrient biofortication of food crops.Annu. Rev. Nutr. 29,
Ho, C. H., Lin, S. H., Hu, H. C., and Tsay, Y. F. (2009). CHL1 functions as a nitrate sensor in plants.Cell 138, 1184–1194. doi: 10.1016/j.cell.2009.07.004 Jablonska, E., and Vinceti, M. (2015). Selenium and human health: witnessing a
Copernican revolution?J. Environ. Sci. Health Part C 33, 328–368. doi: 10.1080/ 10590501.2015.1055163
Jackson, S. A. (2016). Rice: the first crop genome.Rice 9:14. doi: 10.1186/s12284-016-0087-4
Jiang, N., Shi, S., Shi, H., Khanzada, H., Wassan, G. M., Zhu, C., et al. (2017). Mapping QTL for seed germinability under low temperature using a new high-density genetic map of rice.Front. Plant Sci. 8:1223. doi: 10.3389/fpls.2017. 01223
Jiménez-López, D., Bravo, J., and Guzmán, P. (2015). Evolutionary history exposes radical diversification among classes of interaction partners of the MLLE domain of plant poly(A)-binding proteins.BMC Evol. Biol. 15:195. doi: 10.1186/ s12862-015-0475-1
Jiménez-López, D., and Guzmán, P. (2014). Insights into the evolution and domain structure of ataxin-2 proteins across eukaryotes.BMC Res. Notes 7:453. doi: 10.1186/1756-0500-7-453
Kawa, D., and Testerink, C. (2017). Regulation of mRNA decay in plant responses to salt and osmotic stress.Cell. Mol. Life Sci. 74, 1165–1176. doi: 10.1007/ s00018-016-2376-x
Kawahara, Y., de la Bastide, M., Hamilton, J. P., Kanamori, H., McCombie, W. R., Ouyang, S., et al. (2013). Improvement of theOryza sativa Nipponbare reference genome using next generation sequence and optical map data.Rice 6:4. doi: 10.1186/1939-8433-6-4
Kawai, Y., Ono, E., and Mizutani, M. (2014). Evolution and diversity of the 2-oxoglutarate-dependent dioxygenase superfamily in plants.Plant J. 78, 328– 343. doi: 10.1111/tpj.12479
Kole, C., Muthamilarasan, M., Henry, R., Edwards, D., Sharma, R., Abberton, M., et al. (2015). Application of genomics-assisted breeding for generation of climate resilient crops: progress and prospects.Front. Plant Sci. 6:563. doi: 10.3389/fpls.2015.00563
Kondwakwenda, A., Sibiya, J., Zengeni, R., Musvosvi, C., and Meike, A. S. (2018). Provitamin A maize biofortification in sub-Saharan Africa.Maydica 63, 1–9. Li, N., Liu, H., Sun, J., Zheng, H., Wang, J., Yang, L., et al. (2018). Transcriptome
analysis of two contrasting rice cultivars during alkaline stress.Sci. Rep. 8:9586. doi: 10.1038/s41598-018-27940-x
Lidon, F. C., Almeida, A. S., Costa, A. R., Bagulho, A. S., Scotti-Campos, P., Semedo, J. N., et al. (2015). Sequential zinc and iron biofortification of bread-wheat grains: from controlled to uncontrolled environments.Crop Pasture Sci. 66, 1097–1104. doi: 10.1071/CP14270
Lidon, F. C., Oliveira, K., Galhano, C., Guerra, M., Ribeiro, M. M., Pelica, J., et al. (2019). Selenium biofortification of rice through foliar application with selenite and selenate.Exp. Agric. 55, 528–542. doi: 10.1017/S0014479718000157 Lidon, F. C., Ramalho, J. C., Leitão, A. E., Pessoa, M. F., Silva, M. M. A., and
Reboredo, F. H. (2017). Essential key points for zinc biofortification: uptake, translocation and accumulation mechanisms in higher plants.Agric. Res. Tech. 4, 555–647. doi: 10.19080/ARTOAJ.2017.04.555647
Ligaba-Osena, A., Fei, Z., Liu, J., Xu, Y., Shaff, J., Lee, S. C., et al. (2017). Loss-of-function mutation of the calcium sensor CBL1 increases aluminum sensitivity inArabidopsis. New Phytol. 214, 830–841. doi: 10.1111/nph.14420
Liu, H., Gan, W., Rengel, Z., and Zhao, P. (2016). Effects of zinc fertilizer rate and application method on photosynthetic characteristics and grain yield of summer maize.J. Soil Sci. Plant Nutr. 16, 550–562. doi: 10.4067/S0718-95162016005000045
Liu, H., Wang, Y. X., Li, H., Teng, R. M., Wang, Y., and Zhuang, J. (2019). Genome-wide identification and expression analysis of calcineurin B-like protein and calcineurin B-like protein-interacting protein kinase family genes in tea plant. DNA Cell Biol. 38, 824–839. doi: 10.1089/dna.2019.4697
Loizeau, K., Gambonnet, B., Zhang, G. F., Curien, G., Jabrin, S., Van Der Straeten, D., et al. (2017). Regulation of one-carbon metabolism inArabidopsis: the N-terminal regulatory domain of cystathionineγ-synthase is cleaved in response to folate starvation.Plant Physiol. 145, 491–503. doi: 10.1104/pp.107. 105379
Lucca, P., Poletti, S., and Sautter, C. (2006). Genetic engineering approaches to enrich rice with iron and vitamin A.Physiol. Plant. 126, 291–303. doi: 10.1111/ j.1399-3054.2006.00609x
Mangueze, A. V. J., Pessoa, M. F. G., Silva, M. J., Ndayiragije, A., Magaia, H. E., Cossa, V. S. I., et al. (2018). Simultaneous zinc and selenium biofortification in rice. Accumulation, localization and implications on the overall mineral content of the flour.J. Cereal Sci. 82, 34–41. doi: 10.1016/j.jcs.2018.05.005
Minhas, A. P., Tuli, R., and Puri, S. (2018). Pathway editing targets for thiamine biofortification in rice grains.Front. Plant Sci. 9:975. doi: 10.3389/fpls.2018. 00975
Mishra, V. K., Gupta, S., Ghand, R., Yadav, P. S., Singh, S. K., Joshi, A. K., et al. (2019). Unveiling the transcriptome complexity of the high- and low- zinc and iron accumulating Indian wheat (Triticum aestivum L.) cultivars. bioRxiv [Preprint]. doi: 10.1101/538819 bioRxiv 538819,
Moreno, R. G., Burdock, R., Álvarez, M. C. D., and Crawford, J. W. (2013). Managing the selenium content in soils in semiarid environments through the recycling of organic matter.Appl. Environ. Soil Sci. 2013:e283468. doi: 10.1155/ 2013/283468
Muthayya, S., Sugimoto, J. D., Montgomery, S., and Maberly, G. F. (2014). An overview of global rice production, supply, trade, and consumption.Ann. N. Y. Acad. Sci. 1324, 7–14. doi: 10.1111/nyas.12540
Nakandalage, N., Nicolas, M., Norton, R. M., Hirotsu, N., Milham, P. J., and Seneweera, S. (2016). Improving rice zinc biofortification success rates through genetic and crop management approaches in a changing environment.Front. Plant Sci. 7:764. doi: 10.3389/fpls.2016.00764
Narayanan, N. N., Vasconcelos, M. W., and Grusak, M. A. (2007). Expression profiling ofOryza sativa L. metal homeostasis genes in different rice cultivars using a cDNA macroarray.Plant Physiol. Biochem. 45, 277–286. doi: 10.1016/j. plaphy.2007.03.021
Neeraja, C. N., Kulkarni, K. S., Babu, P. M., Rao, D. S., Surekha, K., and Babu, V. R. (2018). Transporter genes identified in landraces associated with high zinc in polished rice through panicle transcriptome for biofortification.PLoS One 13:e0196160. doi: 10.1371/journal.pone.0192362
Nützman, H. W., Huang, A., and Osbourn, A. (2016). Plant metabolic clusters-from genetics to genomics.New Phytol. 211, 771–789. doi: 10.1111/nph.13981 Ostrowski, L. A., Hall, A. C., and Mekhail, K. (2017). Ataxin-2: from RNA control
to human health and disease.Genes 8:157. doi: 10.3390/genes8060157 Pang, J., Kobayashi, K., and Zhu, J. (2009). Yield and photosynthetic characteristics
of flag leaves in Chinese rice (Oryza sativa L.) varieties subjected to free-air release of ozone.Agric. Ecosyst. Environ. 132, 3–4. doi: 10.1016/j.agee.2009. 03.012
Pertea, M., Kim, D., Pertea, G. M., Leek, J. T., and Salzberg, S. L. (2016). Transcript-level expression analysis of RNA-seq experiments with HISAT, StringTie and Ballgown.Nat. Protoc. 11, 1650–1667. doi: 10.1038/nprot.2016.095
Pertea, M., Pertea, G. M., Antonescu, C. M., Chang, T. C., Mendell, J. T., and Salzberg, S. L. (2015). StringTie enables improved reconstruction of a transcriptome from RNA-seq reads.Nat. Biotechnol. 33, 290–295. doi: 10.1038/ nbt.3122
Phattarakul, N., Rerkasem, B., Li, L. J., Wu, L. H., Zou, C. Q., Ram, H., et al. (2012). Biofortication of rice grain with zinc through zinc fertilization in different countries.Plant Soil 361, 131–141. doi: 10.1007/s11104-012-1211-x
Prentice, A. M., Gershwin, M. E., Schaible, U. E., Keusch, G. T., Victora, C. G., and Gordon, J. I. (2008). New challenges in studying nutrition-disease interactions in the developing world.J. Clin. Invest. 118, 1322–1329. doi: 10.1172/JCI34034 Qian, L., Liu, Z., Wu, J., Zhang, C., Huang, S., Liu, X., et al. (2018). Transcriptome
analysis of the responses involved in the regulation of cadmium stress by exogenous hydrogen in rice (Oryza sativa L.). Pak. J. Bot. 50, 2123–2129. Ram, H., Rashid, A., Zhang, W., Duarte, A. P., Phattarakul, N., Simunji, S., et al.
(2016). Biofortification of wheat, rice and common bean by applying foliar zinc fertilizer along with pesticides in seven countries.Plant Soil 403, 389–401. doi: 10.1007/s11104-016-2815-3
Ramalho, J. C., Roda, F. A., Pessoa, M. F. G., Reboredo, F. H., Pais, I. P., Ndayiragije, A., et al. (2020). “Selenium agronomic biofortification in rice: improving crop quality against malnutrition,” inThe Future of Rice Demand: Quality Beyond Productivity, Chapter 8, eds A. Costa de Oliveira, C. Pegoraro, and V. Ebeling Viana (Cham: Springer Nature), 179–203. doi: 10.1007/978-3-030-37510-2_8 Rayman, M. P. (2002). The argument for increasing selenium intake.Proc. Nutr.
Soc. 61, 203–215. doi: 10.1079/PNS2002153
Raza, Q., Riaz, A., Sabar, M., Atif, R. M., and Bashir, K. (2019). Meta-analysis of grain iron and zinc associated QTLs identified hotspot chromosomal
regions and positional candidate genes for breeding biofortified rice.Plant Sci. 288:110214. doi: 10.1016/j.plantsci.2019.110214
Sasaki, T. (2005). The map-based sequence of the rice genome. Nature 436, 793–800. doi: 10.1038/nature03895
Sauer, U., Heinemann, M., and Zamboni, N. (2007). Genetics: getting closer to the whole picture.Science 316, 550–551. doi: 10.1126/science.1142502
Scheible, W. R., Krapp, A., and Stitt, M. (2000). Reciprocal diurnal changes of phosphoenolpyruvate carboxylase expression and cytosolic pyruvate kinase, citrate synthase and NADP-isocitrate dehydrogenase expression regulate organic acid metabolism during nitrate assimilation in tobacco leaves.Plant Cell Environ. 23, 1155–1167. doi: 10.1046/j.1365-3040.2000.00634.x
Schomburg, D., and Schomburg, I. (2010).Springer Handbook of Enzymes. Berlin: Springer.
Shi, H., Quintero, F. J., Pardo, J. M., and Zhu, J. K. (2002). The putative plasma membrane Na+/H+antiporter SOS
1controls long-distance Na(+) transport in plants.Plant Cell 14, 465–477. doi: 10.1105/tpc.010371
Singh, R. K., Murori, R., Ndayiragije, A., Bigirimana, J., Kimani, J. M., Kanyeka, Z. L., et al. (2013). Rice breeding activities in Eastern and Southern Africa. SABRAO J. Breed. Genet. 45, 73–83.
Sperotto, R. A., Ricachenevsky, F. K., de, A., Waldow, V., Müller, A. L. H., Dressler, V. L., et al. (2013). Rice grain Fe, Mn and Zn accumulation: how important are flag leaves and seed number?Plant Soil Environ. 59, 262–266. doi: 10.17221/ 841/2012-PSE
Sperotto, R. A., Ricachenevsky, F. K., Duarte, G. L., Boff, T., Lopes, K. L., Sperb, E. R., et al. (2009). Identification of upregulated genes in flag leaves during rice grain filling and characterization of OsNAC5, a new ABA-dependent transcription factor.Planta 230, 985–1002. doi: 10.1007/s00425-009-1000-9
Sun, L., Wang, J., Song, K., Sun, Y., Qin, Q., and Xue, Y. (2019). Transcriptome analysis of rice (Oryza sativa L.) shoots responsive to cadmium stress. Sci. Rep. 9:10177. doi: 10.1038/s41598-019-46684-w
Sunde, R. A. (2018). Selenium regulation of selenoprotein enzyme activity and transcripts in a pilot study with Founder strains from the Collaborative Cross. PLoS One 13:e0191449. doi: 10.1371/journal.pone. 0191449
Sundell, D., Mannapperuma, C., Netotea, S., Delhomme, N., Lin, Y. C., Sjödin, A., et al. (2015). The plant genome integrative explorer resource: PlantGenIE.org. New Phytol. 208, 1149–1156. doi: 10.1111/nph.13557
Swamy, B. P. M., Rahman, M. A., Inabangan-Asilo, M. A., Amparado, A., Manito, C., Chadha-Mohanty, P., et al. (2016). Advances in breeding for high grain Zinc in Rice.Rice 9, 49. doi: 10.1186/s12284-016-0122-5
Tang, R. J., Zhao, F. G., Garcia, V. J., Kleist, T. J., Yang, L., Zhang, H. X., et al. (2015). Tonoplast CBL-CIPK calcium signaling network regulates magnesium homeostasis inArabidopsis. Proc. Natl. Acad. Sci. U.S.A. 112, 3134–3139. doi: 10.1073/pnas.1420944112
Tang, X., Gong, R., Sun, W., Zhang, C., and Yu, S. (2018). Genetic dissection and validation of candidate genes for flag leaf size in rice (Oryza sativa L.). Theor. Appl. Genet. 131, 801–815. doi: 10.1007/s00122-017-3036-8
Tari, B. D., Gazanchian, A., Pirdashti, A. H., and Nasiri, M. (2009). Flag leaf morphophysiological response to different agronomical treatments in a promising line of rice (Oryza sativa L.). Am. Eur. J. Agric. Environ. Sci. 5, 403–408.
Trapnell, C., Williams, B. A., Pertea, G., Mortazavi, A., Kwan, G., van Baren, M. J., et al. (2010). Transcript assembly and quantification by RNA-Seq reveals unannotated transcripts and isoform switching during cell differentiation.Nat. Biotechnol. 28, 511–515. doi: 10.1038/nbt.1621
Walter, M., Marchezan, E., and Avila, L. A. (2008). Arroz: composição e características nutricionais.Ciencia Rural 38, 1184–1192. doi: 10.1590/S0103-84782008000400049
Wang, J., Cappa, J. J., Harris, J. P., Edger, P. P., Wen Zhou, W., Pires, J. C., et al. (2018). Transcriptome-wide comparison of selenium hyperaccumulator and nonaccumulatorStanleya species provides new insight into key processes mediating the hyperaccumulation syndrome. Plant Biotechnol. J. 16, 1582– 1594. doi: 10.1111/pbi.12897
Wang, Z., Wang, S., Wu, M., Li, Z., Liu, P., Li, F., et al. (2019). Evolutionary and functional analyzes of the 2-oxoglutarate-dependent dioxygenase genes
involved in the flavonoid biosynthesis pathway in tobacco.Planta 249, 543–561. doi: 10.1007/s00425-018-3019-2
Wei, K., and Chen, H. (2018). Global identification, structural analysis and expression characterization of cytochrome P450 monooxygenase superfamily in rice.BMC Genomics 19:35. doi: 10.1186/s12864-017-4425-8
White, P. J., and Broadley, M. R. (2009). Biofortification of crops with seven mineral elements often lacking in human diets Iron, zinc, copper, calcium, magnesium, selenium and iodine.New Phytol. 182, 49–84. doi: 10.1111/j.1469-8137.2008.02738.x
White, P. J., and Broadley, M. R. (2011). Physiological limits to zinc biofortification of edible crops.Front. Plant Sci. 2:80. doi: 10.3389/fpls.2011.00080
Xu, J., Li, H. D., Chen, L. Q., Wang, Y., Liu, L. L., He, L., et al. (2006). A protein kinase, interacting with two calcineurin B-like proteins, regulates K+ transporter AKT1 inArabidopsis. Cell 125, 1347–1360. doi: 10.1016/j.cell.2006. 06.011
Xu, W., Yang, R., Li, M., Xing, Z., Yang, W., Chen, G., et al. (2011). Transcriptome phase distribution analysis reveals diurnal regulated biological processes and key pathways in rice flag leaves and seedling leaves.PLoS One 6:e17613. doi: 10.1371/journal.pone.0017613
Yahalom, A., Kim, T. H., Roy, B., Singer, R., von Arnim, A. G., and Chamovitz, D. A. (2008).Arabidopsis eIF3e is regulated by the COP9 signalosome and has an impact on development and protein translation.Plant J. 53, 300–311. doi: 10.1111/j.1365-313X.2007.03347.x
Yamazaki, Y., Sakaniwa, S., Tsuchiya, R., Nonomura, K. I., and Kurata, N. (2010). Oryzabase: an integrated information resource for rice science.Breed. Sci. 60, 544–548. doi: 10.1270/jsbbs.60.544
Yi, F., Gu, W., Chen, J., Song, N., Gao, X., Zhang, X., et al. (2019). High temporal-resolution transcriptome landscape of early maize seed development.Plant Cell 31, 974–992. doi: 10.1105/tpc.18.00961
Yin, Q., Shen, G., Di, S., Fan, C., Chang, Z., and Pang, Y. (2017). Genome-wide identi?cation and functional characterization of UDP-glucosyltransferase genes involved in flavonoid biosynthesis inGlycine max. Plant Cell Physiol. 58, 1558–1572. doi: 10.1093/pcp/pcx081
Yu, B., Niu, J., Feng, J., Xu, M., Xie, X., Gu, W., et al. (2018). Regulation of ferredoxin-NADP+ oxidoreductase to cyclic electron transport in high salinity stressedPyropia yezoensis. Front. Plant Sci. 9:1092. doi: 10.3389/fpls.2018.01092 Zallot, R., Brochier-Armanet, C., Gaston, K. W., Forouhar, F., Limbach, P. A.,
Hunt, J. F., et al. (2014). Plant, animal, and fungal micronutrient queuosine is salvaged by members of the DUF2419 protein family ACS.Chem. Biol. 9, 1812–1825. doi: 10.1021/cb500278k
Zhang, Y., Yang, L., Jahan, N., Chen, G., Ren, D., and Guo, L. (2018). Sensing of abiotic stress and ionic stress responses in plants.Int. J. Mol. Sci. 19:3298. doi: 10.3390/ijms19113298
Zhao, M., Wang, W., Wei, L., Chen, P., Yuan, F., Wang, Z., et al. (2018). Molecular evolution and expression divergence of three key Met biosynthetic genes in plants: CGS, HMT and MMT.PeerJ 6:e6023. doi: 10.7717/peerj.6023 Zhou, J., Wang, X., Jiao, Y., Qin, Y., Liu, X., He, K., et al. (2007). Global genome
expression analysis of rice in response to drought and high-salinity stresses in shoot, flag leaf, and panicle.Plant Mol. Biol. 63, 591–608. doi: 10.1007/s11103-006-9111-1
Zhou, S., Williams, A. P., Berg, A. M., Cook, B. I., Zhang, Y., Hagemann, S., et al. (2019). Land-atmosphere feedbacks exacerbate concurrent soil drought and atmospheric aridity.Proc. Natl. Acad. Sci. U.S.A. 116, 18848–18853. doi: 10.1073/pnas.1904955116
Conflict of Interest:The authors declare that the research was conducted in the absence of any commercial or financial relationships that could be construed as a potential conflict of interest.
Copyright © 2020 Roda, Marques, Batista-Santos, Esquível, Ndayiragije, Lidon, Swamy, Ramalho and Ribeiro-Barros. This is an open-access article distributed under the terms of the Creative Commons Attribution License (CC BY). The use, distribution or reproduction in other forums is permitted, provided the original author(s) and the copyright owner(s) are credited and that the original publication in this journal is cited, in accordance with accepted academic practice. No use, distribution or reproduction is permitted which does not comply with these terms.