FACULDADE DE FARMÁCIA
DEPARTAMENTO DE FARMÁCIA GALÉNICA E TECNOLOGIA FARMACÊUTICA
Production and mechanistic evaluation of the stability of polymorphic
olanzapine in solid dosage forms
Maria de Castro Paisana
Orientador: Professor Doutor João F. Pinto Co-orientador: Professor Doutor Martin A. Wahl
Tese especialmente elaborada para obtenção do grau de Doutor em Farmácia
(Tecnologia Farmacêutica)
Júri:
Presidente:
Professora Doutora Matilde F. Castro
Vogais:
Professor Doutor João José M. Simões de Sousa Professor Doutor Chris Vervaet
Professora Doutora Helena M. Cabral Marques Professora Doutora Maria Helena A. R. Amaral Professor Doutor Luís F. P. Gouveia
Fundação para a ciência e tecnologia (SFRH/BD/90118/2012) Lisboa, 2016
FACULDADE DE FARMÁCIA
DEPARTAMENTO DE FARMÁCIA GALÉNICA E TECNOLOGIA FARMACÊUTICA
Production and mechanistic evaluation of the stability of polymorphic
olanzapine in solid dosage forms
Tese especialmente elaborada para obtenção do grau de Doutor em Farmácia
(Tecnologia Farmacêutica)
À minha família, Ao Luís,
“Onde há uma vontade, há um caminho”
I am very grateful to my thesis advisor, Prof. Dr. João F. Pinto, for his constant guidance, support, and encouragement throughout my research. Without his help, the completion of this thesis would have been impossible. I am also glad that Prof. Pinto had believed in me and in my capacities to teach in laboratory and practical classes of “Tecnologia Farmacêutica I” and to be the co-supervisor of students during their Master Degree Course and in ERASMUS thesis.
I would like to take the opportunity to thank Prof. Dr. Martin A. Wahl, who was my co-supervisor. It was my great honor to have worked with him and I am grateful for his continuous support. I further thank him for the opportunity to work with the pilot scale supercritical fluid equipment in the technological department of the Eberhard Karls Universität Tübingen, Germany, which was a great experience.
My gratitude goes to Katrin Müllers who became a great friend that I have made in this journey. It was a pleasure to work with her. Her intelligence, insight, kindness were a valuable help for me during my stay in Tübingen. I am grateful that our friendship has extended beyond our academic life.
I owe my deepest gratitude to my dear colleagues Joana Marto, Joana Pinto, Andreia Cordeiro, Diana Gaspar, Íris Duarte. Their friendship and advices were precious to my professional and personal growth and will help me overcome many difficulties in my future career.
I want to thank Prof. Dr. Manuel Minas da Piedade for providing me the access to the Department of Chemistry and Biochemistry, Faculty of Sciences, University of Lisbon, where I have carried out part of the characterization work, by using the XRPD, DRIFT and TGA techniques. His constant willingness to help me is also kindly acknowledged.
I thank to Prof. Dr. João Lopes and Prof. Dr. Luís Gouveia for all their help, and to Prof. Dr. Helena Marques, Dra. Manuela Gaspar, and Dra. Luísa Corvo for their care and friendship. I also thank Prof. Dr. António Almeida for giving me the opportunity to teach in the laboratory component of the course of “Farmácia Galénica”.
I thank Filipa Faria, Maurício Ramalho, Maria João Cardoso, Inês Pascual, Inês Botas, Ana Sofia Antunes, Barbara Pena and Carolina Sousa for all the friendship and support during these years.
I am deeply grateful to my parents and to my brother, who have unconditionally supported me over all these years. I am ever indebted to them for their understanding, patience and love.
Above all, I thank to Luis Gomes, for his unconditional support, patience, and care and for being always by my side making me believe that with hard work everything is possible.
Chapter 1 - Introduction ... 2
1.1 Introduction to solid-state properties of materials used in pharmacy ... 2
1.2 Polymorphism ... 4
1.3 A comprehensive understanding of crystallization ... 10
1.4 Solvatomorphism ... 17
1.5 Process-induced phase transformations ... 20
1.6 Storage: Moisture-induced phase transitions ... 25
1.7 Mechanism of phase transformations occurring during processing and storage ... 25
1.8 Excipients ... 27
Chapter 2 - Materials and methods ... 32
2.1 Materials... 32
2.2 Preparation of different polymorphic forms... 42
2.3 Preparation of controlled humidity containers ... 43
2.4 Pelletization ... 43
2.5 Preparation of nanoparticles by a technology using fluids in a supercritical state ... 44
2.6 Techniques considered for the characterization of materials and products ... 45
Chapter 3 - Production, characterization and stability over storage of two olanzapine anhydrous polymorphic forms ... 58
3.1 Abstract ... 58
3.2 Introduction ... 59
3.2 Purpose ... 61
3.3 Material and Methods ... 61
3.4 Results ... 65
3.5 Discussion ... 76
3.6 Conclusion ... 81
Chapter 4 - Role of excipients on the kinetics of hydrate transformation of olanzapine Form I over storage ... 84
4.1 Abstract ... 84
4.2 Introduction ... 85
4.3 Purpose ... 86
4.4 Materials and methods ... 86
4.5 Results ... 89
4.6 Discussion ... 99
4.7 Conclusion ... 104
Chapter 5 - An insight into the impact of polymers on the hydrate conversion of olanzapine Form I in aqueous suspensions ... 108
5.1 Abstract ... 108
5.2 Introduction ... 109
5.3 Purpose ... 109
5.5.1 Conversion of OLZ in aqueous suspensions ... 112
5.5.3 Wettability of the recovered OLZ ... 116
5.5.4 Saturation solubility of OLZ ... 116
5.6 Discussion ... 119
5.7 Conclusion ... 122
Chapter 6 - Effect of RESS and RESSAS technologies on the particle size reduction, solid-state form and dissolution rate of olanzapine ... 126
6.1 Abstract ... 126
6.2 Introduction ... 127
6.3 Purpose ... 128
6.4 Materials and methods ... 128
6.5 Results ... 132
6.6 Discussion ... 141
6.7 Conclusion ... 144
Chapter 7 - Impact of extrusion process on the physical properties of olanzapine and pellets ... 148
7.1 Abstract ... 148
7.2 Introduction ... 149
7.3 Purpose ... 149
7.4 Materials and Methods ... 150
7.5 Results ... 153
7.6 Discussion ... 165
7.7 Conclusion ... 169
Chapter 8 - Role of excipients on the stabilization of olanzapine during extrusion and dissolution ... 172
8.1 Abstract ... 172
8.2 Introduction ... 172
8.3 Purpose ... 173
8.4 Materials and methods ... 174
8.5 Results ... 177
8.6 Discussion ... 187
8.7 Conclusion ... 191
Chapter 9 - Conclusions and suggestions for future work ... 194
9.1 Concluding Remarks ... 194
9.2 Recommendations for Future Work ... 197
Appendices ... 200
Research related to drug polymorphism is an important aspect in drug product development since the properties of a formulated product, such as its stability and bioavailability, are often directly related to the physicochemical properties of the existing polymorph in the formulation. Olanzapine (OLZ) belongs to a new generation of benzodiazepines for the treatment of schizophrenia and other related psychoses and may exist in several crystalline forms, including polymorphic anhydrates, hydrates and solvates. Consequently, the physical treatments and technological processes undergone by the drug may have an impact on its solid-state, which in turn may affect its performance in terms of dissolution rate, absorption and therapeutic activity and response. OLZ Form I is the form used in marketed tablets and the most stable form at room temperature.
The work presented in this Thesis aimed to provide an in-depth understanding of the conversion of olanzapine polymorphic forms into hydrated forms when exposed to different processing conditions. To perform this study we used several techniques, such as a combination of thermal analysis (differential scanning calorimetry (DSC), thermogravimetry (TGA) and hot stage microscopy (HSM)) with spectroscopic (infrared spectroscopy – DRIFT; FTIR), diffraction analysis (XRPD) and surface measurements (contact angle and surface free energy). Dissolution performance and impact of polymorphism on the mechanical characteristic of solid dosage forms was also evaluated.
At first, a thorough investigation of the solid state stability of olanzapine forms I and II was performed. Aspects such as the interaction with water and the conversion of both forms into different dihydrates were fully explored. This allowed the successful clarification of the higher hygroscopic nature and easier ability of olanzapine Form II to undergo hydrate formation. On the other hand, Form I showed to hydrate into the lowest soluble form of olanzapine - dihydrate D – when subjected to high RH environments. The interaction of Form I with humidity and excipients was fully investigated. Form I was found to hydrate at different rates depending on the excipients in which it is formulated. Polymers such as polyethylene glycol (PEG) and hydroxypropyl cellulose (HPC) could induce hydrate transformation at lower relative humidity (75%), whereas PVP could avoid hydrate conversions at 93% RH. PEG, when physically mixed with olanzapine, showed to accelerate hydrate conversion, especially when the materials were subjected to a tableting process before storage. This study showed an interesting interplay between the polymer’s choice, load and chemistry that could further be used to maintain the stability of olanzapine in solid-dosage products.
Transformations of olanzapine during processing, namely during the rapid expansion of supercritical solutions (RESS) and rapid expansion of supercritical solutions into aqueous solutions (RESSAS) processes were also taken into consideration. These technologies enabled
RESSAS process the selection of the right excipients was imperative to produce stable nanosuspensions before and after freeze drying the products.
Microcrystalline cellulose and polymers (PEG, PVP and HPC) were used in the process of extrusion and spheronisation of olanzapine. The transformations which occur during processing (wet environments are involved) and during dissolution of the pellets were taken into consideration. During the extrusion process olanzapine showed to hydrate into a mixture of different hydrates when extruded in the presence of microcrystalline cellulose. The addition of polymers such as PVP and HPC to the formulation allowed olanzapine to remain anhydrous during processing and dissolution, which showed to significantly influence the dissolution of the drug. PEG, on the other hand, could not avoid the hydrate formation of olanzapine, having this transformation an impact on the physical and mechanical characteristics of the pellets, as well as an impact on the drug performance. The impact of the polymer content and molecular weight into olanzapine stabilization during wetting were also taken into consideration.
In conclusion, the research carried out contributed to a better understanding of the complex characterization of solid state olanzapine and formulated products prepared by different technologies. In detail, it showed the impact of polymorphic/pseudopolymorphic changes on OLZ’s technological performance and dissolution, which highlighted the importance of this study during preformulation and formulation studies.
O estudo do polimorfismo de fármacos é uma área científica importante no desenvolvimento de formas farmacêuticas sólidas, uma vez que as propriedades de um produto formulado, tais como estabilidade e biodisponibilidade, estão muitas vezes diretamente relacionadas com as propriedades físico-químicas dos polimorfos existentes na formulação. A olanzapina (OLZ) pertence a uma nova geração de benzodiazepínicos para o tratamento da esquizofrenia e outras psicoses relacionadas. Este fármaco pode existir em várias formas cristalinas, incluindo formas anidras, hidratadas e solvatadas. Por conseguinte, os tratamentos físicos e processos tecnológicos sofridos pelo fármaco podem ter um impacto na estabilidade da forma polimórfica escolhida para o produto final. Consequentemente, estes processamentos podem afetar o seu desempenho em termos de taxa de dissolução, absorção e, finalmente, atividade terapêutica. A olanzapina Forma I é a forma usada nos comprimidos existentes no mercado e é a forma polimórfica mais estável à temperatura ambiente.
O trabalho apresentado nesta tese teve como objetivo obter uma compreensão aprofundada da conversão de formas polimórficas de olanzapina em formas hidratadas quando expostas a diferentes condições de processamento. Para tal, neste trabalho foram utilizadas diversas técnicas, tais como uma combinação de análise térmica (DSC, TGA, HSM) com espectroscópica (DRIFT; FTIR), análise de difração (XRPD) e energia de superfície (medições de ângulo de contacto e energia livre de superfície). Foi também avaliada a dissolução e o impacto do polimorfismo nas características mecânicas das formas farmacêuticas sólidas.
Primeiramente foi realizada uma investigação completa sobre a estabilidade das formas cristalinas anidras I e II. Aspetos como o estudo da estabilidade das formas quando em presença de diferentes humidades relativas e caracterização dos hidratos formados foram explorados. Este estudo permitiu concluir que a Forma cristalina II é mais higroscópica, hidratando mais rapidamente e a menores humidades relativas do que a Forma I. A forma I, por outro lado, mostrou hidratar numa forma hidratada – dihidrato D – que apresenta uma velocidade de dissolução inferior às outras formas hidratadas da olanzapina, alertando para a necessidade de um armazenamento apropriado para este fármaco. Visto que os excipientes podem alterar as cinéticas de hidratação, estes podem fazer com que esta forma hidratada da olanzapina apareça a humidades mais reduzidas e com maior velocidade. Assim sendo, foram investigadas a interação da forma I com humidade e excipientes. Estando descrito que os excipientes poliméricos poderão ter maior impacto no processo de hidratação, 3 polímeros foram escolhidos para o estudo. A Forma I mostrou hidratar a velocidades diferentes, dependendo dos excipientes em que foi formulada. Polímeros, tais como PEG e HPC, mostraram induzir a transformação no hidrato D a uma humidade relativa baixa (75% RH), enquanto a PVP mostrou evitar quaisquer conversões, mesmo a humidades relativas de 93%. O PEG quando misturado fisicamente com
tenham sido pressionadas (submetidas a um processo compactação) antes do armazenamento. Este estudo mostrou que deve ser feito um balanço quando é feita a escolha dos polímeros a serem usados no processo de formulação, nomeadamente tendo em conta a quantidade usada e a sua estrutura química, de forma a manter a estabilidade da olanzapina em formas farmacêuticas sólidas.
As transformações da olanzapina durante o processo RESS / RESSAS foram igualmente estudadas. Estas tecnologias permitiram produzir nanopartículas e nanossuspensões de olanzapina, respetivamente. Durante o processo de RESSAS a seleção dos excipientes estabilizadores das suspensões formadas mostrou ser imperativa para produzir nanossuspensões estáveis antes e após o processo de secagem por congelação.
A celulose microcristalina, bem como os diferentes polímeros utilizados neste trabalho (PVP, PEG, HPC) foram usados no processo de extrusão e esferonização da olanzapina. Foram estudadas as transformações que ocorreram durante o processamento (ambientes húmidos estão envolvidos) e durante a dissolução dos esferóides. Durante a extrusão a olanzapina mostrou hidratar numa mistura de diferentes hidratos apenas quando em presença da celulose microcristalina. A adição de polímeros à formulação, tais como o PVP e a HPC, permitiram a manutenção da olanzapina na sua forma anidra I tanto durante o processamento como durante a dissolução, o que mostrou influenciar de forma significativa a dissolução da mesma. O PEG, por outro lado, mostrou ser incapaz de estabilizar a olanzapina. Os hidratos formados durante o processo de extrusão mostraram afetar as características físicas e mecânicas dos pellets, bem como a dissolução do fármaco. Os diferentes polímeros usados, os seus pesos moleculares e as suas proporções nas formulações revelaram ter impacto na estabilização da olanzapina durante o processo de extrusão, nomeadamente durante a fase de malaxagem.
Em conclusão, a investigação feita no âmbito desta Tese contribuiu para uma melhor compreensão da caracterização das alterações polimórficas e pseudopolimórficas da olanzapina durante o seu processamento e armazenamento. Permitiu ainda perceber em pormenor o impacto das alterações polimórficas e pseudopolimórficas na performance tecnológica e na dissolução da olanzapina, alertando para a importância do seu estudo nas fases de pré-formulação e pré-formulação.
Table 1.1 – Classification of common crystal morphologies for pharmaceutical solids
accepted by the US Pharmacopoeia. ... 4
Table 1.2 – Properties that can be altered by choosing different polymorphic forms ... 5
Table 1.3 – Effects of solvation on drug activity ... 18
Table 2.1 – Physicochemical properties of olanzapine Form I ... 33
Table 2.2 – Hydrogen-bond distances (Å) for different olanzapine crystal forms ... 35
Table 2.3 – Raw materials and respective suppliers ... 41
Table 3.1 – Particle size distribution (µm) of crystalized OLZ FI and FII ... 65
Table 4.1 – Formulations for moisture sorption studies ... 87
Table 4.2 – OLZ dihydrate content in samples stored at 75% RH/ 25ºC, for different days ... 94
Table 4.3 – OLZ dihydrate content present in each sample stored at 93% RH/ 25ºC for different periods ... 94
Table 5.1– Formulations for hydrate conversion studies. ... 110
Table 5.2 – Viscosity measurements of the two most concentrated polymer solutions ... 115
Table 5.3 – Contact angle and standard deviation of the filtered powders (t=180 min) from different solutions (A, B1-B4, C1-C4, D1-D4, E1-E4) and raw materials ... 116
Table 5.4 – OLZ:Polymer molar ratios of investigated systems ... 122
Table 6.1 – Viscosity (η) of different stabilizing media and saturation solubility (S) of OLZ . 135 Table 6.2 – Overview of RESSAS experiments... 136
Table 7.1 – Design of extrusion formulations ... 151
Table 7.2 – The effect of formulation on the extrusion force needed to extrudate the wet masses and analysis of variance of the extrusion force values needed to extrudate the formulations with different periods of resting of wet mass (0h and 6h) ... 160
Table 7.3 – Interquartile range and percentage of pellets within 1.0-1.4 mm (n=3 batches). The percentage of pellets in the 1.0-1.4 mm range was compared between batches and the statistical significance calculated ... 161
Table 7.4 – Analysis of the effect of formulation on the mechanical strength of pellets ... 162
Table 8.1 – Formulations considered in polymer screening and pellets manufacture ... 176
Table 8.2 – Surface energy of OLZ and polymers. ... 183
Table 8.3 – Contact angles of the raw materials and different formulations ... 184
Table 8.4 – Fitting of dissolution models to OLZ release data for pellets ... 187
Table A.1– Values for axis length a, b and c and angles α, β and γ of the unit cell of both forms I and II of olanzapine. Standard errors are represented in the second line. ... 200
Figure 1.1 – Crystal unit cell and its dimensions. ... 3
Figure 1.2 – Free energy phase diagrams for Enantiotropic System (a) and Monotropic System (b) (6). ... 6
Figure 1.3 – Gibbs free energy curves for a component system that presents crystalline and amorphous phase transitions. Monotropic systems (A and C), enantiotropic systems (A and B) with a transition temperature (Tt), and an amorphous and supercooled liquid with a glass transition temperature (Tg). Melting points (Tm), for the crystalline phases are represented by the intersection of the curves for the crystalline and liquid states (28). ... 7
Figure 1.4 – Schematic representation of the reaction coordinate ρ for crystallization in a dimorphic system to show the activated barriers for the formation of polymorphs I and II. ... 8
Figure 1.5 – Schematic solubility diagram for a dimorphic system (polymorphs I and II) showing a hypothetical crystallization pathway at constant temperature. ... 9
Figure 1.6 – The rates of nucleation as functions of supersaturation for a dimorphic system. ... 10
Figure 1.7 – Schematic solubility/ supersolubility diagram. The metastable zone specifies the default region for operating an industrial crystallization process. The operating region of batch crystallization is bound by the solubility curve and the metastable limit. The concentration temperature profile (control trajectory, dashed line) lies within this region (36)... 12
Figure 1.8 – Mechanisms for crystal nucleation. ... 13
Figure 1.9 – Solubility diagram for a system of different solvates showing transition temperatures, Tt1 and Tt, between the anhydrate and the hydrates (78). ... 19
Figure 2.1 – Olanzapine molecule (A) and one example of packing (B). ... 32
Figure 2.2 – Olanzapine crystal building blocks in (a) Form I, (b) dihydrate B, (c) dihydrate D and (d) dihydrate E [adapted from (18)] ... 36
Figure 2.3 – Chemical structure of polyvinylpyrrolidone. ... 36
Figure 2.4 – Chemical structure of polyethylene glycol. ... 37
Figure 2.5 – Chemical structure of hydroxypropyl cellulose. ... 38
Figure 2.6 – Chemical structure of hydroxypropyl methylcellulose. ... 39
Figure 2.7 – Chemical structure of microcrystalline cellulose. ... 40
Figure 2.8 – Schematic representation of a ram extruder. ... 44
Figure 2.9 – Pilot unit designed for high-pressure extraction (RESS-technique). ... 45
Figure 2.10 – Schematic representation of a heat flow DSC showing the sample and the reference pans location within the same furnace. ... 46
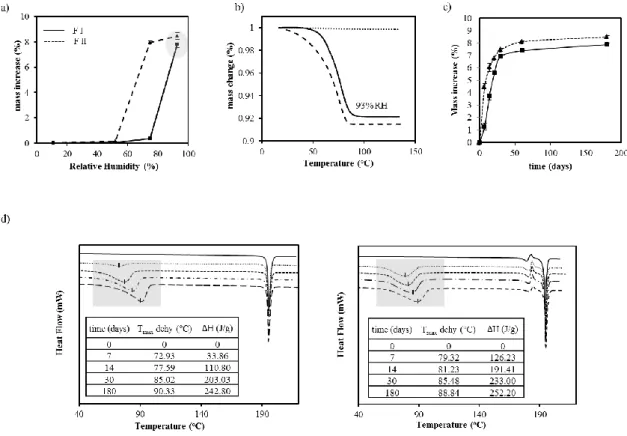
Figure 3.1 – Characterization of olanzapine forms by different techniques: ... 67
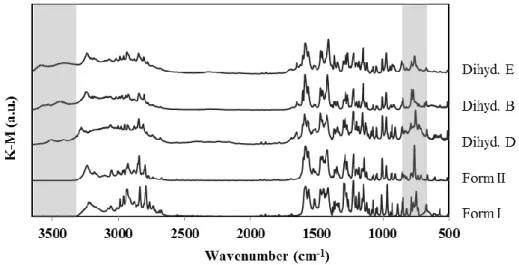
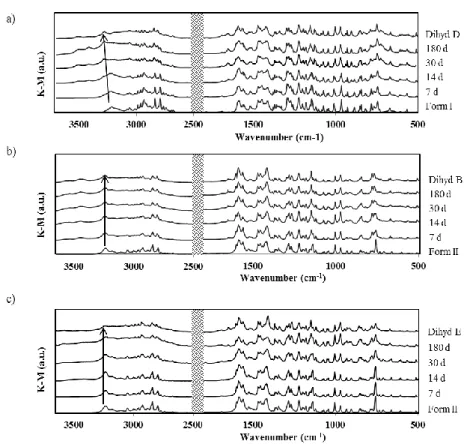
Figure 3.2 – DRIFT spectra of anhydrous OLZ Form I, Form II, dihydrate D (dihyd D), dihydrate B (dihyd B) and dihydrate E (dihyd E). ... 68
Figure 3.3 – Mass variation and calorimetric evalutation of samples ... 70
Figure 3.4 – X-ray diffractograms of OLZ Form I (FI) and OLZ Form II (FII) stored for different time periods (7, 30 and 180 days) at 93 % RH (a and b, respectively); (c) OLZ Form II (FII) stored at 75 % RH. ... 71
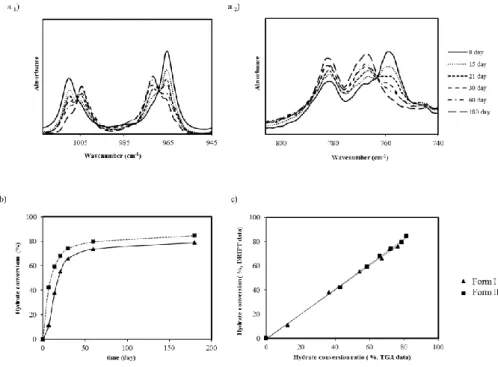
periods (7, 30, 180 days) at 93 % RH (a and b, respectively); (c) OLZ FII stored at 75 % RH. ... 72 Figure 3.6 – a) Changes on IR spectra of olanzapine Form I (a.1) and Form II (a.2) during
storage at 93% RH (a); Calculation of hydrate conversion of form I (▲) and II (■) at 93% RH from the DRIFT data using a PLS model (b); Hydrate conversion when two different methodologies were considered (TGA and DRIFT) (c). ... 73 Figure 3.7 – Dissolution profiles of OLZ Form I (-■-), OLZ Form II (-▲-), OLZ Form I
stored for 180 days at 93% RH (--■--) , OLZ Form II stored for 180 days at 93% RH (--▲--) considering the mass of anhydrous olanzapine. The dissolution tests were performed for tablets formulated with lactose (left) and with MCC/ lactose (right). ... 75 Figure 3.8 – IR spectra of OLZ FII and FI after being suspended in water for different time
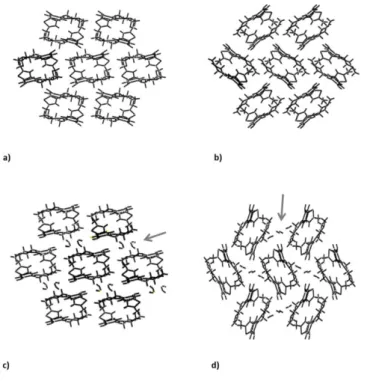
periods (a); IR spectra (b) and XRPD diffractograms (c) of OLZ FI and FII suspended in water for 24h. ... 76 Figure 3.9 – Crystalline structure of form I (a), II (b), dihydrate D (c) and B (d) of
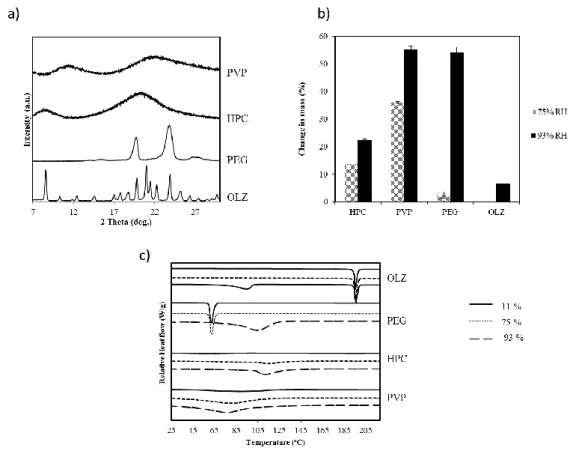
olanzapine. Arrows highlight water molecules. ... 79 Figure 4.1 – XRPD pattern of the inicial excipients (a), their change in mass after exposed
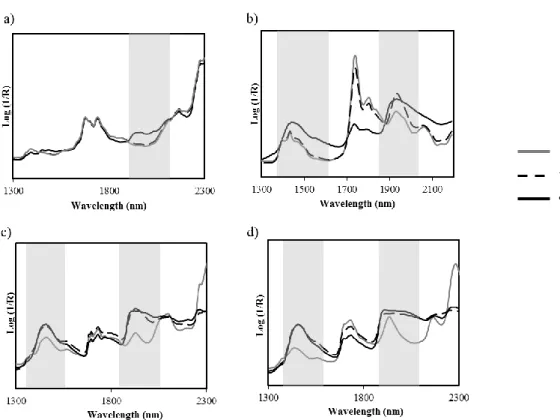
to high levels of humidity (b) and their thermal behavior after 28 days of storage at each environmental conditions (c). ... 90 Figure 4.2 – NIR spectra of OLZ (a); PEG (b), HPC (c), PVP (d) stored at different
humidity conditions (11% (__);75% RH (….); 93% RH (__)) for 28 days. The main shifts are represented with a grey bar. ... 91 Figure 4.3 – XRPD of physical mixtures (A, B1, C1and D1) stored 28 days at 75% RH (a)
and 93% (b). ... 92 Figure 4.4 – FTIR characterization of OLZ samples (700-1300 cm-1) after 28 days of
storage at different RH (a), dihydrate conversion of olanzapine when stored at 75% RH and 93% RH (b) and thermograms of olanzapine after exposure to different RH for different time periods (c). ... 93 Figure 4.5 – Thermal analysis of the drug:excipient samples after being kept at different
conditions of storage during 28 days. a) Formulation B1 (OLZ:PEG); b) Formulation C1 (OLZ:HPC); c) Formulation D1 (OLZ:PVP) ... 95 Figure 4.6 – SEM pictures and MO with polarized light pictures of the anhydrous starting
materials (a), formulation A (b), formulation B2 (c), formulation C2 and D2 (e). ... 96 Figure 4.7 –Themograms and the respective melting temperature and enthalpy of OLZ (a)
in different formulations before (powders, p) and after (compacts, c) compaction; b) shows the X-ray diffractograms of OLZ before and after compaction. ... 97 Figure 4.8 –OLZ dihydrate D content in formulations A, B1, C1 and D1 (a) and
formulations B2, C2 and D2 (b), stored for 7 days and 28 days at 93% RH. The figure includes the formulations as powders or compacts. ... 98 Figure 4.9 – FT-Infrared spectra of powders recovered after 15, 45 and 60 min from the
different suspensions. The main shifts are represented with a grey bar. ... 99 Figure 5.1 – Diffractograms and thermograms of powders filtered from the different
suspensions after 180 min. Grey bar highlights the characteristic peaks of OLZ hydrates. ... 113
Figure 5.3 – FT-Infared analyzes of OLZ recovered from the polymeric solutions A, B1 and C1 ... 114 Figure 5.4 – SEM micrographs of (a) OLZ Form I (raw material) ... 115 Figure 5.5 – OLZ saturation solubility measured in water ... 117 Figure 5.6 – OLZ molecule showing the H responsible for the peak at 4.98 ppm (a) ... 118 Figure 5.7 – Higher magnification of proton NMR spectra for pure OLZ and the
OLZ:Poymer mixtures within the range of 5.40-4.80 ppm (a). ... 119 Figure 6.1 – Functional sketch of the extraction equipment. ... 129 Figure 6.2 – Schematic of expansion setups for a) classic RESS process and b) RESSAS
process. ... 130 Figure 6.3 – SEM images of unprocessed (left) and RESS (right) OLZ. ... 133 Figure 6.4 – Particle size distribution of a) RESS OLZ measured in aqueous suspension
with DLS; b) unprocessed OLZ powder measured in aqueous suspension with laser diffractometry (LD). ... 133 Figure 6.5 – DSC Thermograms of unprocessed OLZ (solid line) and RESS OLZ (dotted
line). ... 134 Figure 6.6 – Second derivative of FTIR spectra of anhydrous, amorphous and RESS OLZ. ... 135 Figure 6.7 – Medium Di values and spans of nanosuspensions produced with different
stabilizing agents directly after production. ... 137 Figure 6.8 – Infrared spectra of Flocculated material recovered from the Pbs 80 and PEG
suspension after resting 8h at room temperature. ... 137 Figure 6.9 – Comparison of D50 values and spans immediately after production and after
freeze drying; D50 values reported for HPMC and PEG+SLS are medium Di50; values reported for Psb and PEG are medium Dv50. ... 138 Figure 6.10 – Second derivative of FTIR spectra of Freeze-dried olanzapine (OLZ) in
flocculated nanosuspensions (fl NS) or freeze-dried nanosuspensions (fd NS) with different stabilizing agents. ... 139 Figure 6.11 – Comparison of nanosuspensions (NS) before and after freeze-drying (FD)
with and without the addition of SLS. ... 140 Figure 6.12 – Dissolution profiles in phosphate buffer pH 6.8, USP apparatus II (Paddle).
Dissolution profile of RESSAS OLZ suspended in different stabilizers is compared to the dissolution profile of unprocessed OLZ. ... 141 Figure 7.1 – The diffraction patterns for the three forms of olanzapine calculated from
single-crystal data of anhydrous olanzapine form 1 (OLZ FI), olanzapine dihydrate B (OLZ dihydr. B) and olanzapine higher hydrate (OLZ Higher hydr.) are followed by the XRPD pattern of (a) raw materials olanzapine raw materials (OLZ RM, PEG and MCC), (b) wet mass C1, D1 and E1 and (c) wet mass C2, D2 and E2. The characteristic diffraction peaks of OLZ dihydrate B and OLZ higher hydrate are indicated with a grey bar. ... 154 Figure 7.2 – 2nd derivative of FTIR of the region 958-972cm-1 of wet mass C (15 OLZ: 75
MCC, a) and D (30 OLZ: 60 MCC, b) at different time periods (0, 10, 60, 360 min). Different OLZ crystal forms are shown in c). ... 154
XRPD (c) The particle size distribution of OLZ raw material(RM) and formulation E (t=360 min) is represented in d) ... 156 Figure 7.4 – Diffractograms of anhydrous OLZ form I, OLZ dihydrate-B, OLZ higher
hydrate, wet pellets C1, wet pellets C2, and pellets C2 dried for 60 min and 180 min. The characteristic diffraction peaks of OLZ dihydrate B and higher hydrate are indicated with a grey bar. ... 157 Figure 7.5 – Infrared spectra (A1) and second derivative of infrared spectra (A2) of: (a)
anhydrous OLZ F1; (b) wet pellets C1; (c) wet pellets C2; (d) pellets C1 dried for 60 min; (e) pellets C2 dried for 60 min; and (f) dihydrate B. ... 158 Figure 7.6 – SEM micrographs of formulation C1 t=0 min (1) and C2 A t=360 min (2).
The pellet’s surface is shown in figure a) and the cross section of pellets is represented in b). ... 159 Figure 7.7 – (1) Extrusion force necessary to extrudate wet masses; (2) pellet size
distribution; and (3) crushing forces necessary to crush the pellets produced from the formulations (a) B, (b) C, and (c) D. ... 163 Figure 7.8 – Moisture content (% wt/wt) of pellets: (a) A1 and A2, (b) B1 and B2, (c) C1
and C2 and (d) D1 and D2, dried for different periods of time. Samples measured with an Infrared dryer (n=6). ... 164 Figure 7.9 – Release of olanzapine from pellets: (a) C and (b) D dried for 60 min and from
(c) pellets C and D dried for 180 minutes ... 165 Figure 8.1– Diffractograms of 6 formulations before wetting, after wetting and after
drying. The wet samples were analyzed after storage in a sealed container for 360 min. ... 179 Figure 8.2– Spectra (FTIR) in the region (990-950 cm-1) for the different OLZ:polymer
formulations. ... 180 Figure 8.3 – Micrographs of wet masses for formulations A, B1, C and D1. ... 181 Figure 8.4 – Thermograms of formulations A (A), B1 (B, curves 1-3), B2 (B, 4-6), C (C),
D1 (D, 1-3) and D2 (D, 4-6). ... 182 Figure 8.5 – Diffractograms of formulations as physical mixtures (a), ... 185 Figure 8.6 – Dissolution profiles of OLZ from pellets (top) and Spectra (FTIR) analysis
API Active pharmaceutical ingredient
DRIFT Diffuse reflectance infrared Fourier transform
DSC Differential scanning calorimetry
FTIR Fourier transform infra-red
HPC Hydroxypropyl cellulose
HPMC Hydroxypropylmetyl cellulose
HSM Hot stage microscopy
MCC Microcrystalline cellulose
mDSC Modulated temperature DSC
MW Molecular weight
OLZ Olanzapine
PbS Polysorbate
PEG Polyethylene glycol
PM Physical mixture
PVP Polyvinylpyrrolidone
RH Relative humidity
Rpm Rotation per minute
SD Standard deviation
SEM Scanning electron microscope
Tg Glass transition temperature
TGA Thermogravimetric analysis
Tm Melting temperature
UV Ultraviolet
The studies on pre-formulation of drugs are part of the official requirements for the investigation and development of new drugs and new drug applications, since these studies assess the physicochemical properties and the biopharmaceutical performance of the APIs.
Pharmaceutical companies have been paying special attention to research on phase transformations of the APIs because such transformations could lead to complications on the bioavailability, manufacturability and stability of the formulated product. Therefore, the study of polymorphic and pseudopolymorphic transformations of the drugs, alone or in the presence of excipients during processing and storage, has to be undertaken since an incomplete characterization of a drug substance can lead to problems on the manufacturability and bioavailability of the final product.
The aim of this research was the production and characterization of different olanzapine crystal forms (polymorphs and pseudopolymorphs), assessing the stability of each crystal form during storage and processing, always with the clear objective of understanding the impact of processing on the technological properties, particularly on the dissolution rate of the drug.
This goal was reached by:
Controlled production and characterization of defined polymorphic forms;
Understanding the polymorphic transitions to allow the anticipation of stability of each polymorph as a raw material or as a component of an extrudate;
Understanding the potential interactions between the API and the excipients, namely the stabilization effect that the excipient might have on the polymorph;
The identification of environmental conditions that affect the stability of polymorphs (e.g. humidity, in the air or in the excipients while being processed, and temperature, both room and processing temperatures on drying);
Study of the impact of particle size reduction techniques, namely SCF technology, on the technological properties and dissolution of olanzapine;
The identification of polymorphic forms at each moment of the manufacturing of extrudates and tablets, as well as the identification of the advantages / disadvantages on using a particular polymorph of the API on the preparation of an extrudate or tablet
This thesis is divided into 8 chapters. Since olanzapine has a high capacity to interact with water molecules and form hydrates, firstly it was aimed to understand the role of water on the stability of olanzapine. Then we decided to mix olanzapine with certain excipients which are known to affect the water absorption capability of drugs when physically mixed or processed with them. Two pharmaceutical processes involving the utilization of water were studied, namely, rapid expansion of supercritical solutions into aqueous solutions and wet extrusion. Hence, the organization and objectives of each chapter can be briefly summarized, as follows:
Chapter 1 – Describes the state of the art and provides the main concepts necessary to
understand and discuss the work presented in the subsequent chapters;
Chapter 2 – Summarizes the materials used, namely the API and excipients, throughout the
thesis. The different technologies considered for producing and characterizing the different polymorphs of olanzapine and dosage forms are referred in this chapter, together with a short description of the characteristics of the equipments used.
Chapter 3 – Provides a thorough investigation of the different olanzapine forms (anhydrates
and hydrates) considered in the thesis. Differentiation on the physical stability of 2 anhydrous forms and their ability to form hydrates, as function of different relative humidity, is studied. Research question: Can anhydrous olanzapine hydrate in the presence of high humidity environments? What is the impact of the hydrate conversions on the dissolution performance of this drug?
Chapter 4 – Explores the relative humidity conditions that could lead to the hydrate formation
of olanzapine Form I (the most stable form) when physically mixed with different excipients (as powders or compacts) that present different crystallinities and moisture uptake abilities. Research question: May excipients have a role on hydrate conversion kinetics of olanzapine over storage? What is the impact of compaction of olanzapine and excipients on the pseudopolymorphic transformations of olanzapine?
Chapter 5 – Gives an insight into the role of polymers on stabilization of olanzapine Form I
(the most stable form) in aqueous environments.
Research question: How polymers may stabilize anhydrous olanzapine in aqueous suspensions?
Chapter 6 – Provides an evaluation of the effect of particle size reduction of olanzapine by
supercritical fluid (SCF) technology on the solid-state form of olanzapine.
Research question: Can SCF technology reduce the particle size of olanzapine without affecting its crystal structure? Can SCF technology produce olanzapine particles with a submicron size and increased dissolution rate? What is the impact of excipients in the stabilization of submicron particles of OLZ?
transformation of olanzapine, with a special focus on the impact of those transformations on the mechanical properties of the final product (pellets).
Research question: Can the process of extrusion lead to hydrate changes of olanzapine solid-state form, with an impact on physical and mechanical properties of the extrudates?
Chapter 8 – Explores how excipients used in extrusion/ spheronisation of wet masses of
olanzapine can avoid pseudopolymorphic changes of olanzapine, with an impact on dissolution. Research question: May excipients have a role on the stabilization of olanzapine during wet extrusion? What is the impact of hydrate conversion on the final dissolution of olanzapine from the pellets?
Chapter 9 – Presents the main conclusions and suggests future work.
Hypothesis
Polymorphic/pseudopolymorphic changes of olanzapine which occur during storage and processing with impact on drug’s performance can be identified, characterized and prevented.
Chapter 1 - Introduction
1.1 Introduction to solid-state properties of materials used in pharmacy
The majority of drug entities are encountered in the solid state (1). A full characterization of the solid characteristics of an active pharmaceutical ingredient (API) is recognized as an essential part of pre-formulation research, in order for the quality of the manufacturing process, the drug’s performance and its bioavailability are maintained in its final dosage form (2). A solid state API can be classified based upon the order of its molecular packing into 2 major groups: the crystalline and the amorphous states.
1.1.1 Amorphous State
An amorphous structure has a short-range molecular order (3). The increased free volume, molecular mobility and the enthalpy of the amorphous state results in a structure with higher solubility, chemical reactivity and water vapor sorption when compared to the crystalline state (4). The higher solubility of an amorphous API, for example, is an advantage when rapid dissolution and absorption rates are required to obtain an increase of the bioavailability of the drug (5). However, the amorphous state is in a non-equilibrium state, thus an amorphous API may crystallize during storage or during a manufacturing process (6). The most used methods for large-scale production of amorphous materials at the moment are freeze-drying, spray-drying and melt extrusion, being freeze-spray-drying the most popular method, resulting from the easy control of operation parameters throughout the production of amorphous materials. Usually, excipients are added to the formulations to improve the stability of amorphous drug formulations (7).
1.1.2 Crystalline state
A crystalline state requires an ideal crystal, which is composed of atoms, ions or molecules arranged in a periodic 3-dimensionl pattern. The 3-dimensional array is called a lattice. The smallest periodic volume is defined as a unit cell (Figure 1.1). The unit cell has an orientation and shape defined by the translational vectors, a, b, and c and therefore has a definite volume, V, that contains the atoms and molecules necessary to form the crystal (8).
Figure 1.1 – Crystal unit cell and its dimensions.
There are seven possible crystal systems (cubic, tetragonal, orthorhombic, rhombohedral, hexagonal, monoclinic, triclinic) which are described by the relationships between the axis lengths, a, b, and c, of the unit cell and between the angles, , , and γ of the unit cell (8, 9). For instance, if the three edge lengths are identical and all corner angles are 90º, then the crystal belongs to the cubic system.
In any kind of repeating pattern, it is useful to have a convenient way of specifying the orientation elements relative to the unit cell. This is carried out by assigning to each element a set of integer numbers, known as Miller index. Miller indices are a notation for describing directions and labelling planes in lattices and crystals. The basis for determining the index is the unit cell (the smallest three-dimensional volume element from which the crystal can be constructed). Each face is designated with three integers, h, k and l, which are the inverse of intersections of that face with the crystallographic axes a, b and c. Faces that are parallel to a crystal axis are given the Miller index of 0.
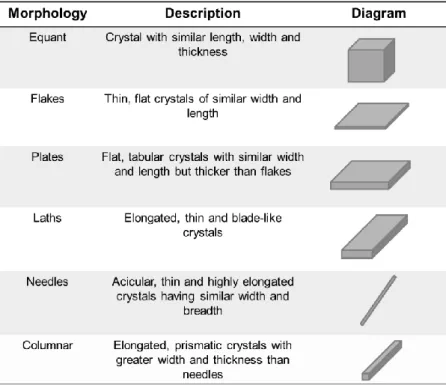
The external shape of a crystal, also termed habit, form or morphology, is determined by its internal structural symmetry. In practice, crystal morphology is usually described in terms of length, width and thickness. Six basic crystal shapes have been reported and crystals having these shapes can occur in any of the seven systems (10). In the pharmaceutical area the classifications of crystal shapes adopted by either British Standard (BS 2955:1993) or the US Pharmacopoeia (monograph 776, Table 1.1) (11) are often used for routine microscopic studies of solid materials (12-14).
The faces that can potentially develop into a crystal are determined by the symmetry properties of the underlying lattice, but the sizes of the faces that actually develop under specific conditions – and thus the overall shape of the crystal – are determined by the relative growth rate of the various faces. The slower the growth rate the larger the face.
Powders that have been milled may not present any evidence of the original shapes of the crystal, and the particles are likely to be irregularly shaped and have angular fragments (10).
Table 1.1 – Classification of common crystal morphologies for pharmaceutical solids accepted by the US Pharmacopoeia.
1.2 Polymorphism
A crystalline substance has polymorphism (from Greek: poly-multiple, morfe-shape) when it can crystallize in different crystal packing arrangements and/or different conformations (15). Polymorphism in molecular crystals can be divided into two categories: conformational and packing polymorphism. In conformational polymorphism, the molecules are flexible and can adopt more than one conformation in the solid state (16). Since pharmaceutical compounds generally contain flexible moieties in their molecular structures, there are numerous examples of conformational polymorphs. Two well-known examples of drugs that exhibit this type of conformational polymorphism are the antidepressant venlafaxine hydrochloride (17) and the antipsychotic olanzapine (18). Packing polymorphism emerge from different possible packing arrangements in the three dimensional space of conformational rigid molecules. Forms I and II of acetaminophen are the best known example of packing polymorphs (19, 20).
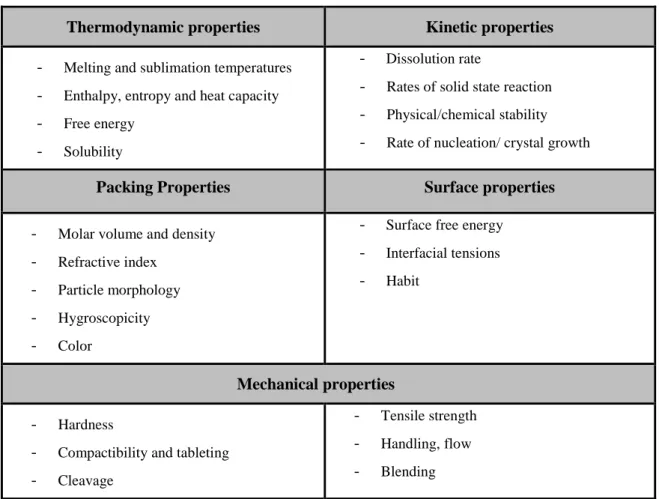
Polymorphs have different relative intermolecular and/or inter atomic distances, or unit cells, resulting in different physical and chemical properties, as shown in Table 1.2 (21).
Table 1.2 – Properties that can be altered by choosing different polymorphic forms (21)
Thermodynamic properties Kinetic properties
- Melting and sublimation temperatures
- Enthalpy, entropy and heat capacity
- Free energy
- Solubility
- Dissolution rate
- Rates of solid state reaction
- Physical/chemical stability
- Rate of nucleation/ crystal growth
Packing Properties Surface properties
- Molar volume and density
- Refractive index
- Particle morphology
- Hygroscopicity
- Color
- Surface free energy
- Interfacial tensions
- Habit
Mechanical properties
- Hardness
- Compactibility and tableting
- Cleavage
- Tensile strength
- Handling, flow
- Blending
The different properties of a polymorph can have an impact in the drug’s pharmaceutical properties such as bioavailability, processability and manufacturability. Some of the most important properties during drug discovery and development are solubility in water, dissolution and bioavailability. For a drug whose absorption into the body is only limited by its dissolution, differences in the apparent solubility of the various polymorphic forms are likely to affect the bioavailability of the drug (22). It is the goal of pre-formulation scientists to understand and characterize polymorphs of a pharmaceutical solid and select a form with the best combination of desired properties to proceed to the formulation stage (23). Furthermore, regulatory agencies declare that the understanding and controlling of the physical forms of a polymorphic drug substance have to be controlled, especially if drug bioavailability is affected by its polymorphism (24) (25).
1.2.1 Polymorphic systems
The term “polymorphic transition” refers to the interconversion between polymorphic forms. The stability relationship between a pair of polymorphs can be categorized as Monotropic or Enantiotropic, depending on their stability with respect to a range of temperatures and pressures. When one polymorph is stable at all temperatures and pressures below the melting point and all other polymorphs are unstable, the polymorphic system is
referred as Monotropic. If one of the polymorphs is stable (i.e., has lower free energy and solubility) over a certain temperature range and pressure while the other polymorph is stable over a different temperature range and pressure, then the two polymorphs are said to be Enantiotropes (Figure 1.2) (6, 26). Therefore, understanding thermodynamic and interconversion relationships between polymorphs is paramount to solid state characterization.
Figure 1.2 – Free energy phase diagrams for Enantiotropic System (a) and Monotropic System (b) (6).
The question that still needs to be addressed is why and how polymorphs do form. Like most chemical processes, crystallization in polymorphic systems is governed by a combination of thermodynamic and kinetic factors.
1.2.2 Thermodynamics
Systems tend to move toward a thermodynamically equilibrated state, i.e., in the polymorphic systems the metastable forms are eventually going to transform into the most stable state. Thermodynamics provides information about the relative thermodynamic stability between different polymorphic forms and the conditions and the direction in which a transformation can occur. The main approaches used to assess thermodynamic stability relationships of polymorphs are based on thermodynamic rules (distinguishes between monotropic and enantiotropic systems) (26) and free energy change–temperature diagrams (also allows for calculation of the transition temperature) (27, 28).
The relative thermodynamic stability of solids and the driving force for a transformation at constant temperature and pressure depends on the difference in Gibbs free energy (ΔG) between the different forms. When the difference is negative, the transformation may occur spontaneously and a change has the potential to continue to occur as long as the free energy of the system decreases, unless blocked by a kinetic barrier. If ΔG is equal to zero the system is at equilibrium with respect to the transformation and the Gibbs energy of the two phases is the same. In systems where the difference in Gibbs energy is positive then the transformation is not possible under the specific conditions
The thermodynamic conditions to either have equilibrium between phases or different transformations at constant pressure for a single component system that exists in both amorphous and crystalline states are shown in the Gibbs free energy plot (Figure 1.3). This diagram shows that polymorph C is more stable than A, since ΔG=GC−GA is lower than 0, thus allowing for a transformation from polymorph A to C. Amorphous or disordered solids of the same compound have a higher free energy than the crystalline states because of the higher enthalpy and entropy of the glass (28) .
In the G versus T diagram, the intersection points show phases that coexist in equilibrium, crystal and liquid states corresponding to melting temperatures, crystalline states at transition temperatures, and both amorphous and supercooled liquid states at glass transition temperatures.
Figure 1.3 – Gibbs free energy curves for a component system that presents crystalline and amorphous phase transitions. Monotropic systems (A and C), enantiotropic systems (A and B) with
a transition temperature (Tt), and an amorphous and supercooled liquid with a glass transition temperature (Tg). Melting points (Tm), for the crystalline phases are represented by the intersection
of the curves for the crystalline and liquid states (28).
1.2.3 Kinetics
Thermodynamic theory, as referred before, refers that crystallization must result in an overall decrease in the free energy of the system. This means that, in general, the crystal structures that appear will be those with the larger (negative) lattice (free) energies. However, the routes to the final stable state are dependent on the kinetics as well as other factors as shown below (29).
Figure 1.4 – Schematic representation of the reaction coordinate ρ for crystallization in a dimorphic system to show the activated barriers for the formation of polymorphs I and II.
The traditional energy-reaction diagram (Figure 1.4) shows the kinetic factors involved in the nucleation process. This diagram represents G0 (the free energy per mole of a solute) in a supersaturated fluid which transforms by crystallization into one of two crystalline products, I or II, in which II is the more stable (GI>GII).
A transition from the initial state G0 to state I or II will depend on the energy barrier and according to the reaction pathway in Figure 1.4, the height of the energy barrier for structure II (G*II – G0) is higher than that for B (G* I- G0). Since the rate of nucleation is related to the height of the energy barrier on the reaction path, I will nucleate at a faster rate than II (29).
In general one can say that the probability of appearance of a particular Form I is given by equation ( Eq. 1.1) in which ∆G is the free energy for forming the polymorph i and R is the rate of the kinetic process associated with the formation of a crystal by molecular aggregation. Following the above argument one could equate the rate process with the rate of nucleation (J) of Form I. If all polymorphs have the same rates of nucleation, then their appearance probability would be restrained to the relative free energies of the possible crystal structures.
𝑷 (𝒊) = 𝒇(∆𝐆, 𝐑) Eq. 1.1
According to the classical expression of Volmer (30), the rates of nucleation are related to various thermodynamic and physical properties of the system, such as, the bulk and surface free energies (γ), temperature (T), degree of supersaturation (σ) or solubility (hidden in the pre-exponential factor A) which will not be the same for each structure but will correctly reflect the balance between changes in bulk and surface free energies during nucleation. This effect is shown in Equation 1.3 (2), which relates the rate of nucleation to the above parameters (ν is the molecular volume).
𝑱 = 𝑨𝒏 𝒆𝒙𝒑 [−𝟏𝟔𝝅𝜸𝟑𝒌𝟑𝑻𝟑𝟑𝒗𝝈𝟐𝟐] Eq 1.2
Therefore, the tradeoff between kinetics and thermodynamics is not absolutely obvious. Figure 1.5 shows a schematic solubility diagram for a monotropic dimorphic system. It is noted that, for the occurrence given by solution compositions and temperatures that lie between the Form I and II solubility curves, only polymorph II can crystallize. Nevertheless, the outcome of an isothermal crystallization that follows the crystallization pathway indicated by the blue vector in Figure 1.5 is not so clear. In this case, the initial solution is now supersaturated with respect to both polymorphic structures, with thermodynamics favoring Form II (29).
Figure 1.5 – Schematic solubility diagram for a dimorphic system (polymorphs I and II) showing a hypothetical crystallization pathway at constant temperature.
In the 19th century, authors working in the area of science of crystallization, observed that compounds could be obtained in more than one solid state form and a vast number of cases were documented about the fact that a metastable form of a compound tended to first crystallize prior to transformation into a more stable form. These observations led Ostwald in 1897 to propose the Law of Stages, where he stated that crystallization from melts and solutions yields an initial metastable form which is ultimately replaced by a stable form. This means that when a given compound leaves its initial metastable state it does not seek out the most stable state, but transforms instead into the nearest metastable one, that is, the one that can be reached without loss of free energy (28).
Later, Stranski and Totomanov (31) provided an explanation for this phenomenon developed in terms of the kinetics of transformation. In this model, the determining factors are the relative rates of nucleation and crystal growth for the stable and metastable forms. The differences between the various parameters may be theoretically justified by the fact that, at a specific working temperature, the rate of nucleation is higher for the metastable product. This situation would cause the metastable phase to preferentially nucleate. In a distinct scenario, the
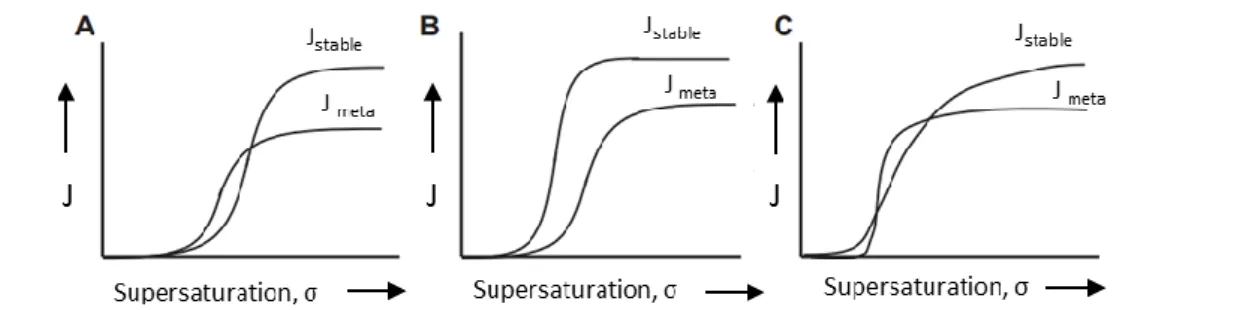
rates of nucleation may be more or less the same for the two forms, but if the metastable phase has a higher rate of growth, then this form would eventually predominate in the isolated product (32). Figure 1.6 shows the rates of nucleation as functions of supersaturation for a dimorphic system. As it can be seen in Figure 1.6, the rate of nucleation of the metastable Form I is never higher over the entire supersaturation ranges. This indicates that there may be conditions in which the nucleation rates of the two forms are similar hence their appearance probabilities are nearly equal. Under such conditions we might expect the polymorphs to crystallize concomitantly (29).
Figure 1.6 – The rates of nucleation as functions of supersaturation for a dimorphic system. Note that both solutions A and C allow for simultaneous nucleation of the forms at supersaturation
levels corresponding to the crossover of the curves (29).
1.3 A comprehensive understanding of crystallization
Crystallization is defined as a phase change that leads to the formation of a crystalline solid (33). The most frequent type of crystallization is crystallization from solution, in which a material that is a crystalline solid at a temperature of interest is dissolved in a solvent while crystallization is induced by changing the state of the system in some way that reduces the solubility of the solute in the solvent. Commonly, this kinetic process is described in terms of two distinct steps: nucleation and crystal growth. The properties of the crystals obtained are the result of the kinetic relationship between these two processes. This sub-section aims on the introduction of the basic concepts of nucleation and crystal growth from solution and impact of these phenomena on the properties of pharmaceutical materials, including the parameters that can influence crystallization.
1.3.1 Driving force for crystallization
Crystallization can occur over the concentration range limited by the equilibrium composition of the system at specified conditions (Figure 1.7). Thermodynamic equilibrium is achieved when the solution is saturated with respect to the solute, that is, the concentration of the solution represents the solubility value for that solid phase. Under these conditions the rates of dissolution and crystallization are equal. When the solute concentration is below the
saturation limit (solid line) a solution is termed under-saturated and the existing crystals will dissolve. The system must be carried into a non-equilibrium state where the concentration of the solute exceeds its equilibrium concentration (i.e., the solution is supersaturated) for the crystallization to occur. The driving force for crystallization is going to be the degree of supersaturation, which is defined as the difference between solution concentration and saturation concentration at a specific temperature. Commonly, the methods which are used to create supersaturation in a solution are: temperature change, solvent evaporation, chemical reaction, pH change, and changes in solvent composition (34).
Supersaturation leads to the creation of metastable (far from equilibrium) liquid state and crystallization provides a means to reduce the free energy of the system to the most stable state (equilibrium) (35). The metastable limit determines the compositions at which spontaneous crystallization occurs. The region between the saturation limit and the metastable limit is named metastable zone. The metastable zone width varies depending on the purity of the system, the thermal history of solution and the density of foreign particles present in the solution. It is, therefore, important to know the metastable zone since it defines the working area for designed crystallizations (34). In order to produce just the required product, the concentration and temperature of the crystallization medium must be narrowly controlled within this zone. If the solubility line is crossed to the left, the seed crystals will dissolve and if the metastable zone limit is crossed to the right, spontaneous nucleation will take place and could result in unwanted crystal forms (34, 36). The kinetics of nucleation and crystal growth are strongly dependent on supersaturation (37, 38).
The metastable zone specifies the default region for operating an industrial crystallization process to avoid uncontrolled sizes (36). The solution has to achieve a certain concentration-temperature point where spontaneous nucleation occurs – this is the limit of the metastable zone.
Figure 1.7 – Schematic solubility/ supersolubility diagram. The metastable zone specifies the default region for operating an industrial crystallization process. The operating region of batch crystallization is bound by the solubility curve and the metastable limit. The concentration
temperature profile (control trajectory, dashed line) lies within this region (36).
1.3.2 Nucleation
The step between the generation of supersaturation and initiation of nucleation is called the induction period. The length of this period depends on temperature, pressure, presence of impurities or seeds, and mechanical disturbances. The presence of seeds and increased supersaturation decrease the length of the induction period (39).
Crystal nucleation encompasses the aggregation of dissolved molecules in the supersaturated solution into organized clusters (embryos) thus developing a surface that detach them from the environment. Nucleation can be either homogeneous or surface catalysed (Figure 1.8). Homogeneous nucleation which occurs spontaneously in bulk solutions seldom occurs in volumes larger than 100 μl, as most solutions contain random impurities that may induce nucleation, so it is the usual mechanism in small scales (40, 41). Surface catalysed nucleation can be promoted by surfaces of the crystallizing solute (secondary nucleation) or by surface/interface of different composition than the solute may induce nucleation (heterogeneous nucleation) by decreasing the energy barrier for the formation of nuclei (35).
Surfaces that promote heterogeneous nucleation may be introduced into the crystallization solution intentionally (with the goal of controlling crystal form of the product) (28) or unintentionally (dust and other impurities), or they can be an inevitable part of the process (crystallization vessel, vessel-solution interface and the solution-air interface). Heterogeneous nucleation is of practical importance in drug formulations, as excipients may provide the surfaces or interfaces necessary to promote nucleation. Moreover, heterogeneous nucleation happens at low driving forces and the favourable dissolution properties of the metastable drug may be lost due to the fast nucleation of the stable form (42).
Figure 1.8 – Mechanisms for crystal nucleation.
The intentional addition of surfaces that catalyse nucleation, into crystallization solutions, is known as “seeding”. Commonly, seeding is carried out by introducing crystals of the solute that have the desired crystal structure that is preferred to obtain in the final product (43). Seeding techniques can be performed with different goals, namely, to initiate crystallization, to control particle size (normally when larger crystals with uniform size distribution are required), to control a polymorphic form, to obtain crystals of high purity and perfection, desired orientation and with a sufficient size for crystal structure determination by X-ray diffraction (34).
1.3.3 Crystal Growth
When a nucleus overcomes a certain critical cluster size it becames stable enough to grow into macroscopic crystals. The process of crystal growth is a multi-step process which includes, (i) transport of the growth units to the impingement site, which may not be the final growth site, (ii) adsorption of the growth units at the impingement site, (iii) diffusion of the growth units from the impingement site to the growth site, and (iv) incorporation into the space lattice to form the crystal structure. The mechanism of crystal growth can be volume-diffusion controlled or surface-integration controlled. In particular, the surface-integration can occur as continuous or by layers crystal growth. The three dimensional structure and crystal defects can also influence the growth rates and thus determine the interaction between surface and solution at a molecular level (44).
1.3.4 Factors that influence nucleation and crystal growth
Previous studies have established that several factors such as solvent, temperature, concentration, pH, agitation and surfaces area and type in contact with growth solutions may influence nucleation and growth of crystals (44, 45).
Solvents
Solvents have a strong influence on the habit of crystalline material because they can preferential adsorb onto the different surfaces or facets of crystals as they develop, in this way hindering the deposition of solute molecules differentially on the different surfaces. Solvents may change the interfacial tension, an increase in the interfacial tension leads to a decrease on the growth rate. During the removal of solvent molecules, the face where the solvent molecules are more adsorbed will grow slower than the faces where the solvent molecules are less strongly adsorbed (46).
Temperature
Temperature can control nucleation and crystal growth by manipulating the solubility and supersaturation of the material (47). When a certain compound is more soluble at high temperature, slow cooling is a commonly used approach for crystallization of saturated solutions. On the other hand, slow warming can be applied if the compound is less soluble at higher temperatures. The approach of slow cooling or warming allows the thermodynamically most stable polymorph to form under conditions where the selectivity is the highest for nucleation and growth of that most stable form. By opposition, rapid cooling frequently generates nucleation and growth of several different polymorphs, particularly when the solubilities of the different polymorphs are similar (48, 49).
Concentration
The period needed for crystals to nucleate and begin growth depends on the concentration and the rate at which solvent evaporates. To achieve the supersaturation point for a given solution to initiate crystallization, it is required a reduction of the solvent amount (e.g., evaporation of solvent) or a reduction on the solubility of the solute. Thus, evaporation of solvent is one of the more commonly used methods for crystallizing compounds. Ostwald showed that unstable polymorphic forms have a greater solubility than the more stable forms in a particular solvent (50). Thus, crystallization by slow evaporation results often in formation of the most stable polymorph.
pH
pH can affect crystallization and the appearance of polymorphs, mainly for protein crystallization. In aqueous solution, a protein with hydrophilic groups on its surface is covered