Milton Grácio Catarino i
INDEX
Index of figures ...iii
Index of tables ...vii
Abbreviations ... ix
Fore word ... 1
Summary ... 3
1. Introduction ... 7
1.1. The European energy context ... 7
1.3. Motivation ... 13
1.4. Objective... 15
1.5. Dissertation organization and content ... 16
2. State of Art ... 21
2.1. Transport energy, CO2 and mobility data ... 21
2.2. The White Paper ... 26
2.3. Technical variables ... 29
2.4. Non-technical variables ... 33
2.5. Addressing 2020 objectives... 36
3. Methodology ... 41
3.1. The model‟s structure ... 41
3.1.1. The left side... 41
3.1.2. The top side ... 45
3.2. The calculation flow ... 47
3.2.1. The need to resort to external sources... 49
3.3. Well-to-wheel scope ... 51
3.3.1. The JEC well- to-wheel scope ... 51
3.3.2. The electricity well-to-wheel scope ... 52
3.3.3. Scope differences ... 52
3.3.4. Scope methodology differences ... 53
4. Model development and calibration ... 63
4.1. Air transport sector ... 64
4.1.1. Overview of available and required data ... 64
4.1.2. The calculation flow... 66
4.1.3. Air transport results... 73
4.2. Rail transport sector... 75
4.2.1. Overview of available and required data ... 75
4.2.2. Overview and accuracy of Ex-Tremis data... 76
4.2.3. The calculation flow: high-speed rail... 81
ii Milton Grácio Catarino
4.2.5. The calculation flow: normal-speed rail ...93
4.3. Road transport sector ...109
4.3.1. Overview of available and required data ...109
4.3.2. Overview and accuracy of the Tremove data ...109
4.3.3. External sources...116
4.3.4. The calculation flow: bus ...118
4.3.5. The calculation flow: car ...125
4.3.6. The calculation flow: motorcycle ...133
4.3.7. The calculation flow: van ...134
4.3.8. The calculation flow: freight ...135
4.4. Sea transport sector ...136
4.5. Driving domain study (urban areas)...137
4.6. Model results...140
5. Development of 2020 scenarios ... 147
5.1. Non-technical measures ...147
5.1.1. Business as usual ...147
5.1.2. Extreme modal-shift ...151
5.1.3. High-speed rail infrastructure ...155
5.2. Technical measures ...159
5.2.1. Energy efficiency...159
5.2.2. Biofuels...162
5.2.3. Electric vehicles...164
5.3. Final scenario ...170
6. Results and discussions... 175
6.1. Case study results...175
6.1.1. Rail ...175
6.1.2. Road...178
6.1.3. Urban areas ...183
6.2. National Renewable Energy Action Plans ...184
6.2.1. Biofuels...185
6.2.1. Electric vehicles...186
6.3. Final scenarios...187
7. Conclusions... 191
8. Suggestions for future work... 197
9. References... 201
10. Annexes ... 207
10.1. The National Renewable Energy Action Plans...216
10.2. Electricity ...220
Milton Grácio Catarino iii
Index of figures
Figure 1 – [Summary] Dissertation flow. ...3
Figure 2 – [Intro] EU‟s energy and CO2 evolution [1, 2]. ...7
Figure 3 – [Intro] Organigram of EU‟s Climate Change Package. ...8
Figure 4 – [Intro] EU‟s final energy distribution, 2007 [11]. ...10
Figure 5 – [Intro] EU‟s road energy distribution, 2007 [11]. ...10
Figure 6 – [Intro] Evolution of average new car sales emissions [13]. ...12
Figure 7 – [SoA] Passenger mobility per capita per world region [21]. ...33
Figure 8 – [SoA] GHG emissions scenario comparison [21]. ...34
Figure 9 – [Methodology] Organigram of the left side. ...42
Figure 10 – [Methodology] Air sector details. ...42
Figure 11 – [Methodology] Rail sector details. ...43
Figure 12 – [Methodology] Road sector details. ...44
Figure 13 – [Methodology] Sea sector details. ...45
Figure 14 – [Methodology] Organigram of the top side. ...45
Figure 15 – [Methodology] Energy efficiency well-to-wheel analysis. ...45
Figure 16 – [Methodology] Occupancy rate...46
Figure 17 – [Methodology] Energy efficiency renewable energy approach. ...46
Figure 18 – [Methodology] CO2 efficiency table. ...46
Figure 19 – [Methodology] Passenger mobility and freight transport. ...46
Figure 20 – [Methodology] Total energy quantities. ...47
Figure 21 – [Methodology] Total CO2 quantities. ...47
Figure 22 – [Methodology] Calculation flow options. ...48
Figure 23 – [Methodology] JEC well- to-tank scope [17]...51
Figure 24 – [Methodology] Electricity adopted well-to-tank scope...52
Figure 25 – [Methodology] Electricity WTT efficiency values. ...59
Figure 26 – [Methodology] Electricity power plant output. ...60
Figure 27 – [Methodology] Example of results presentation. ...63
Figure 28 – [Air] Passenger mobility input. ...65
Figure 29 – [Air] Find the TTW total energy and CO2...66
Figure 30 – [Air] TTW CO2 per pkm input. ...67
Figure 31 – [Air] TTW total CO2 input. ...67
Figure 32 – [Air] TTW total energy input. ...67
Figure 33 – [Air] TTW energy per pkm input. ...68
Figure 34 – [Air] Find the occupancy rate. ...68
Figure 35 – [Air] Occupancy rate input...69
Figure 36 – [Air] Find the TTW energy and CO2 per km. ...69
Figure 37 – [Air] TTW energy per km input. ...69
Figure 38 – [Air] TTW CO2 per km input. ...69
Figure 39 – [Air] WTT and WTW energy and CO2 per km input. ...70
Figure 40 – [Air] WTT and WTW energy per km input. ...70
Figure 41 – [Air] WTT and WTW CO2 per km input. ...71
iv Milton Grácio Catarino
Figure 43 – [Air] WTT and WTW energy per pkm input. ... 71
Figure 44 – [Air] WTT and WTW CO2 per pkm input. ... 72
Figure 45 – [Air] Find the WTT and WTW total energy and CO2. ... 72
Figure 46 – [Air] WTT and WTW total energy input. ... 72
Figure 47 – [Air] WTT and WTW total CO2 input. ... 73
Figure 48 – [Air] WTW energy distribution. ... 73
Figure 49 – [Air] WTW CO2 distribution. ... 74
Figure 50 – [Rail] Passenger mobility input. ... 76
Figure 51 – [Rail] Ex-Tremis 2007 details... 77
Figure 52 – [Rail] Relative energy weights on Ex-Tremis. ... 78
Figure 53 – [Rail] TTW energy distribution by purpose. ... 79
Figure 54 – [High-speed] High-speed catenary efficiency. ... 81
Figure 55 – [High-speed] Initial values input. ... 82
Figure 56 – [High-speed] TTW total energy input. ... 83
Figure 57 – [High-speed] WTT and WTW energy efficiency input. ... 84
Figure 58 – [High-speed] WTT and WTW total energy input. ... 84
Figure 59 – [High-speed] Remaining CO2 details input. ... 85
Figure 60 – [High-speed] WTW energy distribution. ... 86
Figure 61 – [High-speed] WTW CO2 distribution. ... 86
Figure 62 – [Metro] Initial values input. ... 89
Figure 63 – [Metro] TTW total energy input. ... 90
Figure 64 – [Metro] WTT and WTW energy efficiency input. ... 91
Figure 65 – [Metro] WTT and WTW total energy input. ... 91
Figure 66 – [Metro] CO2 efficiency complete table. ... 92
Figure 67 – [Metro] WTW energy distribution... 92
Figure 68 – [Metro] WTW CO2 distribution. ... 93
Figure 69 – [Normal-speed] Find the TTW total energy and CO2. ... 94
Figure 70 – [Normal-speed] TTW total diesel energy input. ... 94
Figure 71 – [Normal-speed] TTW total diesel CO2 input. ... 94
Figure 72 – [Normal-speed] TTW total energy input. ... 95
Figure 73 – [Normal-speed] Tremove rail passenger mobility data. ... 95
Figure 74 – [Normal-speed] Passenger mobility by energy type input. ... 97
Figure 75 – [Normal-speed] TTW energy per pkm input. ... 98
Figure 76 – [Normal-speed] Occupancy rate input. ... 99
Figure 77 – [Normal-speed] TTW energy per km input. ... 101
Figure 78 – [Normal-speed] WTT and WTW energy per km input. ... 102
Figure 79 – [Normal-speed] WTT and WTW energy per pkm input. ... 103
Figure 80 – [Normal-speed] Energy complete table. ... 103
Figure 81 – [Normal-speed] WTT and WTW total CO2 input... 107
Figure 82 – [Normal-speed] WTW energy distribution... 107
Figure 83 – [Normal-speed] WTW CO2 distribution. ... 108
Figure 84 – [Road] Tremove road energy data [15]. ... 110
Figure 85 – [Road] Tremove road passenger mobility data [15]. ... 112
Figure 86 – [Road] Energy and passenger mobility relative weights on Tremove. ... 113
Milton Grácio Catarino v
Figure 88 – [Road] Result of interacting Tremove with Eurostat energy data. ...114
Figure 89 – [Road] Result of interacting Tremove with Eurostat passenger mobility data. ...115
Figure 90 – [Road] Preliminary results on energy efficiency per pkm. ...115
Figure 91 – [Road] Comparison between Eurostat and “JEC Biofuel Programme” [11, 12]. 117 Figure 92 – [Road] Result of Tremove‟s relative weights to JEC details. ...118
Figure 93 – [Bus] First values input. ...120
Figure 94 – [Bus] TTW energy per pkm input. ...121
Figure 95 – [Bus] Occupancy rate input. ...122
Figure 96 – [Bus] WTW energy distribution...124
Figure 97 – [Bus] WTW CO2 distribution. ...124
Figure 98 – [Car] WTW energy distribution. ...132
Figure 99 – [Car] WTW CO2 distribution. ...132
Figure 100 – [Freight] Complete energy details. ...135
Figure 101 – [Freight] Complete CO2 details. ...135
Figure 102 – [Urban] Passenger mobility distribution by driving domain. ...139
Figure 103 – [Model] WTW energy distribution by mode. ...140
Figure 104 – [Model] WTW CO2 distribution by mode. ...141
Figure 105 – [Model] WTW energy distribution by purpose. ...141
Figure 106 – [Model] WTW CO2 distribution by purpose. ...142
Figure 107 – [Model] WTW energy for passenger mobility by driving domain. ...143
Figure 108 – [Future] Expected passenger mobility demand. ...149
Figure 109 – [Future] BAU energy for passenger mobility. ...149
Figure 110 – [Future] BAU CO2 for passenger mobility. ...150
Figure 111 – [Future] Current and additional pkm capacity of inland modes. ...153
Figure 112 – [Future] Energy modal-shift impacts from passenger car. ...153
Figure 113 – [Future] CO2 modal-shift impacts from passenger car. ...154
Figure 114 – [Future] Energy impacts due more high-speed lines...157
Figure 115 – [Future] CO2 impacts due more high-speed lines...158
Figure 116 – [Future] Energy efficiency improvements impacts. ...161
Figure 117 – [Future] CO2 efficiency improvements impacts. ...161
Figure 118 – [Future] NREAPs biofuels energy impacts. ...163
Figure 119 – [Future] NREAPs biofuels CO2 impacts. ...164
Figure 120 – [Future] Expected renewable electricity situation by 2020. ...165
Figure 121 – [Future] Electric vehicle energy impacts. ...167
Figure 122 – [Future] Electric vehicle CO2 impacts. ...168
Figure 123 – [Future] Renewable electricity impact. ...169
Figure 124 – [Future] Energy final 2020 scenario. ...170
Figure 125 – [Future] CO2 final 2020 scenario. ...171
Figure 126 – [Results] Rail WTW energy distribution. ...177
Figure 127 – [Results] Rail WTW CO2 distribution. ...178
Figure 128 – [Results] Road WTW energy distribution...182
Figure 129 – [Results] Road WTW CO2 distribution. ...182
Figure 130 – [Results] Driving domain WTW energy distribution. ...183
Figure 131 – [Results] Final energy scenario. ...187
vi Milton Grácio Catarino
Figure 133 – [Conclusions] Potential data updates. ... 197
Figure 134 – [Annexes] Model‟s energy table... 207
Figure 135 – [Annexes] Model‟s CO2 table. ... 208
Figure 136 – [High-speed] CO2 emissions complete table... 210
Figure 137 – [Metro] Energy efficiency complete table. ... 210
Figure 138 – [Metro] Energy complete table. ... 210
Figure 139 – [Bus] First energy details input... 212
Figure 140 – [Bus] First CO2 details input. ... 212
Figure 141 – [Bus] Energy efficiency complete table. ... 212
Figure 142 – [Bus] CO2 efficiency complete table. ... 212
Figure 143 – [Bus] Total energy quantities input. ... 213
Figure 144 – [Bus] Total CO2 quantities input... 213
Figure 145 – [Car] First energy details input. ... 213
Figure 146 – [Car] First CO2 details input. ... 213
Figure 147 – [Car] Passenger mobility by energy type input. ... 214
Figure 148 – [Moto] Energy complete table. ... 214
Figure 149 – [Moto] CO2 complete table. ... 214
Figure 150 – [Van] Energy complete table. ... 214
Figure 151 – [Van] CO2 complete table. ... 215
Figure 152 – [Sea] Energy details ... 215
Figure 153 – [Sea] CO2 details. ... 215
Figure 154 – [NREAP] EU‟s final energy consumption. ... 216
Figure 155 – [NREAP] EU‟s renewable energy share by sector. ... 217
Figure 156 – [NREAP] EU‟s renewable energy evolution by sector. ... 218
Figure 157 – [NREAP] Country renewable energy contribution. ... 219
Figure 158 – [NREAP] Countries announced objectives. ... 219
Figure 159 – [NREAP] EU‟s electricity sector evolution... 220
Figure 160 – [NREAP] EU‟s renewable electricity consumption by technology. ... 221
Figure 161 – [NREAP] Renewable electricity mix by country. ... 222
Figure 162 – [NREAP] Country renewable electricity contribution. ... 223
Figure 163 – [NREAP] Renewable electricity shares by country. ... 223
Figure 164 – [NREAP] EU‟s rail+road energy consumption. ... 224
Figure 165 – [NREAP] EU‟s renewable energy consumption in transport. ... 225
Figure 166 – [NREAP] Evolution of RES-T share in Transport. ... 226
Figure 167 – [NREAP] Renewable transport objectives by member state. ... 227
Figure 168 – [NREAP] Transport renewable energy mix by country. ... 227
Figure 169 – [NREAP] Different renewable energy approaches for transport. ... 228
Figure 170 – [NREAP] Rail-road details separation... 230
Figure 171 – [NREAP] Austrian example for gasoline and diesel history [11]. ... 231
Figure 172 – [NREAP] Austrian example for gasoline and diesel road share. ... 232
Figure 173 – [NREAP] Austrian future projections of gasoline and diesel road shares. ... 232
Figure 174 – [NREAP] Austrian gasoline and diesel future projections. ... 233
Figure 175 – [NREAP] Annual evolution of the number of measures. ... 243
Figure 176 – [NREAP] Gasoline predictions up to 2020. ... 245
Milton Grácio Catarino vii
Index of tables
Table 1 – [Intro] Internship objectives chronogram. ...15
Table 2 – [SoA] JEC conventional fossil fuels pathways [17]. ...25
Table 3 – [SoA] Summary of policy option impacts [7]. ...28
Table 4 – [SoA] Summary of real on-road fuel consumption. ...31
Table 5 – [SoA] Passenger and freight demand by scenario [22]. ...35
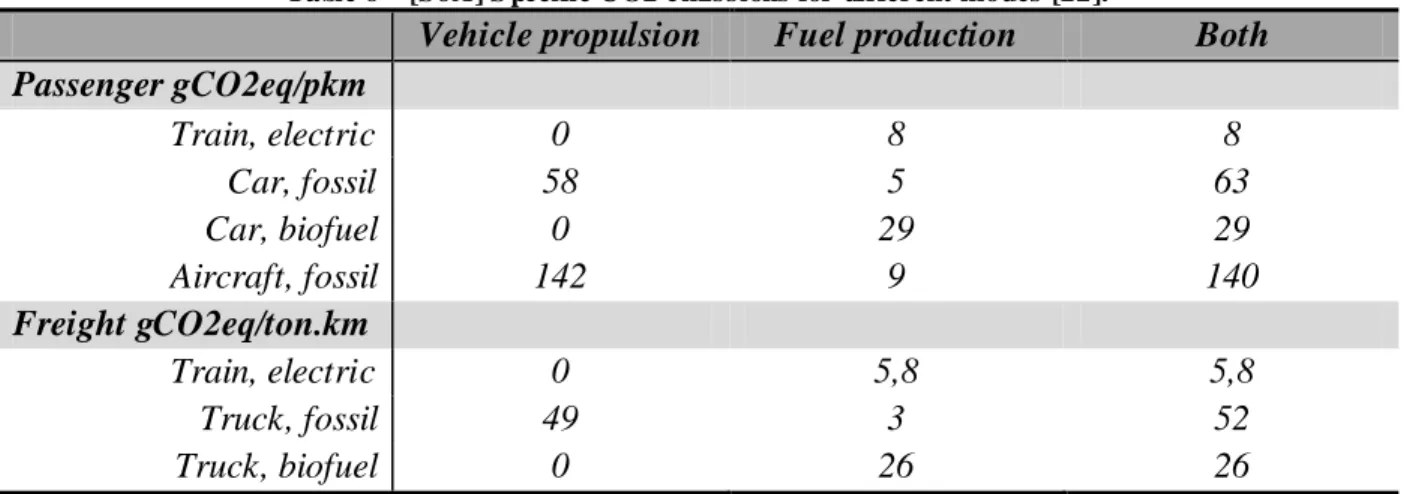
Table 6 – [SoA] Specific CO2 emissions for different modes [22]. ...36
Table 7 – [Methodology] Well-to-wheel scope differences ...53
Table 8 – [Methodology] JEC Well-to-wheel crude oil derived fuels [17]. ...54
Table 9 – [Methodology] Well-to-tank energy and CO2 ratios. ...55
Table 10 – [Methodology] Bioethanol used pathways [17]. ...56
Table 11 – [Methodology] Biodiesel used pathways [17]. ...56
Table 12 – [Methodology] Biofuels used CO2 factors [24]. ...57
Table 13 – [Air] Eurostat energy data [11]...64
Table 14 – [Air] Eurostat scope data [11]. ...65
Table 15 – [Air] Output from DGMOVE email exchange. ...66
Table 16 – [Rail] Eurostat energy data [11]. ...75
Table 17 – [Rail] Eurostat transport statistics [11]. ...76
Table 18 – [Rail] Comparison between Eurostat and Ex-Tremis. ...77
Table 19 – [Rail] Resume of relevant energy weights. ...78
Table 20 – [Rail] Resume of relevant passenger mobility and freight transport weights. ...78
Table 21 – [Rail] Calculation results between Ex-Tremis and Eurostat. ...79
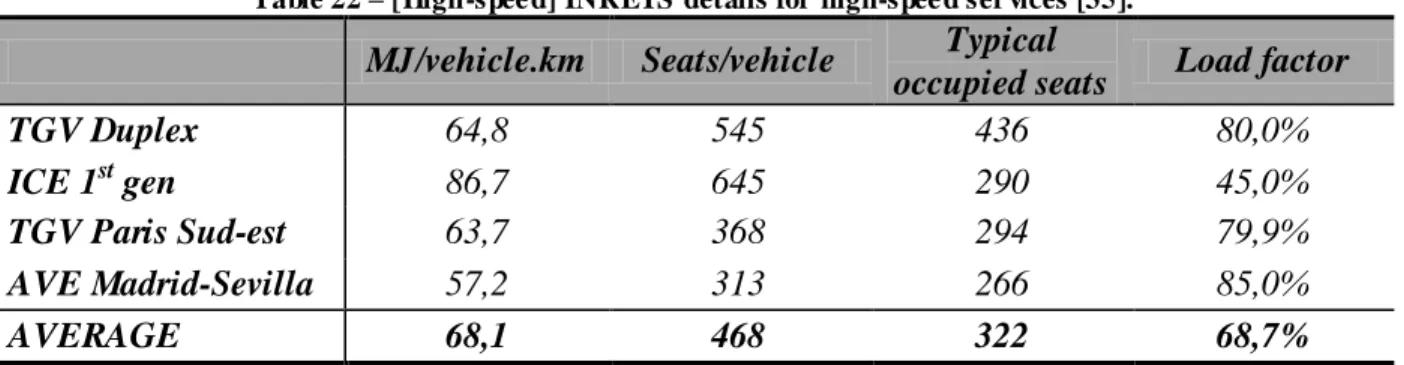
Table 22 – [High-speed] INRETS details for high-speed services [35]. ...80
Table 23 – [High-speed] Comparison of TTW energy efficiency. ...82
Table 24 – [High-speed] Comparison of CO2 efficiency. ...85
Table 25 – [Metro] TTW energy efficiency. ...87
Table 26 – [Metro] Values on seat capacity. ...88
Table 27 – [Metro] Comparison of TTW energy efficiency. ...88
Table 28 – [Normal-speed] Data from Ex-Tremis and Eurostat. ...93
Table 29 – [Normal-speed] Comparison between Eurostat and Tremove. ...96
Table 30 – [Normal-speed] Comparison of TTW energy efficiency. ...98
Table 31 – [Normal-speed] External data on maximum seat capacity. ...99
Table 32 – [Normal-speed] Comparison of TTW energy efficiency. ...101
Table 33 – [Normal-speed] Comparison of TTW CO2 efficiency. ...104
Table 34 – [Road] Comparison between Eurostat and Tremove energy, 2007. ...111
Table 35 – [Road] Comparison between Eurostat and Tremove passenger mobility, 2007. ..112
Table 36 – [Road] “JEC Biofuels Programme” energy details [12]. ...116
Table 37 – [Road] Input values on the energy table. ...118
Table 38 – [Bus] Energy and CO2 details. ...119
Table 39 – [Bus] Energy and CO2 efficiency per pkm. ...120
Table 40 – [Bus] Comparison of energy and CO2 efficiency per pkm. ...121
Table 41 – [Bus] Calculated energy and CO2 efficiency per km. ...122
viii Milton Grácio Catarino
Table 43 – [Car] “JEC Biofuels Programme” details [12]. ... 125
Table 44 – [Car] Comparison of energy and CO2 efficiency. ... 126
Table 45 – [Car] Energy efficiency variations (%) to gasoline [17]. ... 128
Table 46 – [Car] Equation system results. ... 129
Table 47 – [Car] Passenger mobility by energy type. ... 130
Table 48 – [Car] TTW energy efficiency per km. ... 130
Table 49 – [Car] Comparison of energy efficiency. ... 131
Table 50 – [Moto] TTW energy and CO2 quantities. ... 133
Table 51 – [Van] TTW energy and CO2 quantities. ... 134
Table 52 – [Sea] Eurostat energy data [11]. ... 136
Table 53 – [Urban] – Driving domain percentage distribution [51]. ... 137
Table 54 – [Urban] Passenger mobility distribution by driving domain. ... 138
Table 55 – [Future] Calculated 2020 passenger mobility demand. ... 148
Table 56 – [Future] Additional passengers-km capacity by sub- mode... 152
Table 57 – [Future] Future high-speed lines [52]. ... 155
Table 58 – [Future] TTW energy efficiency improvements. ... 160
Table 59 – [Future] Potential biofuel blends. ... 162
Table 60 – [Future] Market size for electric vehicles. ... 166
Table 61 – [Future] NREAP principal results. ... 184
Table 62 – [Air] Overview of available and required data. ... 209
Table 63 – [Rail] Overview of available and required data. ... 209
Table 64 – [Road] Overview of available and required data. ... 210
Table 65 – [NREAP] Potential biofuel blends. ... 234
Table 66 – [NREAP] Potential market size of EVs. ... 236
Milton Grácio Catarino ix
Abbreviations
CNG Compressed Natural Gas
CO2 Carbon dioxide
DG ENER European Commission’s Directorate General for Energy
DG MOVE European Commission’s Directorate General for Mobility and Transport
DICI An ICE using Direct Injection Compression Ignition technology
DISI An ICE using Direct Injection Spark Ignition technology
DPF Diesel Particulate Filter
EC European Commission
ECCP European Climate Change Package
ETS Emission Trading System
EU European Union
EV Electric vehicle
GHG Greenhouse gas
HSR High-speed rail
HST High-speed train
ICE Internal combustion engine
J Joule
JEC Consortium between: Joint Research Centre, EUCAR, Concawe
LHV Low Heating Value
LPG Liquefied Petroleum Gas
NEDC New European Driving Cycle
NREAP National Renewable Energy Action Plan
non-ETS non-Emission Trading System
OEM Original Equipment Manufacturer
PISI An ICE using Port Injection Spark Ignition technology
PKM Passenger-km
RED Renewable Energy Directive (2009/28/EC)
RES Renewable Energy Sources
RES-HC Renewable Energy Sources for Heating and Cooling
RES-E Renewable Energy Sources for Electricity
RES-T Renewable Energy Sources for Transport
STTP Strategic Transport Technology Plan
TME Toyota Motor Europe
toe Ton of oil equivalent
TTW Tank-to-wheel
Wh Watt-hour
WTT Well-to-tank
Milton Grácio Catarino 1
Foreword
Increased energy security and reduced greenhouse gases (GHG) emissions are the core of EU‟s strategy for the next decades. An 80% reduction on GHG emissions by 2050 requires Member States and energy sectors to adopt measures that help to achieve this long-term objective through intermediate 2020 binding targets.
Transport appears as the most resilient sector on this transition period, as it is highly dependent of one single and imported fossil energy source. Despite the achieved efficiency in modern vehicles, increasing patterns on private car usage urges the need to diversify its energy mix while reducing its environmental impact.
The development of a prediction tool, which can evaluate the energy and CO2 well- to-wheel impact due to the uptake of technical and non-technical measures, constitutes a key element to support decision makers on finding the best future energy scenario.
The research work and the obtained results were conducted and internally presented at Toyota Motor Europe, during an internship period between the 15th March 2010 and 11th March 2011.
Milton Grácio Catarino 3
Summary
What is the problem?
The need to diversify transport‟s energy matrix requires decision makers both at the political and industrial level to define future strategies and priorities for the transport sector. Hence, the need to have representative data of the current European transport situation is crucial to project future scenarios allowing finding a best energy-technology compromise.
Why there is a problem?
1. Lack of detailed European data
2. Lack of modelling across all transport modes (air, rail, road and sea) and sub-modes (airplanes, metro, high-speed, bus, car, etc)
3. The need to test elasticity Eurostat
Representative energy data for the transport sector can be found at the Eurostat‟s database however its scope is still limited. Understanding of the well-to-wheel contribution of the railways, bus or passenger car urges the need to study the transport system across all modes. Additionally, it is not possible to individually characterize each well- to-wheel energy and CO2 efficiencies for each sub-mode such as metro, high-speed, bus, car and others, in terms of energy/km, energy/pkm, CO2/km and CO2/pkm.
Tremove, Ex-Tremis
Models such as the Tremove or the Ex-Tremis provide interesting tank-to-wheel data for the road and rail sub- modes but they do not match the totals provided by the Eurostat. Also, it is not possible to individually characterize all transport sub- modes, their energy and environmental efficiencies, as well as the interaction across all transport sub-modes.
What was realized?
A comprehensive transport model considering all the major transport means, its associated energy efficiencies, all related to the passenger mobility demand published by the Eurostat was developed. A well- to-wheel analysis is performed matching with the tank-to-wheel quantities provided by the Eurostat. Figure 1 shows the dissertation work sequence.
Figure 1 – [Summar y] Dissertation fl ow.
1.
Transport energy and CO2 model
2.
Analyzed external data sources
3.
Future energy and CO2 scenarios
4 Milton Grácio Catarino Several data sources were analyzed, in particular the “JEC Biofuel Programme” and the National Renewable Energy Action Plans from each Member State, with the objective of projecting a future likely situation. This allowed projecting an expected energy efficiency improvement, the calculation of potential biofuel blends that might be in the market by 2020, as well as a potential market size for electric vehicles.
Using the developed model together with the expected 2020 energy situation, several scenarios evaluating the well-to-wheel energy and CO2 impacts resulting from the uptake of technical and non-technical measures were performed.
What was concluded?
Responsible for about 50% of the total well- to-wheel energy consumption and CO2 emissions of the transport sector, the car segment presents the largest potential to reduce transport‟s oil reliance. On a business as usual scenario for 2020, the passenger mobility‟s tank-to-wheel CO2 emissions are projected to increase about 23% to the level of 906MtCO2, above 2007 levels.
Current capacity of the collective modes such as metro, normal-, high-speed and bus cannot absorb all the mobility demand currently performed by the car segment. The single full modal-shift from the passenger car into those modes offers the potential of reducing in about 15% the well-to-wheel CO2 emissions, in the reference year.
The current low capacity of the high-speed segment to absorb passengers from the aviation and car segments, offers a marginal 6% and 3% well- to-wheel CO2 reduction in case of a full shift of longer journeys, in the reference year.
In a scenario of efficiency improvements, the passenger car is alone capable to reduce by 17% the well-to-wheel CO2 emissions of the passenger mobility segment. An additional 5% reduction is possible if other modes such as aviation, bus and passenger vans also improve.
The single uptake of the biofuel blend calculated on the NREAPs (11% volume bioethanol, 12% volume biodiesel), offers the potential to reduce the well- to-wheel CO2 emissions by 3%, in the reference year.
A full uptake of electric vehicles in urban areas offers the potential to reduce the passenger mobility‟s well-to-wheel CO2 emissions by 31%, being the largest measure to reduce emissions. A real uptake of electric vehicles such as the one coming from the NREAPs, offers a potential of 5% well-to-wheel CO2 reductions.
In which extent the model was useful?
The developed transport model, together with the results from the NREAPs, helped Toyota Motor Europe to evaluate different energy scenarios and to support future business decisio ns.
Milton Grácio Catarino 5
Chapter 1
Milton Grácio Catarino 7
1. Introduction
1.1.
The European energy context
Enlargement, market liberalization and economy growth contributed for the continuously increase of EU‟s energy consumption since early 1990s, while the phase out of old power plants, improvements on energy efficiency, the uptake of renewable energy sources together with the recent economic recession contributed for the decrease of CO2 emissions [1], as shown in Figure 2.
Recent political crisis in Middle East and Northern Africa raised concerns about EU‟s security of energy supply, creating uncertainties on the markets and energy prices. Ensuring energy security while reducing its imports dependency and greenhouse gases (GHG) emissions, are the main driving forces of the European Union policies for the decades to come.
Figure 2 – [Intro] EU’s energy and CO2 e vol ution [1, 2].
The 2020 vision
In March 2007, the European Union endorsed an integrated approach called “The European Climate Change Package” aiming to reduce GHG emissions and increase the penetration level of renewable energy sources. Transform the EU into a highly energy-efficient and low-carbon economy was the motivation of this energy policy package. To start this process, EU Heads of State and Governments set a series of climate and energy targets to be met by 2020, as shown in Figure 3. These are [3]:
- 20% reduction on GHG emissions below 1990 levels;
- 20% share of renewable energy sources on final energy consumption, with a mandatory objective of 10% for the transport sector;
- 20% reduction in primary energy consumption compared with projected levels, to be achieved by energy efficiency.
8 Milton Grácio Catarino
Figure 3 – [Intro] Org anigram of EU’s Cli mate Change Package.
Major European climate mechanisms
Launched in 2005, the European Emissions Trading System (EU ETS) is a pioneer mechanism to reduce industrial GHG emissions. The system is based on a “cap and trade” principle, which means that there is a limit on the total amount of certain greenhouse gases that can be emitted by the industry players registered in the system. Within this cap, high carbon intense companies receive emission allowances which they can sell to or buy from one another as needed [4].
The Transport, Household and Agriculture sectors are excluded from the Emissions Trading Scheme, belonging to the non-ETS sector. This means that their GHG emissions cannot be traded creating the need to implement individual mechanisms and measures.
On the transport sector, the inclusion of the aviation sector in the EU ETS by 2012 represents one of the main mechanisms to virtually reduce its carbon emissions. This will allow air companies to buy and sell emissions allowances according to their level of carbon emissions [5].
For the road transport sector, indicative emissions targets for new cars and vans sales, the carbon-indexed taxation for passenger cars and the road taxation for heavy duty trucks are some of the mechanisms now in place to reduce road carbon emissions [6].
It is that expected by 2020 the average new sales emissions for car OEMs should achieve a maximum of 95gCO2/km, and for new van sales this figure is slightly higher, 135gCO2/km [6]. The objective of road taxation is to input a price per km driven for heavy duty trucks in countries where this traffic is considerable high.
20% CO2 reduction vs 1990
20% RES in final consumption
10% RES in tra nsport
Companies (ETS)
Energy & Industrial
21% CO2 reduction vs 2005 Countries (non-ETS) Agriculture, Household, Transport 10% GHG reduction vs 2005 20% increase in energy efficiency
Milton Grácio Catarino 9 The recently published White Paper for the future of transport outlined a 60% long-term CO2 reduction target to be met by 2050 [7].
Regarding fuels, the directive 2003/30/EC required fuel suppliers to incorporate an average renewable energy source blending of 2% by 2005 and 5,75% by 2010. This should have been achieved through blends of bioethanol and biodiesel on gasoline and diesel, without any requirement specific for each biofuels type [8].
Also, according to the fuel quality directive (2009/30/EC), there is a mandatory objective that intends to reduce the carbon intensity of the supplied fuels for transport. It is required that by 2020, average fuels supplied for road transport should be 6% less carbon intense compared to 2010, in a well- to-wheel basis. It includes all fossil fuels, gasoline, diesel, LPG and Natural Gas as well as biofuels and electricity for road [9].
The National Renewable Energy Action Plans
The European Commission required each Member State to provide information on how they plan to meet their 2020 final renewable energy objectives, underlined in the renewable energy directive (2009/28/EC). Heating and Cooling, Electricity and Transport, are the three energy-intense sectors where the European Commission wants to have a detailed picture for the years up to 2020. Data on energy consumption and renewable energy integration should be published in these reports, as well as policies and measures needed to drive national energy markets in those objectives. It was required from each Member State to respect the template provided by the European Commission where all energy data should be detailed by energy type, technology and year-by-year from 2010 up to 2020 [10].
1.2.
The European transport sector
The Transport sector is a crucial sector for EU‟s economy. It ensures territorial cohesion, increases the EU‟s competitiveness, brings together people and cities, and allows the transport of goods through all Member States.
A major energy consumer
Transport accounts for about 30% of EU‟s final energy consumption with an high dependence on one single and imported fossil energy source: oil [11] as shown in Figure 4. Oil‟s high energy density represents a crucial advantage in all mobility solutions and an essential requirement for those that are more sensitive to weight and autonomy, such as aviation and long-distance road transport. Also, its distribution and refuelling installed infrastructure together with its relative cheap price compared to others energy carriers, places it in a dominant and stable market position.
10 Milton Grácio Catarino
Figure 4 – [Intro] EU’s final energy distributi on, 2007 [11].
The aviation sector continues relying almost entirely on kerosene with a light use of gasoline. The uptake of biofuels as well as other renewable energy carriers is negligible.
The rail sector is the most energy diversified sector of all transport modes. Electricity produced from a variety of primary energy sources such as coal, nuclear and natural gas, and diesel in some applications are the main energy carriers currently used in railways. Also, the deployment of the renewable electricity sector makes the rail sector one of the most low-carbon transport modes.
Road transport relies almost entirely on fossil fue ls such as gasoline and diesel, 96% [11], contributing for its high level of carbon emissions as shown in Figure 5. LPG was the first alternative energy truly implemented at road transport level with a dedicated refuelling infrastructure however its usage remains marginal when compared to gasoline and diesel. In recent years, and especially in countries such as Italy and Sweden, natural gas in forms of compressed natural gas became popular, highly motivated by Government incentives. The uptake of biofuels was still marginal in 2007, when energy blends of bioethanol and biodiesel in gasoline and diesel reached about 1% and 3% [11], respectively.
Milton Grácio Catarino 11 A major carbon emitter
The transport sector is responsible for around a quarter of EU‟s CO2 emissions being the second largest emitting sector, after energy. Road transport is the largest emitting mode, accounting for 70% of transport‟s carbon emissions [11].
While emissions from other sectors have generally falling, those from transport have continuously increased since the 1990s, reaching its highest level in 2007. Recently data of 2008 and 2009 showed for the first time a significant reduction in transport‟s carbon emissions in two consecutive years [1].
Some explanations for this phenomenon are described in the literature: improvements on energy efficiency from new vehicles, the uptake of biofuels and the recent economic recession which had reduced freight transport activity mainly performed by diesel trucks [1, 7].
An intense activity sector
Transport activity is largely determined by people‟s location, life style patterns and availability of infrastructure. It is used both for people‟s mobility and freight transport, for leisure and work purposes, within EU and at international level.
The aviation sector presented the largest activity growth during the last decade, showing an increase of 25%, in passenger-km figures, between 2000 and 2007 [11]. Liberalization of air transport increased competition, lowered air fares and widened the range of choices for intra-EU routes. However, this increase had put some strain on the available capacity – both in the sky and on the ground. Traffic density resulted in an increasing number of delays, saturation of the sky and shortages in airports capacity.
Rail transport has been reducing its relevance on passenger mobility and freight transport, remaining with a constant volume of carried passengers and freight [11]. Recently in 2008, EU‟s passenger mobility by rail grew about 3,5% compared to 2007, mainly driven by a remarkable 10% increase on passenger mobility by high-speed rail [11]. The construction of new high-speed lines in countries such as Germany, Spain and The Netherlands, together with the liberalization of their railway market operators have significantly contributed for this increase.
Road transport is the most important transport mode in the EU accounting for more than 80% and 45% of EU‟s passenger mobility and freight transport [11]. Passenger cars and heavy duty trucks appear as the most used sub- modes for these purposes. Despite a slow increase in infrastructures in recent years, the road transport‟s popularity contributed for the continuous increasing in its activity, resulting in large levels of congestion, noise and air pollution.
Recently data of 2008 showed a slight decrease on road‟s passenger mobility and freight transport [11]. The uptake of high-speed lines might have contributed for a reduction on passenger car usage while the recent economic recession might justify the decrease on road freight transport activity.
12 Milton Grácio Catarino The Automotive sector
The European car fleet accounts with about 220million vehicles, with about 4 million being added each year [12]. This figure intends to increase, especially in newer Member States (EU12) where motorization rates are lower compared to older Member States (EU15).
Despite the fuel efficiency achieved in modern vehicles, the car sector plays a major role in transport‟s energy consumption, in forms of gasoline and diesel, and consequently on carbon emissions. Large and increasing number of vehicles, together with the increasing activity volumes, seems to have rapidly offset all efficiency gains. However, in terms of fuel efficiency improvement of new car sales, the car industry was able to reduce its average new sales emissions of about 15% between 2000 and 2009, from 172gCO2/km to 146gCO2/km [13], as shown in Figure 6.
Figure 6 – [Intro] Evolution of average ne w c ar sales emissions [13].
Urban areas and the modal shift
High concentration of population and economic activities in urban areas contributes for the continuous increase on the number of daily journeys, mainly performed by private car and delivery vans. Comfort, privacy and a “door-to-door” service, might explain why these modes are the most preferred in urban areas, in depreciation of the public and collective modes such as bus and metro. Here, clearly exists the potential for urban areas improvement, tackling actual challenges such as congestion, noise and air quality.
The uptake and the development of a pan-European high-speed rail network provides a better environmental solution to replace carbon- intense passenger journeys between city centres, allowing also the expansion of freight trains using the remaining normal-speed lines, reducing road heavy duty transport.
Milton Grácio Catarino 13
1.3.
Motivation
Under the environmental strategies of the European Commission such as the European Climate Change Package (ECCP) and the recently published White Paper for the future of transport, there are three principal objectives that are conducting the EU‟s energy policy direction for the decades to come. These are:
1) 20% reduction by 2020 below 1990 levels (ECCP) 2) 10% reduction by 2020 below 2005 levels (non-ETS) 3) 60% reduction by 2050 below 1990 levels (White Paper)
Under this umbrella it is necessary for decision makers both at the political and industrial level to project future scenarios enabling the evaluation of the well-to-wheel energy and CO2 impacts resulting from a technical or a non-technical shift.
Identify the potential well- to-wheel energy and CO2 impacts resulting from the uptake of measures such as the energy efficiency improvements, bio fuels or electric vehicles, as well as resulting from a modal-shift into collective transport modes requires the characterization of the transport sector in all of its components.
Hence, evaluating the well- to-wheel energy and CO2 efficiency, linking with the actual passenger mobility and freight transport demand and also taking into account the current European fleet, requires the usage of actual and representative European data for the entire transport sector.
The Eurostat provides official statistics for the European transport sector but is not enough detailed in all the components of the transport system. For example, it is not possible to individually characterize the total well-to-wheel energy and CO2 situation for the metro, high-speed, bus or passenger car, etc, or to characterize its well-to-wheel energy and CO2 efficiency per km or per pkm, or even the passenger mobility running in different energy types.
Therefore, a comprehensive transport model that enables the characterization of a ll transport modes and sub- modes, its energy and CO2 performances, all used energy carriers, both for passenger mobility and freight transport purposes and which can be used as a prediction tool, is a crucial element to support decision makers on finding the best future energy and technological mix.
Milton Grácio Catarino 15
1.4.
Objective
The objectives of this dissertation are:
1) To model the current well- to-wheel energy and CO2 contribution from each mode of transport to the total transport picture,
2) To analyse the expected future transport energy situation at the European Union level, 3) To develop future scenarios taking into account the expected increase on passenger
mobility demand as well as the technical and non-technical shifts.
These objectives were achieved during 3 phases along the internship as shown in Table 1.
Table 1 – [Intr o] Internshi p objecti ves chr onogram.
Mar Apr May Jun Jul Aug Sep Oct Nov Dec Jan Feb Mar
2010 Phase 1 Phase 2
2011 Phase 3
Phase 1
Its objective is to develop a comprehensive and detailed model for the European transport sector which evaluates the well-to-wheel energy and CO2 situation through the input of actual and representative data, such as the one coming from the Eurostat. Then it is required to individually study each mode of transport, each used energy carrier, each associated energy and CO2 efficiency, linking with the passenger mobility demand data provided by the Eurostat, also in a well- to-wheel basis.
Having all categories defined, it will be possible to see the detailed contribution of each mode of transport for the total well-to-wheel energy and CO2 picture, using real European data from the Eurostat.
Phase 2
Its objective is to analyse each National Renewable Energy Action Plan that all 27 Member States have published to the European Commission. A detailed picture of the Electricity and Transport energy situation by 2020 will be provided as well as the calculation of potential biofuel blends that might be in place by 2020 and market size for the electric vehicle segment. Having all data gathered, it will be possible to build detailed electricity and transport expected energy picture by 2020.
Phase 3
Its objective is to develop future energy scenarios based on selected data sources for the year 2020, and on the passenger mobility demand analysis.
The manipulation of parameters such as the energy efficiency, the modal shift, vehicle‟s powertrains and energy carriers, will allow building of scenarios and to evaluate the potential energy and CO2 well-to-wheel impacts compared to the reference case.
Having several 2020 scenarios, it will be possible to combine all scenarios and provide a likely energy and CO2 situation by 2020.
Milton Grácio Catarino 17
1.5.
Dissertation organization and content
The present dissertation is divided in eight Chapters, with the additional chapters of References and Annexes.
On the Introduction, the European energy and transport situation are characterized along a description of actual trends and intensities.
On the State of Art, several articles and relevant studies on the transport modelling topic are presented, together with its important results for the context of this dissertation.
On the Methodology and Model development and calibration, the methodology or the construction of the transport energy and CO2 model will be explained, followed by the presentation of the used data sources, and finally the model‟s calibration process.
On the Development of 2020 scenarios, the potential energy and CO2 well-to-wheel impacts at the passenger mobility level will be evaluated, according to the constructed model and external data sources. Finally, a likely scenario for 2020 will be presented.
Finally, on the chapters of Results, Conclusions and Recommendations for future work, the final results will be presented and discussed as well as the limitations of the adopted methodology and the recommendations of interesting future work on the topic.
This dissertation starts to evaluate the actual contribution of each mode of transport (e.g. airplanes, metro, bus, car, etc) for the total well-to-wheel energy consumption and CO2 emissions, as well as it identifies the individual average well-to-wheel energy efficiency for each mode, in terms of MJ/km, gCO2/km, MJ/pkm and gCO2/pkm, for each used energy carrier.
It also makes the link with the passenger mobility and freight transport variables such as the occupancy rate, the volume of passenger-km and freight-km transported both by each mode and by each energy carrier.
Then this dissertation presents the results of the manipulation of the most likely variables that can help the EU to reduce its transport energy consumption and CO2 emissions: energy efficiency improvements, increase on modal shift, high-speed rail infrastructures, uptake of renewable energies and new power trains.
It analyzes relevant external data sources such as the “JEC Biofuel Programme” and the “National Renewable Energy Action Plans”, in order to characterize the expected 2020 transport energy situation.
Finally, it assesses the individual and agglomerate measures and established comparisons with the developed reference case, in particular focus for the passenger mobility sector. As a result, this dissertation will provide a likely future transport energy scenario for 2020.
Milton Grácio Catarino 19
Chapter 2
Milton Grácio Catarino 21
2. State of Art
This dissertation comprehends a large variety of concepts related to the transport environmental and energy performance. Concepts ranging from energy and CO2 data (total quantities), the energy efficiency in terms of energy/km and energy/pkm, passenger mobility data, modal-shift impacts, electric vehicles, all on a well-to-wheel analysis, are some of the main examples. However, it does not mean that those concepts will be deeply analyzed in all of its fundaments or theoretical definitions.
Here, it is important to inform that the work realized on this dissertation was previously organized and idealized by Toyota Motor Europe who provided the principal motivation, the objective and the mindset behind this job. The principal tools as well as the calculation method were latterly optimized.
The principal used tools and the articles that were consulted during the learning and model‟s development process are presented in the following sections. The articles were selected based on the importance that they had in the moment of model‟s calibration as well as adequate methodology findings. Given the differences on the concepts, this chapter is divided in five sub-chapters:
1) Transport energy, CO2 and mobility data 2) The White Paper
3) Technical variables 4) Non-technical variables 5) Addressing 2020 objectives
2.1.
Transport energy, CO2 and mobility data
Information about the current and future energy, CO2 and passenger mobility situation of the European transport system can be found both in the Eurostat and in several European transport studies.
The Eurostat provides current European information on the total transport energy consumption and CO2 emissions from the four main modes – air, rail, road and sea. Additionally, the Eurostat also provides information on passenger mobility and freight transport demand divided by its main sub- modes – airplanes, metro&tram, railways, high-speed rail, bus, car and powered-two-wheels.
Studies such as the iTREN2030 project [14], and models such as the Tremove [15] and the Ex-Tremis [16], provide information on the actual and future energy and passenger mobility demand for the European Transport system, by pre senting and evaluating scenarios for the years up to 2030.
22 Milton Grácio Catarino Regarding the well- to-wheels energy and CO2 data, the study realized by the JEC consortium (formed by the Joint Research Centre of the European Commission, the European Car Association EUCAR, and the European refineries association CONCAWE) represents the reference information for the well-to-wheel energy and CO2 calculations of the current and future liquid fossil fuels.
The Eurostat
The Eurostat is the statistical office of the European Union which provides to the Community the European statistics, enabling the comparisons betwee n countries and regions. These are key informations for decision- makers at EU and Member State level, in business and corporate organisations, and on other hand to the public and media for accurate picture of contemporary society and to evaluate the performance of the economy.
Each Member State‟s national authorities collect their national statistics, verifying and analysing national data and reporting them to the Eurostat. Eurostat‟s role is therefore to consolidate the data and ensure they are comparable, using harmonized methodology. Currently, the Eurostat is the only provider of statistics at European level.
The Eurostat energy data
The energy data provided by the Eurostat presents an outline tree organization, divided in three categories:
1) “Energy quantities” 2) “Energy prices” 3) “Energy degree-days”
For purposes of this dissertation, the “Energy quantities” tab is the most important as it provides all energy quantities currently in use at the EU. This tab is divided in four categories:
1) “Supply, transformation and consumption” 2) “Infrastructures”
3) “Imports” 4) “Exports”
Under the “Supply, transformation and consumption” tab, the Eurostat provides data on “Final Energy Consumption”, which is sub-divided in its main final energy consumption sectors :
1) “Industry” 2) “Household” 3) “Transport”
For the Transport sector, the energy data is provided in a detailed picture on final consumption data from its main modes – air, rail, road and sea. For each mode, it is possible to obtain detailed information by energy type – kerosene, diesel, electricity, gasoline, LPG, natural gas and biofuels. Electricity used in the rail sector as well as diesel used in road sector are two examples showing the level of detail of the Eurostat energy transport data.
Milton Grácio Catarino 23
The major European transport studies
The iTREN2030 project
The iTREN2030, Integrated Transport and Energy baseline until 2030, is a major study developed by the Transport and Mobility of Leuven, Belgium, and the Fraunhofer Institut, Germany. It is the result of an integrated work gathering several European energy and policy models such as the Astra, the Poles, the Trans- Tools and the Tremove [14]:
1) The Astra model provides the demographic and economic framework conditions for the EU27 as well as scenario results for transport and energy demand, selected items of vehicle fleets (e.g. new technology vehicles) and of transport demand (e.g. slow modes) [14];
2) The Poles model provides an estimation of energy prices including carbon prices and changes of fuel taxes as well as energy demand of sectors other than transport and the rest of the world [14];
3) The Trans-Tools model provides the transport demand by mode on a link-based network level for EU-27 [14];
4) The Tremove model calculates vehicle fleets of conventional vehicles with a detailed technology classification, transport energy demand and transport emissions for EU-27+4 [14].
The iTREN2030 forecasts and assesses the capabilities of the mentioned models to the new policy issues arising from the technology, environment and energy fields. It individually studies the national Member States and agglomerates an EU27 picture [14].
For purposes of this dissertation, this study was considered as an important source of information as it provides values for passenger mobility and energy demand, and associated CO2 emissions for several sub-modes of transport.
The TREMOVE
The Tremove is a major European transport and energy model developed by the Transport and Mobility of Leuven, Belgium, representing one of the most complete and comprehensive databases for fleet composition at European level.
It is also a policy assessment model that studies the effects of different transport and environment policies on the emissions of the transport sector. It estimates the transport demand, modal shifts, vehicle stock and the emissions of air pollutants, according to adopted policies for road pricing, public transport pricing, emission standards, subsidies for cleaner cars, etc. The model covers passenger and freight transport in 31 European countries and covers the period 1995-2030 [15].
The output of the Tremove model is divided into three categories [15]:
1) Demand: it provides information on passenger mobility and freight transport in figures of passengers-km and tonnes-km, occupancy rate, fuel type;
24 Milton Grácio Catarino 2) Stock: it provides information on road and rail vehicle stock per country, fuel type
and vehicle technology;
3) Emissions: it provides information on fuel consumption and pollutant type.
Within its website it is possible to download the spreadsheet files with the data for each considered 31 countries however an EU27 conglomerated picture is not possible to find. For purposes of this dissertation, this model was considered as an important source of information as it provides information on rail and road fleet composition by fuel type, separated by passenger mobility and freight transport demand.
The EX-TREMIS
The Ex-Tremis model is a reference database on fleet and transport activity data, specific energy consumption, emission factors and total emissions for the non-road transport modes, such as maritime, rail and aviation. It covers all EU27 member states from the year 1980 and provides projections for their developments up to 2030 [16].
For purposes of this dissertation, this model was considered as an important source of information as it provides information on rail energy consumption for passenger mobility and freight transport, separated by energy type.
The JEC Well-to-Wheels
The well-to-wheel analysis conducted by the JEC consortium focus on the estimation of greenhouse gas (GHG) emissions, energy consumption and industrial costs of all automotive fuels and power trains options, for the European car fleet in the period 2010-2020 [17].
The study is an integrated research work evolving periodic updates and incorporating potential refining and other process improvements reported by the relevant stakeholders (e.g. car OEMs, refineries, industry, etc) as well as energy and industrial policy regulators [17].
It should be clarified that in the case of the JEC Well-to-Wheel report and for purposes of this dissertation, the well- to-wheel approach differs from a life-cycle analysis, as it does not consider neither the energy consumption nor the GHG emissions involved in the construction of the facilities, manufacturing vehicles or end of life aspects. Therefore, the JEC Well-to-Wheel only considers the steps as [17]:
1) Fuel production (well-to-tank) 2) Vehicle use (tank-to-wheel)
Scope and methodology
The well-to-tank evaluation accounts for the energy expended and the associated GHG emitted in the steps required to deliver the finished fuel into the on-board tank of a vehicle. It covers all steps from extracting, capturing, producing, manufacturing and transporting the fuel into the pump station [17].
Milton Grácio Catarino 25 On the JEC Well-to-Wheels study, the well- to-tank analysis does not consider the energy or the GHG emissions associated with construction or decommissioning of plants and vehicles. The non-consideration is explained by the JEC consortium with two main reasons: first the available data is often sketchy and uncertain; second the impact of these additional energy requirements on the total pathway balance is generally small and within the range of uncertainty of the total estimations [17].
The tank-to-wheel evaluation accounts for the energy expended and the associated GHG emitted by the vehicle- fuel combinations. It measures the energy consumption and GHG emitted when the vehicle is performing the NEDC driving cycle, as a reference for homologation values. As it is described on the Well-to-Wheels report, the results announced on the tables do not and do not attempt to reproduce the average European car fleet [17].
The results of the energy and GHG well- to-wheels figures combine the well- to-tank expended energy, excluding the energy content of the fuel itself, per energy content of the fuel (LHV basis), with the tank-to-wheel energy consumed by the vehicle per unit of distance covered (on the NEDC cycle) [17].
As primary energy sources, the JEC Well-to-Wheel considers oil, coal, natural gas, biomass, wind and nuclear; and as automotive fuels, it considers gasoline, diesel, liquefied petroleum gas (LPG), compressed natural gas (CNG), compressed hydrogen and biofuels. As power trains, it considers the conventional spark ignition gasoline and CNG, the compression ignition diesel, and fuel cell vehicles [17].
Overview of results
Table 2 provides an idea of which data is possible to see on the JEC Well- to-Wheels study:
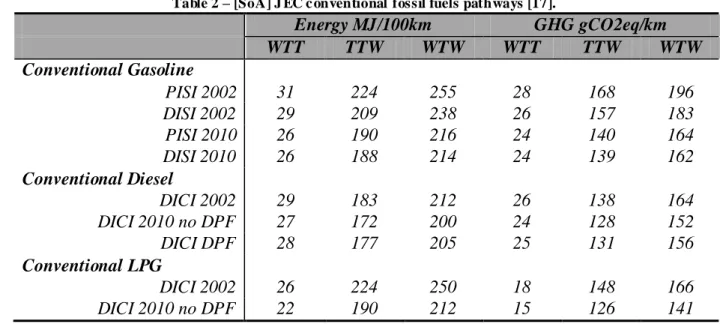
Table 2 – [SoA] J EC c onventional fossil fuels pathways [17].
Energy MJ/100km GHG gCO2eq/km WTT TTW WTW WTT TTW WTW Conventional Gasoline PISI 2002 31 224 255 28 168 196 DISI 2002 29 209 238 26 157 183 PISI 2010 26 190 216 24 140 164 DISI 2010 26 188 214 24 139 162 Conventional Diesel DICI 2002 29 183 212 26 138 164 DICI 2010 no DPF 27 172 200 24 128 152 DICI DPF 28 177 205 25 131 156 Conventional LPG DICI 2002 26 224 250 18 148 166 DICI 2010 no DPF 22 190 212 15 126 141 Note:
PISI = Port Inject ion Spark Ignit ion
DICI = Direct Injection Co mpression Ignition DISI = Direct In jection Spark Ignit ion DPF = Diesel Pa rticu late Filter
26 Milton Grácio Catarino The results are divided on the two phases of the fuel chain: well- to-tank and tank-to-wheel, showing both the energy consumption of the vehicle (MJ/100km) and the associated GHG emissions (gCO2eq/km).
The presented results do not make any differentiation between the European refineries or the outside EU refineries, providing only average European values for the production and distribution of the fuels.
For purposes of this dissertation, the JEC Well- to-Wheels was considered an important source of information as it provides average European va lues for the different phases of the fossil fuels chain.
2.2.
The White Paper
One of the most relevant legislative and assessment documents at the European level is the White Paper for the future of Transport. Developed by the European Commission, the White Paper plans the policies and draws the roadmap for the transport sector expected in a period of 10-years. In March 2011, the latest White Paper was published at the European Commission platform, outlining what is expected to be the transport‟s planning for the next decade [7]. The White Paper first characterizes the major challenges that the transport sector is currently facing, and then characterizes the main measures that should be implemented to tackle those challenges. Additionally, it develops three different policies scenarios, assessing the individual impact that those scenarios have on the final transport situation both by 2020 and long-term vision by 2050.
Major challenges
One of the main challenges that the European Commission published in the White Paper is the expected increase in the transport demand, both in cases of passenger mobility and freight transport. The modelling projections realized by the European Commission shows that, in a no policy change scenario (“business as usual”), the total transport activity is expected to continue to grow in line with economic activity. Total passenger mobility activity would increase by 51% between 2005 and 2050, while freight transport activity would go up by 82% [7].
In the same context of growing demand for transport, the associated final energy consumption is projected to increase by 5% by 2030 and an additional 1% by 2050, driven mainly by aviation and road freight transport. However, and in a particular segment, the energy use of passenger cars would drop by 11% between 2005 and 2030. Renewables would represent 10% of the total energy for transport by 2020, reflecting the implementation of the renewable energy directive 2009/28/EC. The electrification in the transport sector is projected to remain slow in the reference scenario, once electric vehicles are predicted to not make significant contributions till 2050 [7].
Milton Grácio Catarino 27 As major conclusions, the White Paper says that in case of a business as usual, the EU transport system would remain continuously dependent on the usage of fossil fuels, in particular the oil products, representing 90% of transport needs. In the case of modal-shift, once the business as usual does not make any policy changes, the modal-shift shares would not drastically change compared to the reference scenario. The road sector would therefore remain the dominant mode in both freight and passenger transport [7].
Key measures
The deployment of the rail segment is expected to constitute of the main changes that might be in place for the next decades. In particular the growing infrastructure on the high-speed rail segment, as well as the expected shift from road freight into rail freight for distances over 300km, would contribute to reduce CO2 emissions. The implementation of a financial environmental approach for transport charges, such as the “polluter pays” and “user pays” principles, are also seen as key measures for regulating the profile pattern usage of the transport system [7].
Tackling the urban areas challenges is also foreseen as crucial for future of transport. As key parts of the 2050 strategy is, on one hand, the move towards the objective of phasing out the conventional fuelled cars in cities by 2050, with a shift into electric, hydrogen and hybrid cars, as well as in other hand, an increase on the modal-shift into public and collective transport modes. Here, the EU strategic transport technology plan (STTP) is currently giving research support for the deployment of lower emission transport modes for cities, intra-urban and long-distance transport [7].
As a part of the STTP, is the development of transport audit services for Member States for their city planning. For doing so, the European Commission is expecting to introduce procedures and financial assistance for the development of urban mobility audits plans. This will provide to the interested Member States a tool to plan their urban transport system with the objective of finding a best “cost-effective” solution for each city. As additional information, the city planning would be effective through the implementation of schemes such as the access restriction of polluter vehicles, congestion taxes, incentives to modal-shift, allowing the uptake of low emission vehicles [7].
Resume of the policy scenarios
The European Commission developed different policy option (PO) scenarios: the business as usual (PO1), PO2, PO3 and PO4. The impacts were studied on a long-term basis, by 2050. The PO2 was designed to show the effect in case of relying less on performance standards (technological deployment), and more on managing mobility and on carbon pricing. In this scenario the Commission assumed that car OEMs would still perform the 95gCO2/km by 2020, and that the carbon pricing will reach very high levels. Here, the effect of a high carbon price is viewed as an equivalent effect to the restriction on the usage of fossil transport modes, favouring the increase in modal-shift into collective modes[7].
The PO3 was designed to show the effect of policies that emphasise the rapid deployment of new powertrains, by imposing demanding CO2 requirements for new vehicles. It can be viewed as a low emission vehicle policy oriented scenario (technological deployment) [7].
![Figure 3 – [Intro] Org anigram of EU’s Cli mate Change Package.](https://thumb-eu.123doks.com/thumbv2/123dok_br/15754614.1074081/28.918.209.684.138.505/figure-intro-org-anigram-cli-mate-change-package.webp)
![Figure 9 – [Me thodology] Organigram of the left side .](https://thumb-eu.123doks.com/thumbv2/123dok_br/15754614.1074081/62.918.175.725.138.537/figure-thodology-organigram-left.webp)
![Table 9 – [Methodol ogy] Well-to-tank energ y and CO2 ratios.](https://thumb-eu.123doks.com/thumbv2/123dok_br/15754614.1074081/75.918.124.820.517.746/table-methodol-ogy-tank-energ-y-co-ratios.webp)
![Figure 26 – [Methodol ogy] Elec tricity power pl ant output.](https://thumb-eu.123doks.com/thumbv2/123dok_br/15754614.1074081/80.918.165.723.453.690/figure-methodol-ogy-elec-tricity-power-ant-output.webp)
![Figure 51 – [Rail] Ex-Tre mis 2007 details.](https://thumb-eu.123doks.com/thumbv2/123dok_br/15754614.1074081/97.918.298.642.124.408/figure-rail-ex-tre-mis-details.webp)
![Figure 52 – [Rail] Rel ati ve energy weights on Ex-Tre mis.](https://thumb-eu.123doks.com/thumbv2/123dok_br/15754614.1074081/98.918.237.663.124.411/figure-rail-rel-ati-energy-weights-ex-tre.webp)
![Table 21 – [Rail] Calculation results be twee n Ex-Tre mis and Eur ostat.](https://thumb-eu.123doks.com/thumbv2/123dok_br/15754614.1074081/99.918.116.820.289.469/table-rail-calculation-results-twee-tre-eur-ostat.webp)