1
Time-Frequency and Time-Scale Characterisation of the
Beat-by-Beat High-Resolution Electrocardiogram
Arnaldo G. Batista
*; J. Machado Rodrigues
†and Manuel D. Ortigueira
$*
Dept. de Física da FCT/UNL, Grupo de Biofísica e Engª Biomédica, Quinta da Torre, 2825-114 Monte de Caparica PORTUGAL
E-mail: [email protected] †
Dept. de Cardiologia do Hospital Pulido Valente, Alameda das Linhas de Torres 1500 Lisboa PORTUGAL
$
Uninova, Faculdade de Ciências e Tecnologia, Quinta da Torre, 2825-114 Monte de Caparica PORTUGAL E-mail: [email protected]
Abstract
Time-Frequency and Time-Scale distributions of sequential ST segments the High-Resolution Electrocardiogram, are represented using both the Morlet Wavelet based scalogram and the Zhao-Atlas-Marks representation. Resolution and representation readability, concerning the Ventri-cular Late Potentials are compared. The beat-to-beat variation of one VLP case is examined.
Keywords: Ventricular Late Potentials, High
Resolution Electrocardiography, Wavelet Analysis, Time-Frequency Analysis
1 Introduction
Ventricular Late Potentials are a warning sign of malignant arrhythmia and cardiac arrest. Since the early eighties signal averaging has been used as the major HR-ECG method [33], both in the research community and in the clinical set-up. Averaging reduces the HR-ECG to a single beat, therefore loosing all the individual beat’s information. In this work a time-scale and a time-frequency representation of a set of six consecutive ST segments are represented in the Time Scale and Time-Frequency planes. The continuous wavelet transform [18] (Morlet Wavelet) and the Zhao-Atlas-Marks Transform [36] are used. The value of these representations regarding the beat-to-beat VLP representation is assessed.
2 The
Scalogram
The continuous Wavelet Transform of a signal is a projection of that signal into a family of wavelets derived from a mother wavelet. In this work the Morlet wavelet is used:
The continuous–time wavelet transform of a function
f
( )
t
is given by:where a and b are real and denote the scale and
translation factors. The scalogram is obtained through the squared modulo of the wavelet coefficients, organized in the time-scale plane. Since frequency is a key concept in signal processing, the relation between scale and frequency is used for the scalogram ploting. However, one must have in mind that, the frequency axis should not be interpreted the same way as is in the classic Fourier analysis.
In recent times, wavelet analysis has been applied to the HR-ECG study, namely for the VLP detection and characterisation. [1, 2, 27]. It has been demonstrated the wavelet’s superior ability to decompose the short lived high frequency signals typically encountered in HR-ECG. However a trade-off between time and frequency resolution exists: higher scales (lower frequencies) corres-pond to lower time resolution.
( )
( )
dt
a
b
t
a
t
f
b
a
W
∫
−∞ ∞ +
−
=
1
*,
ψ
( )
t
=
e
−t
t
2
ln
2
cos
2π
ψ
3 The
Zhao-Atlas-Marks
Transform
Lander et al. [26] used the spectrogram as a tool for the HR-ECG analysis. Haberl et al.[23] introduced an objective factor to measure the VLP level in the ST segment, through the VLP energy distribution in the spectrogram. Other representations where used for the VLP study, namely the Wigner-Ville and the smoothed versions, [2, 3] in a attempt to overcome the spectrogram general lack of resolution. However it has generally been establish that the high level of cross terms in the Wigner-Ville distribution places a major difficulty in the interpretation of the time-frequency plane.
Fig. 1: Test signal representation for a Wavelet length 8/2200 ms. See text.
In a search for a distribution that reduces the interference level, as well as keeping some desirable Time-Frequency properties, recent reports account for the superior performance of a cone shaped transform, the Zhao-Atlas-Marks Transform, in the speech processing domain [36]. For signals that are parallel in the frequency direction, cross terms will mainly hide under the self terms, a unique property of this transform, whose kernel function is cone shaped. The parametric function is given by:
where
g
( )
τ
is a smoothing frequency window anda is usually taken as 1/2, in order to benefit of the
cross terms reduction property. The choice of
( )
τ
g
will determine if the distribution comply with certain desirable properties such as the time and frequency marginals.The time-frequency function is given by [13, 15]
4 Testing the Transforms
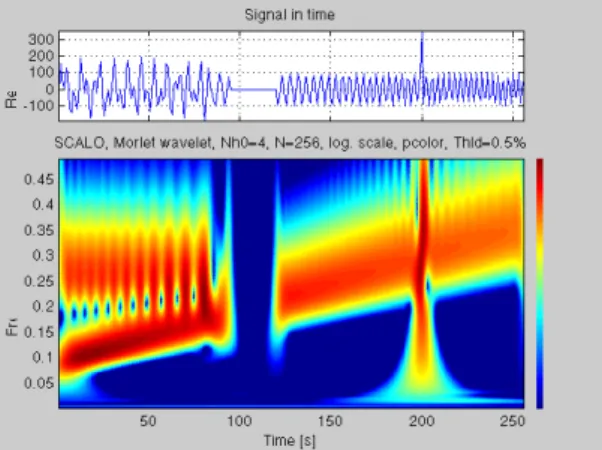
Before applying the Transforms to the VLP signals it is mandatory to get acquainted with the representations, through the visual inspection for a non-stationary artificial signal, whose ideal time-frequency representation is known beforehand. The chosen signal is multi-component with a chirp from 200 to 800 Hz, a 800 Hz tone that runs only in one third of the overall signal span, and a Dirac towards the end of the signal. Halfway through the time axis the signal is set to zero for around 10 ms to test the representation’s time support. The sampling frequency is 2.2 KHz. Figure 1 shows the scalogram of this signal for the Morlet Wavelet length 8/2200 ms at the coarsest scale. The lack of frequency resolution is very noticeable, as is the good time resolution (the Dirac is defined). Lower frequencies exhibit less time resolution, a feature of the scalogram. Increasing the wavelet length (figure 2) results in a increased frequency resolution and acceptable time resolution, which nevertheless decreased. This wavelet length will be kept throughout the VLP analysis. The cross terms level is reduced, which is a major advantage of this transform.
Fig. 2: Test signal representation for a Wavelet length 16/2200 ms. See text.
In both previous figures is noticeable that the chirp frequency resolution as frequency increases (and scale decreases).
( )
( )
(
)
(
τ
)
τ
τ
τ
π
ω
τ τ ωτd
du
u
f
u
f
e
g
a
t
C
a t a t j2
2
/
4
1
,
*+
−
=
∫
∫
+ − −∞ ∞ + −( ) ( )
θ
τ
τ
τ
( )
θτ
θτ
φ
a
a
g
sin
,
=
The same test signal is submitted to the Zhao-Atlas-Marks transform algorithm. The discrete algorithms require the definition of the window length, which should be chosen having in mind that the signal component under scrutiny should remain approximately stationary in the window length. This puts a difficulty if the signal parameters are not known, which is often the case in real life signals. A trial and error procedure may be in order. Figure 3 and 4 represent the test signal analysis with the Zhao-Atlas-Marks Transform for a 12 points (12/2200 ms) Hamming time smoo-thing window, and a 32 points (33/2200 ms) Hamming frequency smoothing window. In a attempt to increase frequency resolution Lh in Figure 4 was increased to 65 points. Frequency resolution increased with a small cost of increased cross-terms.
Fig. 3 Zhao-Atlas-Marks Transform for the test signal. A 12 points time window, and 32 points frequency window are used. See text.
Fig. 4 Zhao-Atlas-Marks Transform for the test signal. A 12 points time window, and 65 points frequency window are used. See text.
Comparing the Zhao-Atlas-Marks representations with the wavelet representations the former turns
out to be superior regarding the test signal time-frequency representation .
5 Application to the VLP
Analysis
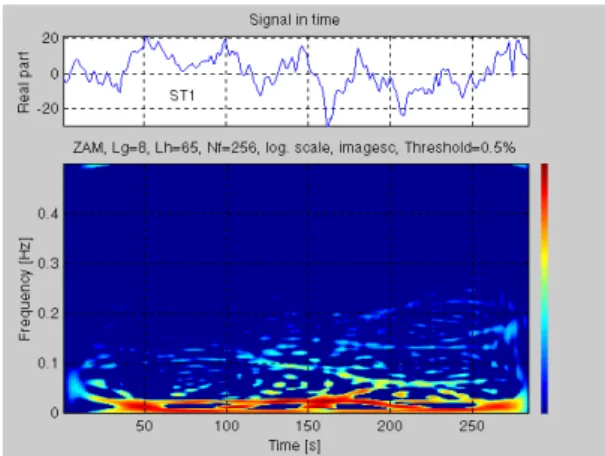
Seven consecutive ST beats of a patient with a ventricular arrhythmia, are represented in the Time Frequency plane (Figs.5, 7, 9, 11, 13 and 15) and in the Time-Scale plane (Figs. 6, 8, 10, 12, 14,16) to compare the performance. Is intended to study the VLP replication throughout the beats in the representations, and the representation’s readability. Looking down in the scalogram column (left column) it is patent that the main VLP structure concentrates in the middle of the segments with a certain degree of beat-to-beat resemblance. However, a beat to beat underlying variation is well patent
Beat 6 is quite “calm” in the sense that shows little VLP activity.
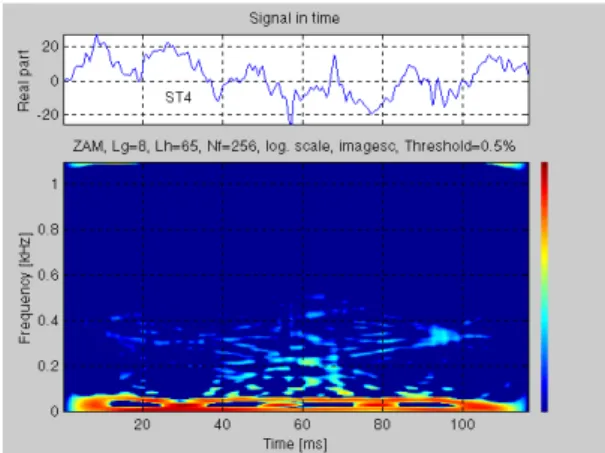
Looking down in the Zhao-Atlas-Marks column (right column) the representations show a great deal of detail. Resolution in both time and frequency is enhanced and results in a more accurate description of the signal. However, as for as global view of the VLP energy distribution, the scalogram seems to be more appellative.
In both representations, two lines (red-yellow) around 10 and 50 Hertz represent respectively the low-frequency component of the HR-ECG and the 50 Hz power line interference.
6 Concatenation
Following a technique previously used, [2] the six ST segments are concatenated into a single one and submitted to both the transforms (fig. 17 and 18). A single pane shows the six beats. The signal in the top is the concatenated ST segments.
It is patent the similarity between some beats regarding VLP’s.
The Zhao-Atlas-Marks transform of the concatenated ST segments shows much more resolution. Concatenation phase shifts shows in the low frequency level as “turns” (red and yellow) of the representation ( fig. 18).
Fig. 5: Scalogram for the ST1 segment.
Fig. 7: Scalogram for the ST2 segment
Fig. 9: Scalogram for the ST3 segment
Fig 6: Zhao-Atlas-Marks representation for the ST1 segment
Fig. 8: Zhao-Atlas-Marks representation for the ST2 segment
Fig. 10: Zhao-Atlas-Marks representation for the ST3 segment
Fig. 11: Scalogram for the ST4 segment
Fig. 13: Scalogram for the ST6 segment
Fig. 15: Scalogram for the ST1 segment
Fig. 12: Zhao-Atlas-Marks representation for the ST5 segment
Fig. 14: Zhao-Atlas-Marks representation for the ST6 segment
Fig. 16: Zhao-Atlas-Marks representation for the ST1 segment
Fig. 17: Scalogram of the concatenated ST segments. It is patent the underlying similarity between some beats regarding VLP’s. There is no VLP in beat 5.
Fig. 18: Zhao-Atlas-Marks transform of the concatenated ST segments. The same comments as for Fig. 16 are applicable here. The resolution is increased. Concatenation phase shifts shows in the low frequency level as “turns” (red and yellow) of the representation.
7 Conclusions
Time-Frequency and Time-Scale Representations are a promising technique in the individualisation of the VLP activity
Important information, both for the researcher and the clinical practitioner may be obtained from this representation. The Zhao-Atlas-Marks representa-tion proves to be extremely attractive for this study. The cross terms level is acceptable and the resolution is excellent. The scalogram exhibits lesser resolution but gives a global readability of the VLP’s energy dispersion.
Further work is going to be done to introduce objective quantifiers of the VLP presence, ridges extraction and multi-resolution analysis.
References
1. Batista, AMG. "Time-Frequency and Wavelet Analysis of the Beat-by-Beat High-Resolution Electrocardiogram". DPhil Thesis, Graduate
Div. of Biomedical Engineering, University of Sussex, UK, Sept. 1995.
2. Batista, A.M.G., English M.J.: “Ventricular
Late Potential Analysis with Musical and Harmonic Wavelets”: Medical Engineering and Physics, Vol. 20, pp. 773-779, Nº10, 1998.
3. Batista, AMG, English, MJ. "A
Multiresolution Wavelet Method for Charaterization of Ventricular Late Potentials". Computers in Cardiology , Sept. 1996.
4. Batista, AMG, English, MJ. "A Method for the
Ventricular Late Potentials Detection and Characterisation using Wavelets". 18th Int. Conf. of the IEEE Engineering in Medicine and Biology Society, Amsterdam, November 1996.
5. Boashash, B; Reilly,A;- “Algorithms for time-frequency signal analysis”;-in Time-Frequency Signal Processing: Methods and Applications. Edited by Boashash, B. , Halsted Press 1992, pp 163-181.
6. Boashash, B; Jones, G;- “Instantaneous frequency and time-frequency distributions”;-in Time-Frequency Signal Processdistributions”;-ing: Methods and Applications. Edited by Boashash, B. , Halsted Press 1992, pp 43-73. 7. Boyd, EGC;-"A solution to difficult power
frequency interference on ECG recordings"-Pace, January/February 1985 Vol 8 pp17-25.
8. Breithardt,G; Cain, ME; El-Sherif, N; Flowers, N; Hombach, V; Janse, M; Simson, MB; Steinbeck,G;- "Standards for analysis of ventricular late potentials using high resolution or signal-averaged electrocardiography. A statement by a Task Force Committee between the European Society of Cardiology, the American Heart Association and the American College of Cardiology "- European Heart Journal (1991) 12, 473-480.
9. Choi, HI; Williams, WJ;- ” Improved time-frequency representations of multicomponents signals using exponential kernels”; IEEE Trans. Acoust. Signal Process., 37, no. 6 pp 862-871,1989.
10. Claasen, TA; Mecklenbräuker, WF;-” The Wigner distribution — A tool for time-frequency signal analysis, part I: Continuous-time signals”- Philips Journal of Research, Vol. 35 No. 3- 1980.
11. Claasen, TA; Mecklenbräuker, WF;-” The Wigner distribution — A tool for time-frequency signal analysis, part II: Discrete-time signals”- Philips Journal of Research, Vol. 35 Nos. 4/5- 1980.
12. Claasen, TA; Mecklenbräuker, WF;-” The Wigner distribution — A tool for time-frequency signal analysis, part III: Relations with other time-frequency signal transformations”- Philips Journal of Research, Vol. 35 Nos. 6- 1980.
13. Cohen,L;-”Time-frequency distributions−A review”;- Proceedings of the IEEE, Vol. 77, No, 7, July 1989.
14. Cohen,L; Lee,C;- "Instantaneous bandwidth"- Time Frequency Signal Analysis- Methods and Applications, editor: Boashash,B, Halsted Press. pp 98-117.
15. Cohen,l;-"Time-Frequency Analysis" Prentice-Hall Signal Processing Series; Prentice Hall, Englewood Cliffs, 1995.
16. Daubechies, I; “ Orthonormal bases of compactly supported wavelets “. Communications on Pure and Applied Mathematics, Vol. XLI pp. 909-996, 1988 17. Daubechies, I; -”The wavelet transform,
time-frequency localization and signal analysis”. IEEE Transactions on Information Theory, Vol. 36, No.5, September 1990, pp 961-1005. 18. Daubechies, I; -”Ten lectures on wavelets”,
Society for Industrial and Applied Mathematics, 1992.
19. Flandrin, P; -” Some aspects of non-stationary signal processing with emphasis on time-frequency and time-scale methods ”. Wavelets, Time-frequency Methods and Phase Space, 2nd. Ed., Combes, JM; Tchamitchian, Ph, Editors, 1989, pp. 68-98.
20. Flandrin, P; Rioul, O; -” Wavelets and affine smoothing of the Wigner-Ville distribution “. Proc. IEEE Int. Conf. Acoust. Speech Signal Proc., Albuquerque, April 1990, pp. 2455 21. Flandrin, P; Stockler, J; - “Time-Frequency
and Time Scale Analyis”. Academic Press, 1999
22. Gomes, JA; Winters, SL; Steward, D; "Late potentials on signal averaged ECG: Incidence, characteristics and significance" Circulation, 1988 (c), 78: II, 52.
23. Haberl, R; Gerhard, J; Steinbigler, P; Steinbeck, G;- ”Spectro-Temporal mapping of the surface electrocardiogram”- in High Resolution Electrocardiography"; edited by El-Sherif, N; andTuritto G, Futura Publishing Company NY, 1992 pp.635-653.
24. Haberl, R; Gerhard, J; Steinbigler, P; Steinbeck,G;-”Spectro-Temporal mapping of the surface ECG for detection of ventricular late potentials”- in Signal Averaged Electrocardiography, Concepts, Methods and Applications Ed. by J. Anthony Gomes- Kluwer Academic Publishers 1993, pp. 125-135.
25. Kubara-I; Ikeda-H; Hiraki-T; Yoshida-T; Ohga-M; Imaizumi; - Dispersion of filtered P wave duration by P wave signal-averaged ECG mapping system: its usefulness for determining efficacy of disopyramide on paroxysmal atrial fibrillation ; J-Cardiovasc-Electrophysiol. 1999 May; 10(5): 670-9
26. Lander, PT; Albert, DE; Berbari, EJ;- “ Spectrotemporal analysis of ventricular late potentials”; J Electrocardiology, 1990, vol. 23, pp.95-109
27. Meste, O; Rix, H; Jane, R; Caminal, P; -”Detection of late potentials by means of wavelet transform”. IEEE Engineering in Medicine and Biology Society, 11th Annual International Conference, 1989, pp 28-29. 28. Morlet, D; Peyrin, F, Desseigne, P; Toubol, P;
Rubel, P; -" Time-scale analysis of the high-resolution signal-averaged surface ECG using wavelet transformation ". IEEE publication (?), 1992, pp. 393-396.
29. Newland, D; -”Harmonic wavelet analysis”. Proc. R. Soc. Lond., 1993, 443 A , pp 203-225.
30. Newland, D; -”An introduction to random vibrations, spectral and wavelet analysis“. Third edition, Longman Scientific & Technical, 1993
31. Newland, D; -”Some properties of discrete wavelet maps“. Probabilistic Engineering Mechanics, Vol. 8, 1993.
32. Rioul, O; Flandrin, P; -” Time-scale energy distributions: A general class extending wavelet transforms “. IEEE Transactions on Signal Processing, July 1992, pp. 1746-1757 33. Raitt-MH; Ingram-KD; Thurman-SM; -
Signal-averaged P wave duration predicts early recurrence of atrial fibrillation after cardioversion. Pacing-Clin-Electrophysiol. 2000 Feb; 23(2): 259-65
34. Simson, M; -"Use of signals in the terminal QRS complex to identify patients with ventricular tachycardia after myocardial infarction". Circulation 64, No. 2, 1981, pp. 235-242.
35. Yamagata-T; Shimizu-A; Ueyama-T; Hayano-T; Esato-M; Tatsuno-H; Ohmura-M; Assessment of right artrial mapping and P wave-triggered signal-average in patients with paroxysmal atrial fibrillation; J-Electrocardiol. 1999 Jul; 32(3): 243-51
36. Zhao, L; Atlas, L.E; Marks, R.J.: “The use of cone-shaped kernels for generalized time-frequency representations of nonstationary signals”, IEEE Trans. Acoust., Speech, Signal Processing, vol. 38, pp 1084-1091, 1990.