Two different experiments on teaching how to
program with active learning methodologies: a critical
analysis
Sónia Rolland Sobral
REMITUniversidade Portucalense Porto, Portugal
Abstract — To combat the difficulty that many students must learn how to program, the failure in introductory programming courses and the traditional high dropout rate, teachers have to use strategies that motivate and improve students' skills. Active methodologies and student-centered instruction can be a solution to get students interested on the subject, preparing assignments while learning in the classroom. This article reports on two very different experiences in two academic years. In the first year, agile SCRUM methodology, groups of five students, three interactions and a final project were used. In the second year, the Project based Learning was used with groups of three students for two different products, changing the composition of the groups. In both cases, peer classification was used. The results show that in the first case there is an increase in the approval rate, while in the second case there is an increase in the dropout rate. In this article we make a critical analysis of the results, analyzing what can be beneficial in one experiment and in the other in order to find an ideal model for using active methodologies to teach freshman computer science students how to program.
Keywords - Project Based Learning; SCRUM; Introduction to programming; Motivation; Active Learning Methodologies; Peer assessment
I. INTRODUCTION
Teaching programming to students who do never did it before is not an easy task. Some say that programming is very difficult [1] [2] while for others it may be easy [3]. The truth is that traditionally introductory programming courses have high dropout and failure rates [4]. A teacher has a moral and professional obligation to develop strategies to combat this problem. Active teaching methodology has been widely embraced for this purpose [5] [6], involving students in doing things and thinking about the things they are doing [7]. It is a process of having students engage in some activity that forces them to reflect upon ideas and how they are using those ideas, keeping students mentally (and often physically) active while learning, through activities that involve gathering information, thinking and problem solving [8]. Active learning presupposes the concept of Student-Centered Instruction (SCI), often defined by contrast with traditional instructional approaches characterized by greater teacher direction [9]. SCI is an instructional approach in which students influence the content, activities, materials, and pace of
learning. This learning model places the student (learner) in the center of the learning process. The instructor provides students with opportunities to learn independently and from one another and coaches them in the skills they need to do so effectively [8]. It is proven to be a good way to motivate students and make them work on the subjects that are taught in the classroom, attracting and engaging them. Herzberg’s Two-Factor Theory [10] differentiates motivator factors from hygiene factors: intrinsic and extrinsic to the job respectively. The Three-Motivator Theory [11] indicates that course success can be improved by removing de-motivators, increasing intrinsic motivators or increasing extrinsic motivators, or any combination of these three, as appropriate in the course context. There are several studies that prove the advantages and motivation created in students with the use of active methodologies as opposed to passive learning in large classes, such as in Technology-Enabled Active Learning (TEAL) [12]. In programming courses, instructional activities encourage students to learn how to program by doing programming and thinking about what they are doing. A variety of approaches fit beneath the umbrella of student-centered learning, including case-based learning, goal case-based scenarios, learning by design, project-based learning, and problem-project-based learning [9].
Project-based learning is a comprehensive approach to classroom teaching and learning that is designed to engage students in investigation of authentic problems. Students are responsible for both the questions and the answers to such problems [13]. This form of learning allows students to experiment and improve their skills by developing medium projects in contrast to small programs as is usual in courses of this type. With this methodology the students gain independence and self-study traits, accompanying the subjects taught in classes with aspects related to real life. SCRUM is a form of agile approach to software development [14]: a framework within which people can address complex adaptive problems, while productively and creatively delivering products of the highest possible value [15]. The teams (scrum team) are usually made of up to 6 to 10 people, one of which
is the product owner and another the scrum master. The product backlog is divided into n sprints, each containing a sprint backlog defined at the beginning of each sprint in a meeting (sprint planning meeting) where the entire team must be present and where the Product Owner will be the one who prioritizes the tasks to be included in this list [16] [17].
This article reports on two very different experiences in two academic years. On the first year, agile SCRUM methodology, groups of five students, three interactions and a final project were used. On the second year, Project Based Learning was used with groups of three students for two different products, changing the composition of the groups. In both experiments, the elements of the group were responsible for the final product, however the teacher was indirectly following the work of the groups. One of the forms of control was the use of peer evaluation done anonymously by each member of the group. Peer assessment using marks, grades, and tests have shown positive formative effects on student achievement and attitudes [18]. Since peer assessment is used in part of the classification of each project, the distribution of students by the groups was made by the teacher. This article is divided into five parts: the course characterization: program, schedule, evaluation, and demographics of participants; characterization of the projects: aims, rules and surveys; the results and the discussion as well as final conclusions.
2.THE INTRODUCTORY PROGRAMMING COURSE A. Program
The course is part of a university degree in Computer Science. It is taught in the first semester of the first year and constitutes the students' first contact with computer thinking and a programming language. In this course of a propaedeutic nature, a student should, among other skills to be achieved, be able to develop and implement computer solutions for problem solving, that is, to learn correctly and effectively how to program. Before elaborating a program, the student must know how to understand the problem, know how to develop strategies for the precise specification of the problem he intends to solve with the machine, establish methods for the detailed and rigorous description of solutions that can be implemented on a computer. The programming language chosen was C. Classroom classes are divided into theoretical and practical laboratory classes, respectively with 2 hours and 4 hours per week. The planned program includes Computer Thinking using Top-Down and Algorithms; Conditional structures; C Programming Language; Cycles; Functions and Procedures; Arrays: one dimension and several; Array ordering and search; Record arrays (1 to 1, 1 to n and n to n); Alphanumeric and frequency of sub-alphanumeric.
B. Evaluation
The evaluation method of the discipline is based on a continuous evaluation model with four elements of evaluation and attendance requirement above 60%. The tests foresee the use of computers and paper and have an expected duration of 90 minutes with 15 minutes of tolerance. The exam (resource, special) is expected to last 120 minutes with a 15-minute tolerance. B.1 Academic year 1
Grade = Test1 * 20% + Test2 * 25% + Test3 * 30% + Project * 25%. Where Test1 is the test score taken in the fifth week of classes, Test2 is the test score taken in the tenth week of classes, Test3 is the test score taken in the last week of classes of the semester. Project is the grade assigned to the student in the project presented in the last week of classes in the semester. Others = Exam * 75% + Project *25%
B.2 Academic year 2
Grade = Test1 * 40% + Test2 * 40% + Project1 * 10% + Project2 * 10%. Where Test1 is the test score taken in the eighth week of classes, Test2 is the test score taken in the last week of classes of the semester. Project1 is the grade given to the student in the project presented in the eighth week of classes and Project2 is the grade assigned to the student in the project presented in the last week of classes in the semester. Others = Exam.
C. Demographics of participants C.1 Academic year 1
55 students were enrolled and divided into two practical classes. However, 9 students never attended any theoretical or practical classes. 46 students responded to an initial survey: three female (6.5%) and 43 males (93.5%). The average age was 19.9 years and the most frequent age was 18 years. The maximum age was 33 and the minimum was 18, with 96% of the students being 18, 19 or 20 years old. 30 students had a computer science course in secondary education: 22 attended computer applications B on the 12th year and eight Information and Communication Technologies (ICT) on the 9th year. 28 students replied that they had some programming knowledge, having referred to JavaScript, C, Pascal, and Python.
C.2 Academic year 2
52 students were enrolled and divided into two practical classes. However, 12 students never attended any theoretical or practical classes. 37 students responded to an initial survey: five female (14%) and 32 males (86%). The average age was 19.2 years and the most frequent age were 18 years. The maximum age was 34 and the minimum was 18, with 81% of the students being 18, 19 or 20 years old. 19 students had a computer science course in secondary education: 14 attended computer applications B on the 12th year, four Information and Communication Technologies (ICT) on the 9th year and a Web Design in the 10th, 11th and 12th years. 19 students replied that they had some programming knowledge: having referred
to Java, JavaScript, C #, C, Pascal, HTML and CSS, Visual Basic and Python.
3.PROJECTS
Group work is a structured way to get students to put into practice what they have been learning in the curricular units. As the work model includes peer group assessment, it was decided not to allow students to form groups, and this task is often done only out of friendship, which would jeopardize a fair assessment of colleagues.
A. Phases A.1 Academic year 1
There were three phases of work: the 5th, 10th and 15th weeks, but with one presentation and one final classification. A.2 Academic year 2
There were two phases of work: one that ends in the middle of the semester and another that ends with the end of classes. In the proposed work, groups of three elements are created by the Professor.
B. Constitution of working groups B.1 Academic year 1
On the proposed work, groups of five elements are created by the Professor. For the constitution of working groups in the first phase, the attendance form in the course was used and divided into two parts: students who had already attended the class and students who had always been absent. The distribution of students by groups was presented in the third week of the semester. 11 groups with five students were created. The group remains the same from the beginning to the end of the semester.
B.2 Academic year 2
For the constitution of working groups in the first phase, the attendance sheet was used: students were ordered according to their number of attendances in the first three weeks of classes. The distribution of students by groups was presented in the fourth week of the semester. The students were given a statement that included the subject taught until half of the semester. 13 groups were created: 11 of the groups with three students and two groups with two students. For the constitution of working groups in the second phase, the student's grade sheet was used in the first test: students were ordered according to their test grade 1. The distribution of students by groups was presented in the tenth week of the semester. The students were given a statement that included the material taught until the end of the semester. 12 groups were created with three students on each group. The constitution of the groups is different on project 1 and on project 2.
C. Submissions
The product of each phase of work is submitted into MOODLE by the project leader: the initial product consists of a document with the name of the project leader and the explanation of how
they intend to solve the problem. The final product consists of a program in C language and a document with an explanation of the program: scheme, algorithm and / or text. Presentation is mandatory. The project statement provided that each group would choose a different type of store simulate the various activities of that business.
D. Surveys
In each of the phases of the group work, two surveys are answered by each element, where each of the elements evaluates their peers. The grade of each of the phases assigned by the teacher is corrected by the average of the grades assigned by the peers of each of the members of the group, provided that at least two other members of the group answer the surveys. Each student had to answer a survey at the beginning of each phase of the project and another one on the delivery day. The surveys were anonymous but included the number of students. Sevens questions were answered on a scale of 0 to 5, "nothing" to "excellent" respectively. Three questions for each colleague were answered also on the same scale. There was a final open question for comments and suggestions. The questions were:
1. I am enjoying this group work 2. I am enjoying working with this group
3. I feel that I improve my skills in the course because of this group work
4. I feel that I improve my group work skills because of this group work
5. My presence at group meetings (face-to-face, skype ...) 6. My effort put into group work until today
7. Self-assessment from day 1 to today regarding group work
[Colleagues] A. Colleague name
8. My colleague's attendance at group meetings (face-to-face, skype ...)
9. My colleague's effort put into group work
10. My colleague's assessment of group work Observations and suggestions.
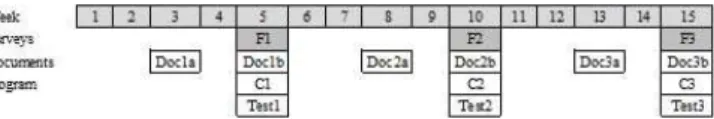
E. Summary of the semester calendar E.1 Academic year 1 The following figure outlines the surveys, documents, and C programs which are to be submitted by students each week, and also indicates the weeks for which the two tests are scheduled: - F1, F2 and F3 are the surveys for the end of each of the three project phases;
- Doc1a, Doc1b, Doc2a, Doc2b, Doc3a and Doc3b are the beginning and end documents for each of the three project phases. - C1, C2 and C3 are the C programs at the end of the first and second phases of the project;
- Test1, Test 2 and Test3 are the tests from the 5th, 10th and 15th week.
Figure 1. Weekly schedule of surveys, documents, C programs and tests, Academic year 1.
E.2 Academic year 2
Figure 2 outlines the surveys, documents and C programs which are to be submitted by students each week, and also indicates the weeks for which the two tests are scheduled: - P1a, P1b, P2a and P2b are the surveys for the beginning and end of each of the two project phases;
- Doc1a, Doc1b, Doc2a and Doc2b are the beginning and end documents for each of the two project phases.
- C1 and C2 are the C programs at the end of the first and second phases of the project;
- Test 1 and Test 2 are the tests from the beginning of the 8th week and the end of the 14th week.
Figure 2. Weekly schedule of surveys, documents, C programs and tests, Academic year 2.
F. The problem F.1 Academic year 1
The objectives of the work were done by the teacher. Each of the phases has to follow the material taught so far in class. The text of the problem was given with the list of the constitution of the groups.
F.2 Academic year 2
The objectives of the work were defined by the teacher, but the text allowed the students to choose some aspects as they wanted and liked. When saying that what was intended was a store management, students could choose their business. The choices in the first project were travel agency, school supplies, DIY store, cinema, disco, pharmacy, ice cream shop, jewelry, restaurant, shoe store, supermarket, technology store and pet store.
3.RESULTS
A. Academic year 1
F1 survey was answered by 24 students, F2 by 28 and F3 was answered by 24 students, although the distribution of groups in the first part of the project foresees 55 students. There are no significant differences between the responses for the three project phases. It only appears that the first two questions (enjoying the work and the group) and questions 3 and 4 (improving skills) have a worse average in the first questionnaire. And that the highest averages are the responses relative to the student himself and the worst are relative to his colleagues (Figure 3). The most frequent
answer to all questions in phase 1 was 5, excellent. The most frequent answer to almost all questions in phase 2 was 5, excellent except for the evaluation of colleagues which was 4. The most frequent answer to almost all questions in phase 3 was 5, excellent except for the questions related to enjoying the work and the group, which was 4 (Figure 4).
Figure 3. Questions, average, academic year 1.
Figure 4. Answers to questions by project phase, academic year 1.
Only 3 students wrote comments at the end: “Maximum 3 elements per group; everything else was interesting."; "Smaller groups." And "It's preferable that everyone can choose their group colleagues". Initially there were 11 groups of 5 students (i1). There were final presentations for 10: two groups of one student and two groups with two students (Table 1).
TABLE 1. STUDENT NUMBER AT THE FINAL BY GROUP NUMBER ACADEMIC YEAR 1.
Of the 33 students who attended any test (test1 + test2+ test3 or appeal exam), 29 passed and 4 failed. Only two of the 22 students who missed the exams submitted and presented the last phase of the project.
3,2 3,7 4,2 4,7 Question nº F1 F2 F3 G1 G2 G3 G4 G5 G6 Final 5 4 5 5 4 4 G7 G8 G9 G10 G11 Final 2 0 2 1 1
TABLE 2.FINAL RESULTS, ACADEMIC YEAR 1. Final Result n Final Project Approved 29 28 Disapproved 3 Missed 22 2
B. Academic year 2
P1a survey was answered by 34 students, P1b by 35, P2a by 28 and P2b was answered by 20 students. Although the distribution of groups in the first part of the project foresees 37 students and the second part of the project has 36 students, the presentations were made by 36 and 16 students, respectively. The averages dropped in almost all questions, with Pa1> Pa2> Pb1> Pb2. This did not happen only in questions 3, 5 and 6. The best averages of answers were those of questions 5 and 6, with values greater than 4.5 (Figure 5). The most frequent answer to the questions was 5 (excellent), except for question 1 and 2 in the second phase of project which was 4 (Figure 6). Only 7 students wrote comments at the end of the Pa2 survey, 3 to say that they liked the work, 4 to show displeasure in relation to the group:
“We did a good job, despite having some difficulties. We should have organized ourselves better”; “The group runs well there is a good interaction”; “A very interesting work, which completely helps to better understand the concepts taught and practiced in class”. “I enjoyed doing the job and helped me develop programming skills. But I had some complications with the group because we were only two and my colleague had some difficulties in the matter, which meant that I had to do a lot of the work alone.”, “I liked the work but I didn't get along with my partner.”, “We have no 3rd element”, “The work was all done by {} and by me”. To the P2b survey, only 4 made final comments, all to refer to their group colleagues: “We divided everything into parts, and everyone did their part. The group worked well.”, “I did the work myself without the help of any colleagues.”, “None of the group members bothered to come to me and ask about the job. * only worried about it when it was 2 or 3 days before delivery but offered no help.” and “It was a job that I worked more in”.
Question nº
Figure 5. Questions, average, academic year 2.
Figure 6. Answers to questions by project phase, academic year 2.
At the beginning of the first project, there were 37 students and 35 students presented the first project. In the second part of the project there were 36 students at the beginning and 16 students presented the second project. In the latter case, two groups ended with just one student, five of the groups did not show any students.
In the Table 3 we see that initially in project 1 there were 11 groups of 3 students and 2 groups of 2 students (i1). There were presentations for the 13 groups, 9 with 3 students and 4 with 2 students (in). In project 2 there were 12 groups of 3 students (i1). There were presentations for the 7 groups, four with 3 students, one with 2 students and two ended with just one student (in).
The teacher's assessment (0 to 5) was decreasing in the case of the first project (in which students were grouped by class attendance) (Tg). On the case of the second project, there was no significant difference in relation to the grades attributed by the teacher to each of the groups. Columns C1, C2 and C3 show the evaluation of the pairs in a decreasing way. These assessments were generally better for project 1 than for project 2.
TABLE 3.GROUPS: STUDENTS NUMBER INITIAL (I1), FINAL (IN), TEACHER GRADE (TG) AND PEER ASSESSMENT (C1,C2 AND C3), ACADEMIC YEAR 2.
3,200 3,400 3,600 3,800 4,000 4,200 4,400 4,600 4,800 P1a P1b P2a P2b
Of the 27 students who attended any test (test1 + test2 or appeal exam), 15 passed and 12 failed. Of the 15 that were approved, 14 presented themselves in the two phases of the project (P1 and P2). Of the 12 that failed, only 2 worked on the second project. None of the 25 students who missed the exams submitted and presented the second phase of the project.
TABLE 1.FINAL RESULTS, ACADEMIC YEAR 2.
Final Result n P1 P2 Approved 15 14 14 Disapproved 12 12 2 Missed 25 9 0
grade would not be considered supplementary season. In the case of the first academic year the project grade was worth 25% of the final grade. In both academic years, only one student who passed did not make the project. It is concluded that the work helped them to obtain the necessary skills. In the second year, it was found that a large part of the students who scored low in the first test did not do the second project: the reasons may be lack of necessary knowledge, student strategy or dropping out of the course.
The answers to the questionnaire questions show that most students really liked the project, almost always classifying each of the items asked as excellent. However, it was found that the average of responses was almost always decreasing as the semester progressed.
4. DISCUSSION
Considering only at the approval rates, we find that in academic year 1 there were better results: 88% or 53% (in the first case only those who always appeared and in the second also considering those who never appeared) and 56% or 29% in the second academic year. In second academic year the percentage of evaluation was relatively small (10%+10%) and the work
There were many problems with working groups, which is reflected in the evaluations attributed to their peers. These ratings
were better in the first part of the project than in the second. These evaluations were not always reflected in what happened within the groups: sometimes there were situations in which the students felt that they had no support from colleagues and evaluated those same colleagues with positive grades.
This group work was very beneficial for students who were motivated and intended to succeed in the course, but not for other students who do not work daily or who have difficulties in obtaining the skills necessary to succeed in a course of this type. A group project like the one proposed further widens the gap between students who pass and fail or drop out.
5.CONCLUSION
These two experiences were very different: in the case of SCRUM there are several interactions up to the final result and in Project Base Learning there are two final products with little time for interactions. In the first case there was a group of five elements throughout the semester, in the second the group was changed in the middle of the semester, that is, there were two different groups of three elements each which changed midsemester. In both cases it was found that the students who approved the course did the work (only one did not and was successful at the end of the semester, in both academic years). In the second case, there is a large percentage of students who did not do the second project. Probably because the groups were made by using the grades of the first test and the last groups were made up of worse students. There are several lessons to be learned: a final project with several interactions seems to be a better alternative than two small jobs. Several students reported that five students is too large a group, but three seems too small for a job that has medium / high complexity. If the percentage of the formula intended for the job is small (or even non-existent for recourse or special times), it is no longer “motivating” for the worst students to work.
In both academic years, better students are even more motivated with an active teaching strategy. The worst students are unable to follow a project (which they consider difficult) and give up, especially if they are grouped by first test grade. The challenge will then be to be able to motivate these students and reduce the dropout rate.
REFERENCES
[1] S. Bergin and R. Reilly, "Programming: Factors that Influence SuccessSusan," in Proceedings of the 36th SIGCSE Technical Symposium on Computer Science Education, 2005.
[2] B. A. Becker, G. Glanville, R. Iwashima, C. McDonnell, K. Goslin and C. Mooney, "Effective Compiler Error Message Enhancement for Novice Programming Students," Computer Science Education, pp. 148-175, 2016.
[3] A. Luxton-Reilly, "Learning to Program is Easy," in ACM Conference on Innovation and Technology in Computer Science Education, 2016.
[4] A. Robins, J. Rountree and N. Rountree, "Learning and Teaching Programming: A Review," Computer Science Education, vol. 13, no. 2, pp. 137-172, 2003.
[5] C. Hundhausen and J. Brown, "What You See Is What You Code: A "live" algorithm development and visualization environment for novice learners," Journal of Visual Languages and Computing, vol. 18, no. 1, pp. 22-47, 2007.
[6] G.-M. Kao, S. Lin and C.-T. Sun, "Beyond sharing: Engaging students in cooperative and competitive active learning," Educational Technology and Society, vol. 11, no. 3, pp. 82-96, 2008.
[7] C. C. Bonwell and J. A. Eison, "Active Learning: Creating Excitement in the Classroom," ERIC Digest, 1991.
[8] J. Michael, "Where’s the evidence that active learning works?," Adv Physiol Educ, vol. 30, no. 4, 2006.
[9] S. Pedersen and M. Liu, "Teachers’ beliefs about issues in the implementation of a student-centered learning environment," Educational Technology Research and Development, vol. 51, no. 1, p. 57–76, 2003.
[10] F. Herzberg, "One more time: How do you motivate employees?," Harvard Business Review, vol. 46, no. 1, pp. 53-62, 1968.
[11] U. G. O. a. K. J. Nikula, "A Motivation Guided Holistic Rehabilitation of the First Programming Course," ACM Transactions on Computing Education, vol. 11, no. 4, 2011.
[12] Y. J. a. B. J. W. Dori, "How Does Technology-Enabled Active Learning Affect Undergraduate Students' Understanding of Electromagnetism Concepts?," The Journal of the Learning Sciences, vol. 14, no. 2, p. 243– 279, 2005.
[13] P. C. S. E. M. R. W. K. J. S. G. M. &. P. A. Blumenfeld, "Motivating project-based learning: Sustaining the doing, supporting the learning," Educational Psychologist, vol. 26, no. 3-4, p. 369–398, 1991. [14] K. Beck, M. Beedle and A. Bennekum, "Manifesto for Agile Software
Development," 2001.
[15] J. Sutherland and K. Schwaber, "SCRUM Guides," ScrumGuides.org, 2020. [Online]. Available: ScrumGuides.org.
[16] L. Rising and N. Janoff, "SCRUM software development process for small teams," IEEE Software, vol. 17, no. 4, pp. 26-32, 2000. [17] T. Dybå and T. Dingsøyr, "Empirical studies of agile software
development: A systematic review," Information and Software Technology, vol. 50, no. 9-10, pp. 833-859, 2008.
[18] K. Topping, "Peer assessment between students in colleges and universities," Review of Educational Research, vol. 6, no. 8, pp. 249-276, 1998.
[19] D. Knuth, The Art of Computer Programming, Addison-Wesley, 1968. [20] D. Gries, The science of programming, Springer, 1981.
[21] E. W. Dijkstra, A Discipline of Programming, Prentice Hall, 1976. [22] A. Aho and J. D. Ullman, Foundations of Computer Science: C Edition
(Principles of Computer Science Series), W. H. Freeman, 1994.