IN ST IT U T O D E C IÊ N C IA S B IO M ÉD IC A S A B EL S A LA Z A R F ra n cis co d e S á F er re ir a. D ev e lo p me n t o f b ior e me d ia tio n t e ch n o lo g ie s b a se d o n de e p s e a or g a n is m s
ev
elo
pm
en
t o
f b
io
re
m
edia
tio
n
chn
o
lo
gie
s b
as
ed o
n de
ep s
ea
ani
sm
s
r a n c isc or
o m ã o d es
áF
er r eir aDevelopment of bioremediation
technologies based on deep sea
organisms
F
ranciscor
omão des
áF
erreiraM
2019 M. ICB AS 20 19 MESTRADOFRANCISCO ROMÃO DE SÁ FERREIRA
DEVELOPMENT OF BIOREMEDIATION TECHNOLOGIES
BASED ON DEEP SEA ORGANISMS
Dissertação de Candidatura ao grau de Mestre em Toxicologia e
Contaminação Ambientais submetida ao Instituto de Ciências Biomédicas
de Abel Salazar da Universidade do Porto.
Orientador – Doutora Ana Paula Mucha
Categoria – Investigadora auxiliar
Afiliação – Centro Interdisciplinar de Investigação Marinha e Ambiental
(CIIMAR)
Co-Orientador – Doutora Maria de Fátima Magalhães Carvalho
Categoria – Investigadora auxiliar
Afiliação – Centro Interdisciplinar de Investigação Marinha e Ambiental
(CIIMAR)
Co-Orientador – Doutora Catarina Maria Pinto Mora Pinho de Magalhães
Categoria – Professora auxiliar
2
Acknowledgments
Giving thanks it’s always a bittersweet thing to do because it feels great to be thankful, but we always forget thanking to someone/something. I hope I don’t forget anyone or anything.
Firstly, I would like to thank to myself, since I’ve been working for two years on this dissertation, I deserve some credit. I think it is not selfish to be proud of what we do, and we should own credit for our accomplishments. Doing this master’s degree and this dissertation was a huge goal on my life and I made it, so mission accomplished.
Next, I would like to thank to my supervisor, Ana Paula Mucha, for all the time, dedication, exigency and patience given throughout this past year. The relationship between student and orientator is much similar as a friend/familiar one, since we have ups and downs, so it’s not always easy, but deep down we really want the best for each other and in that matter, I had the best orientator possible. It was an amazing opportunity to work in such an interesting and beautiful project as this. Thank you also for believing in me and seeing my true skills and supporting me in my future, including my ERASMUS internship and my current job.
To my co-orientator, Fátima Carvalho, I would also like to thank for all the time and dedication given throughout the year and for providing me all the resources needed to be able to produce this master’s thesis.
For my co-workers and friends from EcoBioTec, thank you so much to all of you without exception. Each one of them helped me in different ways and areas to all my questions and doubts and even more. For that I’m eternal thankful. We’ve passed wonderful and incredible moments inside and outside our workplace and I can gladly say that I will leave this place with friends.
To the Interdisciplinary Centre of Marine and Environmental Research (CIIMAR) and Departamento de Química, Faculty of Sciences of University of Porto (FCUP) for providing the installations and facilities used in this work.
3 To ICBAS-UP, which was my home faculty university for 6 entire years that watched me grow and change into the man and human being I am today. Special thanks to the post-graduation office staff who were always ready to answer my thousands of doubts, specially Mrs. Zélia Lopes. It was a hell of an amazing journey and I will never forget the moments passed inside and outside those walls. Thank you for giving me a future and friends for life.
To all my family, friends and lovers that were always there supporting, observing and inspiring me in all the good and bad moments and all across my journey and growth throughout this part of my life. A special thanks to my mother Emília, who is my shelter, my hero, my love and my biggest strength in this battle that is life. I love you. I owe you everything and more.
Finally, thank you God/Universe/Life for all that happened so far in my life, both bad and good.
4 The research team is sincerely grateful to the Portuguese Hydrographic Institute and to the University of Aveiro for providing the deep sea sediment samples used in this study, collected on behalf of the oceanographic missions SEDMAR 1/2017 and MarMine Arctic Mid-Ocean Ridge (AMOR), respectively.
This research was partially supported by the Strategic Funding to CIIMAR through national funds provided by FCT - Foundation for Science and Technology (UID/Multi/04423/2019) and ERDF - European Regional Development Fund (POCI-01-0145-FEDER-007621), in the framework of the programme PT2020; by the project CORAL - Sustainable Ocean Exploitation: Tools and Sensors (reference NORTE-01-0145-FEDER-000036), supported by North Portugal Regional Operational Programme (NORTE 2020), under the PORTUGAL 2020 Partnership Agreement, through the European Regional Development Fund (ERDF); and by project BIOREM - Bioremediation of hydrocarbon pollutants by autochthonous microorganisms in aquatic environment, PTDC/BTA-GES/32186/2017 and POCI-01-0145-FEDER-032186, supported by Fundo Europeu de Desenvolvimento Regional (FEDER) through COMPETE2020 - Programa Operacional de Competitividade e Internacionalização (POCI) and FCT / MCTES.
5
Resumo
Os hidrocarbonetos de petróleo presentes no petróleo bruto, como os liberados nos ecossistemas marinhos, por exemplo, pelos acidentes do Exxon Valdez, BP Deepwater Horizon e Prestige, são produtos naturais derivados de algas aquáticas estabelecidas entre 180 e 85 milhões de anos atrás. O petróleo bruto, composto por diversos hidrocarbonetos alifáticos e aromáticos, resinas, hopanos, moléculas polares e PAHs, escapa regularmente para o ambiente a partir de reservatórios subterrâneos. Como os hidrocarbonetos de petróleo ocorrem naturalmente em todos os ambientes marinhos, houve oportunidade para vários microrganismos diversos evoluírem a capacidade de utilizar hidrocarbonetos como fontes de carbono e energia para o seu crescimento.
Assim, este projeto tem como objetivo explorar recursos microbianos do fundo do mar para o desenvolvimento de novos processos biotecnológicos baseados na capacidade destes microrganismos para a a biorremediação de ambientes poluídos.
Para isso, estirpes bacterianas foram isoladas de amostras de sedimentos recolhidas na Plataforma Continental Portuguesa (Arquipélago da Madeira) e na Crista Médio-Atlântica do Ártico e cultivadas em laboratório para testar a sua capacidade de degradar hidrocarbonetos de petróleo (HC). Nesse processo, as amostras foram incubadas por 15 dias, em triplicado, em frascos de 100 mL com 10 mL de meio Bushnell - Haas (BH) suplementado com NaCl (2%) e 50 µL de petróleo. A densidade de microrganismos degradadores de HC foi analisada no início e no final da experiência, utilizando o método do Número Mais Provável (MPN). Para isso, as amostras foram incubadas em placa de 96 poços por 15 dias à temperatura ambiente, na presença de petróleo e meio BH. Além disso, no final da experiência, diferentes meios de cultura (M1, Marine Agar, Bushnell-Haas, SYP-SW) foram utilizados para isolar estirpes bacterianas. As estirpes isoladas foram identificadas por técnicas de sequenciamento após a extração e amplificação do DNA. A identificação e caracterização das comunidades microbianas no início e no final das experiências de enriquecimento com petróleo, foi realizada por sequenciação de amplificação do gene 16S rRNA na
6 plataforma Illumina MiSeq. Os resultados mostraram uma redução drástica na riqueza e diversidade microbiana após o enriquecimento com petróleo, que foi acompanhado por um aumento na abundância de microrganismos capazes de degradar hidrocarbonetos. Este trabalho permitiu ainda o isolamento de 93 estirpes bacterianas que foram criopreservadas para futura aplicação biotecnológica em contexto de biorremediação.
Palavras-chave: Biorremediação, derrames de petróleo, ecossistemas de mar
7
Abstract
Petroleum hydrocarbons in crude oils, such as those released in the pass into marine ecosystems, for example, by the Exxon Valdez, BP Deepwater Horizon, and Prestige spills, are natural products derived from aquatic algae laid down between 180 and 85 million years ago. Crude oils, composed mostly of diverse aliphatic and aromatic hydrocarbons, resins, hopanes, polar molecules and PAH’s regularly escape into the environment from underground reservoirs. Because petroleum hydrocarbons occur naturally in all marine environments, there has been time for numerous diverse microorganisms to evolve the capability of utilizing hydrocarbons as sources of carbon and energy for growth. Thus, this project aims to exploit deep sea microbial resources for developing novel processes based on microbial biotechnology that can address bioremediation of polluted environments.
To do so, bacterial strains were isolated from sediment samples collected in the Portuguese Continental Platform (Madeira Archipelago) and in the Arctic Mid-Ocean Ridge and cultivated in the laboratory to test their ability to degrade petroleum hydrocarbons (HC). In this process, samples were incubated for 15
days, in triplicate, in 100 mL flasks with 10 mL Bushnell – Haas broth (BH)
medium supplemented with NaCl (2%) and 50µL of crude oil. The density of HC degrading microorganisms was accessed at the beginning and at the end of the experiment, using the Most Probable Number (MPN) method. For that, samples were incubated in 96 well-plate for 15 days at room temperature in the presence of crude oil and BH medium. In addition, at the end of the experiment, different culture media (M1, Marine Agar, Bushnell-Haas, SYP-SW) were used to isolate bacterial strains. Isolated strains were identified by sequencing techniques after DNA extraction and amplification. Identification and characterization of microbial communities at the beginning and end of the petroleum enrichment experiments was performed by using 16S rRNA amplicon sequencing on an illumine MiSeq platform. Results showed a drastic decrease in richness and diversity after the enrichment with crude oil, which was accompanied by an increase in abundance of microorganisms capable of degrading hydrocarbons. This work also allowed
8 the isolation of 93 bacterial strains that were cryopreserved for future biotechnological application in bioremediation context.
Keywords: Bioremediation, oil spills, deep sea ecosystems, oil degrading
bacteria, deep sea microorganisms.
9
INDEX
1. Introduction --- 13
1.1 Marine Ecosystems Pollution --- 20
1.2 Bioremediation as a sustainable solution --- 20
1.2.1 Principles of Bioremediation --- 21
1.2.2 Nowadays pollution recovery techniques - 21
1.2.3 Oil degrading microorganisms --- 24
1.2.4 Bioremediation advantages --- 27
1.3 Objectives --- 29
2. Material and Methods --- 30
2.1 Petroleum enrichment and microcosms ---31
2.1.1 Sample incubation with oil --- 31
2.1.2 Isolation of microbial strains ---36
2.1.3 Sterivex collection and NGS analysis ---- 38
2.1.4 Phylogenetic analysis of the bacteria strains
-- 41
3. Results --- 44
3.1 Initial/Final sample community --- 45
3.1.1 NGS analyses --- 45
3.1.2 Phylogenetic analyses --- 47
3.2 Bacterial Strains Identification --- 50
3.3 Abundance of hydrocarbons degraders by the Most
Probable Number method --- 54
3.4 Multidimensional analysis of taxonomic profiles -- 55
10
4.1 Discussion --- 58
4.2 Conclusion --- 62
4.3 Further steps --- 63
11
Abbreviations
16S - rRNA 16S ribosomal ribonucleic acid BA – Bioaugmentation
BLAST – Basic Local Alignment Searching Tool BH - Bushnell-Hass
BS - Biostimulation
C/N/P - Ratio of carbon, nitrogen and phosphorous CO2 - Carbon dioxide
DNA - Deoxyribonucleic acid DWH - Deepwater Horizon HC - Hydrocarbon
i - Initial samples (before the oil-enrichments) f - Final samples (after the oil-enrichments) INT - Iodonitrotetrazolium Violet
MDS - Multidimensional scalling MPN - Most probable number NaCl - Sodium chloride
NGS - Next-generation sequencing OTU - Operational Taxonomic Unit PAH - Polycyclic aromatic compound PCR - Polimerase chain reaction KO - KEGG ortholog
T0 - Time zero
12
13
1.1 Marine Ecosystems Pollution
Nowadays human activities are responsible for a major decline of the world's biological diversity, and the problem is so critical that combined human impacts could have accelerated present extinction rates to 1000–10,000 times the natural rate. In the oceans, the threat to marine life comes in various forms, such as
overexploitation and harvesting, dumping of waste, pollution
(plastics/microplastics/oil spills), alien species, land reclamation, dredging and global climate change (Derraik 2002).
One of the most concerning ones is oil spills pollution. Sea and ground water contamination by oil spill is a big environmental issue to which most countries face with. It all began between the decades of 1960/1970 when the first supertankers came into service. It was then that the world witnessed its first major oil spills that occurred in 1967, when the tanker Torrey Canyon, which was carrying 119,000 tonnes of crude oil, hit rocks and was wrecked near the Isles of Scilly off southwest England. The oil formed a slick measuring some 1000 square kilometres and caused massive pollution of coastlines around Cornwall, Guernsey in the Channel Islands and France. Since then some other major incidents have happened in the last decades, being “Deepwater Horizon” the most tragic one in oil spill’s history (Figure 1).
14 This kind of oil tanker disasters account for around 10 per cent of global marine oil pollution. Around 35 per cent comes from regular shipping operations; this includes oil released during incidents involving all other types of vessel, as well as oil from illegal tank cleaning. The largest share, amounting to 45 per cent, comes from inputs from municipal and industrial effluents and from routine oil rig operations, together with a small amount from volatile oil constituents which are emitted into the atmosphere during various types of onshore burning processes and then enter the water. A further 5 per cent comes from undefined sources. This includes smaller inputs into the sea by polluters who go undetected (WOR3, 2014).
The consequences of oil spills, which can occur either because of deliberate operational discharges or because of accidental spills, are extremely serious for marine landscape, ocean's inhabitants, and human health. After numerous oil pollution incidents, we now have very detailed information available about the effects of oil on flora and fauna. The most obvious effect is the damage caused to seabirds’ plumage. Because of oil contamination, the plumage can no longer perform its vital functions of repelling water and providing thermal insulation. As a result, the bird loses body heat and dies. A similar effect can be observed in marine mammals, such as otters, which can die of cold if their fur is coated with oil. Furthermore, birds and mammals often ingest oil when they attempt to clean their oil-coated feathers or fur, and this can poison them. Fish absorb toxic hydrocarbons through their skin and gills. In plants, oil contamination interrupts gas exchange through the leaves and nutrient transfer by the roots, which causes the plant to die. Filter feeders such as mussels and other organisms often ingest oil along with their food. The toxic hydrocarbons in the oil and the clogging up of their internal filtration systems generally kill them very quickly. If the mussels survive, the toxins can be passed along the food chain when the contaminated mussels are eaten. The effects of the toxic hydrocarbons vary from species to species. Experiments with crab or mussels show that it is mainly their metabolic processes and growth which are impaired. In other organisms, reproduction is adversely affected. Poisoning by oil can cause genetic damage: in herring, for example, numerous freshly hatched progeny was malformed. Furthermore, many marine fauna lose their sense of direction, as many of them use very fine
15 concentrations of certain substances in the water as a means of finding their way around their environment. This is disrupted by certain hydrocarbons, making it more difficult them to forage or identify partners for reproduction. For example, the destruction and degradation of food chains and water quality, sediment accumulation, sun light block and even fisheries and tourism affection. The caused damage is unpredictable and does not depend on the size of the oil spill, but it depends rather on the vulnerability of the area (Piperopoulos, Calabrese et al. 2018). Plus, it’s difficult to predict how long the oil will remain on the sea due to the complex mixture that it represents.
Crude oil is perhaps the most complex mixture of organic compounds that occurs on Earth. Recent advances in ultra-high-resolution mass spectrometry have allowed the identification of more than 17,000 distinct chemical components, and the term petroleomics has been coined to express this newly uncovered complexity. Furthermore, crude oil is not a homogeneous material, and different crude oils have a range of chemical and physical properties that affect their susceptibility to biodegradation and their environmental fate. Within this complexity, however, crude oil can be classified into four main operationally defined groups of chemicals: the saturated hydrocarbons and the aromatic hydrocarbons; and the more polar non-hydrocarbon components; the resins; and the asphaltenes. Light oils are typically high in saturated and aromatic hydrocarbons, with a smaller proportion of resins and asphaltenes. Heavy oils, which result from the biodegradation of crude oil under anoxic conditions in situ in petroleum reservoirs, have a much lower content of saturated and aromatic hydrocarbons and a higher proportion of the more polar chemicals, the resins and asphaltenes. Biodegradation of crude oil in surface environments results in similar changes in crude oil composition, and the loss of saturated and aromatic hydrocarbons, together with an increase in the relative abundance of the polar fractions (which are more resistant to biodegradation), is a characteristic signature of crude-oil biodegradation. Because saturated hydrocarbons constitute the largest fraction of crude oil by mass, the biodegradation of saturated hydrocarbons is quantitatively the most important process in the removal of crude oil from the environment. Nevertheless, the aromatic
16 hydrocarbons and polar fractions, which are more toxic and persistent, could be of greater long-term environmental significance (Head, Jones et al. 2006)
The quantitatively largest aquatic form of accidental pollution caused by the maritime sector is also the one that has been highlighted the most: oil spills. As crude oil consists of a wide range of different hydrocarbon molecules with different molecular weight and properties, it is not easy to give a concise view of the total damage that is done by an accidental spill. Apart from the highly visible heavy oil that covers the water, the animals and the shores, a large number of lighter components are present as well. These lighter components are likely to do even more damage in the long run, as they are stored in the adipose tissue of different animals in the food chain. Examples of these lighter components comprise the monocyclic and polycyclic aromatic hydrocarbons, which are difficult to clean up, and bound to cause cancer and other health problems after a few years of continuous exposure (Clark, Frid et al. 1989).
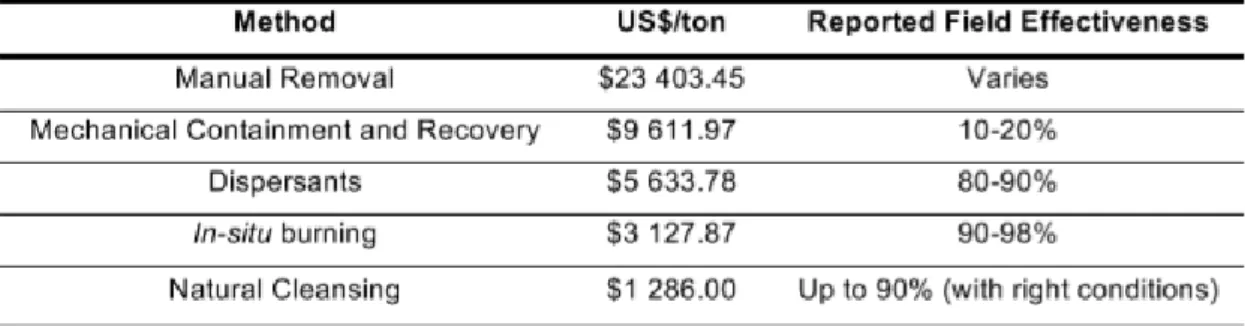
Despite the incidents, the number of oil spills have decreased in the last decades due to some legislation outcome. For example, the International Convention for the Prevention of Pollution from Ships (MARPOL 73/78), in which, since 1983, oil companies had to readjust the ships’ compositions to better materials for their isolation and safety. Some of the trade routes have also been blocked and interrupted to prevent future disasters. Some other agreements have been maid more recently like the Oil Pollution Act (OPA) in 1990 and the International Safety Management Code (ISM) in 1994. Although measures have been taken, seaborne oil trade has increased and it’s still one of the most “money-maker” markets nowadays (Table 1).
17 Major incidents often result in the formation of massive oil slicks, extending for hundreds of kilometres. In these situations, it is impossible to protect the entire coastline. The response must therefore focus on the most important and sensitive stretches of shoreline. Protecting nature reserves or habitats for rare fauna and flora is regarded as a priority, and economically important zones, such as aquaculture facilities, should also take precedence. Sensitivity maps now exist for many regions of the world. They provide detailed information about the oil pollution sensitivity of various stretches of coastline and identify the species of flora and fauna occurring there. Key factors are species’ rarity, the level of risk posed to them by oil pollution, and how likely it is that species would die out locally in the event of an oil pollution incident. Often, it is not the seabirds or marine mammals which are most at risk, but rare species of plant or insect. All this information is also used to prepare contingency plans. Response teams are now supported by computer programs which provide access to databases containing sensitivity data. This information can be linked with up-to-date meteorological data to calculate the route of the oil slick and the extent to which important areas will be affected. In this way, response teams can direct oil spill response vessels to areas in need of protection or ensure that booms are set up to defend them.
18 As regards the ongoing but less visible oil pollution of the marine environment by ships, the situation has improved in various regions of the world. Again, the MARPOL Convention has contributed here. MARPOL defines seven of the world’s sea areas as “special areas” which are provided with a higher level of protection than other areas of the sea. Only tankers which comply with specific safety standards are permitted to transit these sea areas; these include limits on the size of tanks on oil tankers in order to minimize the amount of oil that could escape in the event of an incident causing damage to the hull. The special areas are:
• the Antarctic Area (since 1992);
• the “Gulfs” area (since 2008);
• the Mediterranean Sea (since 1983);
• the North West European Waters/North Sea (since 1999);
• the Baltic Sea (since 1983);
• the Black Sea (since 1983);
• the Southern South African Waters (since 2008).
According to environmentalists and the WOR3 2014, there is a special threat to the Arctic waters, due to the Arctic nations’ plans to carry out oil drilling here in future. Russia and the US have ambitions to develop the oil and gas reserves in their northern regions. But developing these reserves is likely to pose major challenges. Drift ice could destroy drilling and production rigs, and tankers could be wrecked in the ice. When Shell Oil Company began test drilling in Alaska in 2012, for the first time in 20 years, it faced massive protests from environmental groups. They warned about the risks posed by drilling in sea ice, the possibility of tanker incidents, and the likely impacts of an oil disaster.
Much of the Arctic is still a natural habitat with unique and largely untouched
ecosystems, which could be massively damaged by oil – not least because an
effective oil spill response is almost impossible to mount in an icy environment, and because the oil would biodegrade very slowly in the region’s very cold
19 temperatures. And indeed, the drilling programme was beset by problems. Equipment was damaged by the ice, and a drilling rig, Kulluk, ran aground. After the project came under severe criticism in an official report in the US, Shell cancelled its 2013 drilling programme. Among other things, the report drew attention to the inadequate safety standards for Arctic drilling. In spring 2013, Shell signed a memorandum on cooperation with the Russian energy company
Gazprom, focusing on hydrocarbon exploration and development on Russia’s
Arctic shelf. Critics fear that safety standards will be even lower here and are warning about the risk of a major oil disaster. It is difficult to predict the future of oil exploration and development in the Arctic regions of the US, where industry and environmental organizations are currently at loggerheads over the level of protection that should be afforded to the Arctic. Industry associations warn that excessively stringent safety regulations will make the development of an oil industry economically non-viable, whereas environmental groups are calling for a total ban on oil production in the Arctic. Experts take the view that oil companies in the US will continue to have their sights firmly fixed on the Arctic’s oil reserves, and that US companies will step up their efforts to exploit these resources as soon as other countries, but particularly Russia, discover major oil reserves in their exclusive economic zones.
1.2 Bioremediation as a sustainable solution
1.2.1 Principles of Bioremediation
Environmental biotechnology is not a new field; composting and wastewater treatments are familiar examples of old environmental biotechnologies. However, recent studies in molecular biology and ecology offer opportunities for more efficient biological processes. Notable accomplishments of these studies include the clean-up of polluted water and land areas.
Bioremediation is defined as the process whereby organic wastes are biologically degraded under controlled conditions to an innocuous state, or to levels below concentration limits established by regulatory authorities (Vidali 2001). Bioremediation is the use of living organisms, primarily microorganisms, to degrade the environmental contaminants into less toxic forms. It uses naturally
20 occurring bacteria and fungi or plants to degrade or detoxify substances hazardous to human health and/or the environment. The microorganisms may be indigenous to a contaminated area or they may be isolated from elsewhere and brought to the contaminated site. Contaminant compounds are transformed by living organisms through reactions that take place as a part of their metabolic processes. Biodegradation of a compound is often a result of the actions of multiple organisms. When microorganisms are imported to a contaminated site to enhance degradation, we have a process known as bioaugmentation. For bioremediation to be effective, microorganisms must enzymatically attack the pollutants and convert them to harmless products. As bioremediation can be effective only where environmental conditions permit microbial growth and activity, its application often involves the manipulation of environmental parameters to allow microbial growth and degradation to proceed at a faster rate (Vidali 2001).
1.2.2 Nowadays pollution recovery techniques
In recent years, as the increasingly maritime shipping, the leakage of crude oil and organic solvents has led to the global catastrophe, which attracts great attention from the whole world. The development of recycling these organic pollutants will help to avoid these economic losses and the environmental tragedy. The conventional oil/water separation methods include gravity separation, floatation, filtration, centrifugation, and electrochemical methods. However, most of them have some drawbacks, such as low separation efficiency and cumbersome operation (Cao, Luo et al. 2018).
21 The effectiveness of a response to mitigate an oil spill depends on the oil type, location and the spill size. However, the costs associated with the clean-up response can also influence the type of technology used (Etkin, 2000). Current remediation techniques involve mechanical removal (skimming, removal of oil and in situ burn) as well as, chemical and biological approaches (Mapelli et al., 2017). Based on estimations of historical oil spills, natural mitigation, incineration and use of dispersants are three of the most cost-effective options with higher reported field effectiveness (Table 2).
Also, oil spill remediation can occur chemically (i) using dispersants to break up the oil and speeding its natural biodegradation: dispersants help to break the oil into smaller droplets which can increase its solubility in water and also its bioavailability by increasing the surface area of contact between microorganisms and HC (Kleindienst et al., 2015; Salerno et al., 2018). Nevertheless, high concentrations of surfactants can result in aggregation of the oil-droplets and can also inhibit the growth of microorganisms.
(ii) introducing biological agents to hasten the spill biodegradation,
(iii) using adsorbent materials. Among them the use of adsorbent, such as pads, mats, and socks, is the most popular choice, due to its simplicity and its efficiency. It allows the removal of oil contaminants in the case of spills in limited areas while in the case of higher extensions can be used as containment barriers (Piperopoulos, Calabrese et al. 2018).
Inside the mechanical techniques there are two with more prevalence of usage which are: skimming and incineration. The first one, as the name says, the goal is to skim the oil layer from the surface by boats and boomers, application of
Table 2 - Marine Non-US Oil Spill Clean-up cost per ton associated with reported effectiveness of clean-up technologies based on estimations from historical oil spills. Adapted from (Etkin, 2000)
22 natural or synthetic sorbent materials and to dislocate the oil from the
contaminated site elsewhere (Mapelli et al., 2017). Although effective, it’s not
applied much, since it requires risky transportation of the oil and also it requires the closing of ports and the access of humans and boats.
Incineration may be another approach implemented to help control the diffusion of an oil spill. However, besides removing only the low weigh HC, it is an extremely polluting technique releasing massive amounts of volatile compounds, like CO2 and PAHs, thus contributing to the increase of atmospheric contamination (Mapelli et al., 2017). Despite the disadvantages, in-situ oil burning is still one of the most used methods in oil spills. For example, in the Deepwater Horizon disaster, the amount of oil burned was superior to the amount of oil collected (Kerr, 2010).
A new and more recent and effective way to clean up the oil spills can be the use of Biosurfactants. Biosurfactants may become a viable alternative as a green-remediation methodology since they are produced by some bacterial strains in the presence of oil (Mapelli et al., 2017). In comparison to chemical surfactants, biosurfactants can act in environments with extreme conditions of salinity, pH and temperature, have a higher rate of biodegradability and they also present higher selectivity.
23
1.2.3 Oil degrading microorganisms
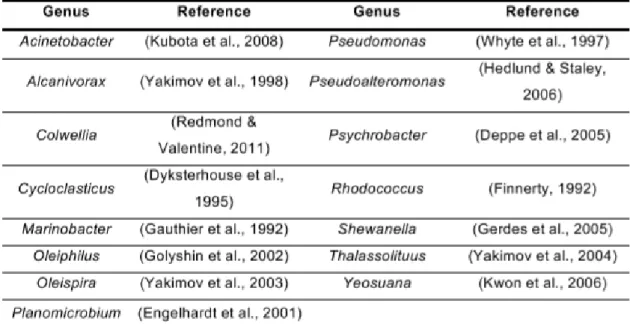
Hydrocarbon-degrading bacteria were first isolated almost a century ago and a recent review lists 79 bacterial genera that can use hydrocarbons as a sole source of carbon and energy (Acinetobacter, Alcanivorax, Cycloclasticus, Oleiphilus, Oleispira, Pseudomonas and Thalassolituus, all belonging to the Proteobacteria phylum, and Rhodococcus, from the Actinobacteria phylum), as well as 9 cyanobacterial genera, 103 fungal genera and 14 algal genera that are known to degrade or transform hydrocarbons (Head, Jones et al. 2006) (Table 3).
Petroleum degrading microorganisms can be classified into obligate hydrocarbonoclastic bacteria (OHCB), that can grow on a narrow range of HCs and HCs degradation products, and generalists, that can grow on a wider set of carbon sources (Mapelli et al., 2017). Several hydrocarbon degrading bacteria have been used as model organisms to elucidate the biochemistry, genetic basis and regulation of hydrocarbon-degrading pathways, and it has been known for some time that hydrocarbon degradation in the environment is typically limited by the bioavailability of nutrients such as nitrogen and phosphorus. In
organic-compound-rich environments associated with long-term hydrocarbon
contamination, the bioavailability of the hydrocarbons themselves is also an
24 important limiting factor in biodegradation, and even in situations in which biodegradation of surface oil contamination occurs, buried oil can persist on beaches as a result of limitations on mass transport of hydrocarbons, nutrients or oxygen (Head, Jones et al. 2006).
Microorganisms produce a large variety of surface-active materials, or surfactants for short. Bioemulsifiers are often produced by bacteria capable of growing on hydrocarbons and have been shown to stimulate the growth of these bacteria and to accelerate bioremediation.
Petroleum bioremediation is carried out by microorganisms capable of utilizing hydrocarbons as a source of energy and carbon. These microorganisms are
ubiquitous in nature and can degrade various types of hydrocarbons —
short-chain, long-chain and numerous aromatic compounds, including polycyclic aromatic hydrocarbons. All these compounds have low solubility in water. This fact, coupled to the fact that the first step in hydrocarbon degradation involves a membrane-bound oxygenase, makes it essential for bacteria to come in direct contact with the hydrocarbon substrates. One biological strategy that can enhance contact between bacteria and water-insoluble hydrocarbons is emulsification of the hydrocarbon. Therefore, it is not surprising that bacteria growing on petroleum usually produce potent emulsifiers. These surfactants help to disperse the oil, increase the surface area for growth, and help detach the bacteria from the oil droplets after the utilizable hydrocarbon has been depleted (Ron and Rosenberg 2002).
As mentioned before oil is a naturally occurring mix of hydrocarbons which is broken down by bacteria in a biological process. These bacteria are particularly active under the following conditions:
- high temperatures, promoting bacterial activity;
- a large surface area (if necessary, the surface area of the slick can be increased using dispersants which promote the formation of dispersions); - a good oxygen supply;
- a good supply of other key nutrients;
- a low number of predator organisms which would reduce the number of bacteria.
25 As the breakdown of oil by bacteria is much slower at lower water temperatures, oil disasters in cold-water areas are particularly devastating. For example, oil residues from the Exxon Valdez tanker disaster are still present in the shoreline strata of Prince William Sound, where they can be found at many different sites. In some cases, the oil has penetrated several centimetres below the surface. How long does it take for an oiled coastline to re- cover?
This depends on the type of shoreline. Exposed rocky and sandy shores with strong surf and wave action generally recover within a few months or, more rarely, within a few years. Sandy beaches are affected to varying degrees. Coarse-grained sand facilitates oil penetration, slowing the breakdown of the oil. Again, beaches with heavy surf generally recover more quickly than extensive beaches with little wave action.
26
1.2.4 Bioremediation Advantages
Bioremediation is an option that offers the possibility to destroy or render harmless various contaminants using natural biological activity. As such, it uses relatively low-cost, low-technology techniques, which generally have a high public acceptance and can often be carried out on site. It will not always be suitable, however, as the range of contaminants on which it is effective is limited, the time scales involved are relatively long, and the residual contaminant levels achievable may not always be appropriate. Although the methodologies employed are not technically complex, considerable experience and expertise may be required to design and implement a successful bioremediation program, due to the need to thoroughly assess a site for suitability and to optimize conditions to achieve a satisfactory result. Because bioremediation seems to be a good alternative to conventional clean-up technologies research in this field, especially in the United States, rapidly increasing. Bioremediation has been used at a number of sites worldwide, including Europe, with varying degrees of success. Techniques are improving as greater knowledge and experience are gained, and there is no doubt that bioremediation has great potential for dealing with certain types of site contamination. Unfortunately, the principles, techniques, advantages, and disadvantages of bioremediation are not widely known or understood, especially among those who will have to deal directly with bioremediation proposals, such as site owners and regulators (Vidali 2001). Like other technologies, bioremediation has its limitations. Some contaminants, such as chlorinated organic or high aromatic hydrocarbons, are resistant to microbial attack. They are degraded either slowly or not at all, hence it is not easy to predict the rates of clean-up for a bioremediation exercise; there are no rules to predict if a contaminant can be degraded. Bioremediation techniques are typically more economical than traditional methods such as incineration, and some pollutants can be treated on site, thus reducing exposure risks for clean-up personnel, or potentially wider exposure as a result of transportation accidents. Since bioremediation is based on natural attenuation the public considers it more acceptable than other technologies. Most bioremediation systems are run under aerobic conditions, but running a system under anaerobic conditions [8] may
27 permit microbial organisms to degrade otherwise recalcitrant molecules (Vidali 2001).
28
1.3 Objectives
Bearing in mind all the points above mentioned, the project aims to exploit deep-sea microbial resources for developing novel processes based on microbial biotechnology that can address bioremediation of polluted environments. Moreover, responders to future spills would do well to mobilize as rapidly as possible a scientific understanding of the unique conditions of worldwide spills, that is, to determine both natural and enhanced biodegradation and what the best possible approach will be to minimize the risk and impact of spills on the environment.
29
30
2 .1 Petroleum enrichment and microcosms
2.1.1 Sample incubation with oil
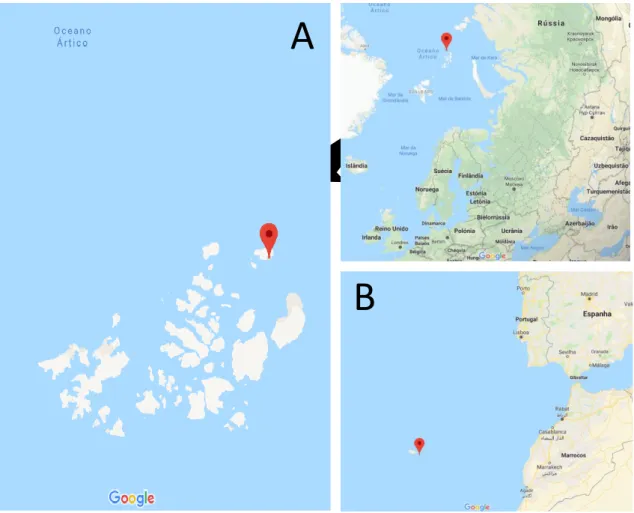
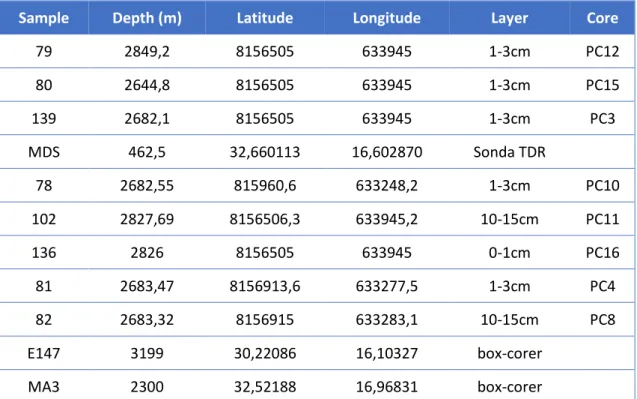
During this work different samples were used in microcosm laboratory experiments. More specifically, we worked on with samples previously collected from the Arctic Mid-Ocean Ridge (different cores and layers and with slight differences in the depths) and from the Portuguese Continental Platform, Madeira Archipelago (different cores and layers). In total 11 samples were analysed (Figure 2/Table 4).
A
B
Figure 2 – Sampling sites location. A – Arctic Mid-Ocean Ridge. B – Madeira Archipelago. Red dot points the specific coordinates of the sampling sites
31 Samples were maintained in Life Guard solution to keep them alive with all their needed life conditions and then sent to the laboratory. The different samples were then transferred to 50mL Falcon, agitated during 30 mins and vortexed 1 min. max. speed at 200 rpms.
Microcosms and HC (hydrocarbons) enrichment experiences were then address with the final goal of evaluating the potential of this microorganisms to degrade the HC’s. To simplify the process the work was divided in two parts (A and B).
Part A (Figure 3)
In this part a little quantity of each sample was used in microcosms triplicates (100 mL tubes with 10 mL of BH medium (+) 2% NaCl with 1 mL of sample). Seven drops of oil (50 µL) were added to every microcosm.
Sample Depth (m) Latitude Longitude Layer Core
79 2849,2 8156505 633945 1-3cm PC12 80 2644,8 8156505 633945 1-3cm PC15 139 2682,1 8156505 633945 1-3cm PC3 MDS 462,5 32,660113 16,602870 Sonda TDR 78 2682,55 815960,6 633248,2 1-3cm PC10 102 2827,69 8156506,3 633945,2 10-15cm PC11 136 2826 8156505 633945 0-1cm PC16 81 2683,47 8156913,6 633277,5 1-3cm PC4 82 2683,32 8156915 633283,1 10-15cm PC8 E147 3199 30,22086 16,10327 box-corer MA3 2300 32,52188 16,96831 box-corer
32
Fifteen days after incubation several dilutions (100 a 10-6) were prepared from
each microcosm in Eppendorfs (Figure 3.1). For the dilutions between 10-2 to 10
-6 four different broth media were selected (Bushnell-Hass, Marine Agar, M1) and
each dilution was spread in every media. Also, the triplicates of each sample were
33 collected in a 50mL Falcon and filtered through a Sterivex Filter for posterior DNA extraction.
Part B
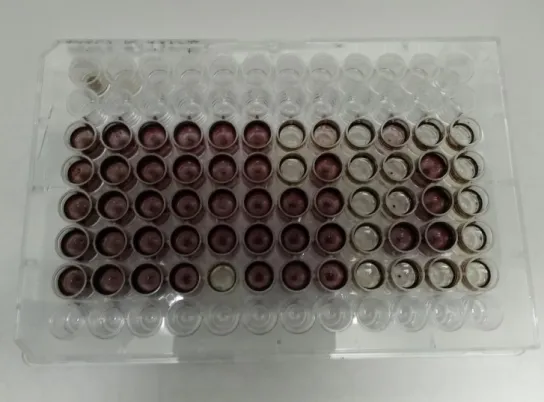
In this part MPN (Most Probable Number) method was applied. An adaptation of the MPN test (Wrenn et al., 1996) (Figure 4) is performed in 96 well-plates, with petroleum as the only carbon source added and BH (Bushnell Haas) as a culture medium. In the lines A and C to G, 180 µL of sterilized BH medium supplemented with NaCl (2 % v/v) was added, except for the A1 well, where 180 µL of the initial sample was put. Throughout the line A, tenfold dilutions were applied by pipetting 20 µL from the former well. The last well stayed only with BH medium, being used as control.
Next, 10 µL of petroleum, filtered by 0.2 µm sterile cellulose acetate membrane filter, was added to all the wells in the lines C to G. With a multichannel 200 µL pipette, 20 µL of the line A wells were pipetted to the lines C to G, obtaining for each dilution 5 replicates.
34 The plates were incubated for 15 days at room temperature (T0). At the end of the incubation period, wells from lines C to G were dyed with 50 µL of a 3 mg L-1 Iodonitrotetrazolium Violet (INT) solution, sterilized by filtration through 0.2 µm sterile cellulose acetate membrane filters. This dye turns purple when in the presence of HC degradation products and a day after the coloration positive wells are counted and calculated in the MPN method calculator program. A second test was again addressed exactly in the same terms in the end of the first test, so 15 days later it’s possible to have a T15 to make a comparison term.
35
2.1.2 Isolation of microbial strains
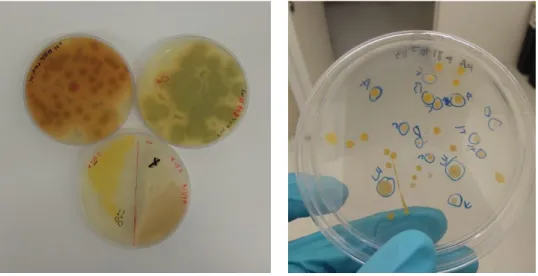
As mentioned above, for the dilutions between 10-2 to 10-6 four different broth
media were selected (Bushnell-Hass, Marine Agar, SW and M1) (Figure 5) and each dilution was spread in every media. The plates were then inoculated at 28 ºC, for about 3 days, until growth was achieved (Figure 6). Consecutive streaking method was applied to each plate to acquire pure colonies (following the presupposition that one colony was originated from one initial cell).
Once pure colonies have grown, samples were collected for DNA extraction. For that, one loop of each isolate’s colony was collected and re-suspended in 1 mL
Figure 4 – Part B experimental design (MPN test)
36 of sterile saline solution (85 % v/v) in 2 mL microtubes. Afterwards, the tubes were centrifuge for 5 min at 7 G, the supernatant being discard and the pellet store at -20 ºC, for further DNA extraction and species identification.
All material and mediums used were sterilized, by autoclaving at 121 ºC, and manipulations were carried out in a flow-chamber with an initial 20 min UV decontamination cycle to ensure sterile conditions and avoid microbial contaminations
37
2.1.3 Sterivex collection and NGS analysis
After two weeks of incubation (T15), the composite sample of the microcosms was also filtered through Sterivex™ filters with a pore size of 0.22 μm, hydrophilic, PVDF, Durapore membrane (SVGV1010RS, Merck Milipore, Portugal) with the help of 50mL sterile syringes, a PowerVac™ Manifold (Qiagen) and a vacuum pump, following the methodologies used in the Ocean Sampling Day event (Kopf et al., 2015). Due to the thick consistency of crude oil, the maximum volume
possible was filtered, in a two-hour time frame or until the Sterivex™ units
clogged. Sterivex™ was capped with the Inlet and Outlet caps, placed in sterile bags properly identified and stored in a -80ºC freezer.
After completing the oil enrichment experiments for all samples, Sterivex™ filters were defrosted at room temperature. Then, the DNA was extracted using the DNeasy® PowerWater® Sterivex Kit (QIAGEN, Inc). In addition, DNA was also extracted from the 11 original sediments by using the DNeasy® PowerSoil® Kit (QIAGEN, Inc). Isolated DNA was then quantified fluorometrically using the Qubit dsDNA HS Assay (ThermoFisher Scientific, Waltham, USA). The amplification of the V4-V5 region of the genetic marker 16S rRNA gene was performed by using the primer pair 515F (5′-GTGYCAGCMGCCGCGGTAA-3′) and 926R (5’CCGYCAATTYMTTTRAGTTT-3’), according with Earth Microbiome Project protocols (Gilbert et al., 2014).
Sequencing of 16S rRNA gene amplicons was performed in Biocant –
Biotechnology Park (Cantanhede, Portugal). Two Polymerase Chain Reaction (PCR) rounds were performed to amplify first the DNA with the specific primers and reamplified afterwards to add sequencing adapters and dual indexes. The KAPA HiFi HotStart PCR kit was used to perform the PCR reactions, which included 0.3μm of each primer and 12.5ng of template DNA in a total volume of 25μm. Conditions of PCRs involved denaturation at 95ºC for 3 min followed by 25 cycles of 20s at 98ºC, 30s at 50ºC, 30s at 72ºC with a final extension for 5 min at 72ºC. The second round of PCR reactions were performed according to the manufacturer’s suggestions (Illumina, 2013). At Genoinseq (Cantanhede,
38 Portugal), the PCR products were one-step purified and normalized by using the SequalPrep 96-well plate kit (ThermoFisher Scientific, Waltham, USA) (Comeau
et al., 2017), pooled and pair-end sequenced, according to the manufacturer’s
instructions, in the Illumina MiSeq® sequencer with the V3 chemistry (Illumina, San Diego, CA, USA).
The microbial communities’ structure was assessed by using the SILVAngs 1.3 analysis pipeline (Quast et al., 2012). This automatic software pipeline provides a service to analyse data of amplicon reads of rRNA gene from massive parallel high-throughput NGS technologies. Thus, SILVAngs analysis pipeline is primarily targeting the analysis of large scale small- and large subunit (LSU/SSU) ribosomal RNA (rRNA) gene tag sequencing projects but can also be run on meta-genomes studies. Each project normally includes thousands to millions of reads from many different samples produced by massive parallel high throughput “next generation” sequencing (NGS) technologies. Each read is aligned, quality checked, and classified based on the SILVA Reference alignment and taxonomy. Intuitive graphical outputs are provided for statistical information about the taxonomical distribution of the reads within and across samples. Interactive tax breakdowns are available for detailed inspection of the diversity in the samples. Processing of the data is performed by five basic modules: align, quality control, dereplication, clustering, and classification. In the first step the alignment is used to verify that each read is indeed, depending on the project, an LSU or SSU rRNA gene sequence. Ambiguous reads and reads that are not of the required rRNA gene type, will be rejected based on the alignment score and the alignment identity. This module also checks the sequence quality of each read and it filters out low-quality reads based on ambiguous bases, or too many homopolymers. The number of aligned bases, within the boundaries of the rRNA genes, is determined and sequences below a user defined minimal length cut-off are rejected. After alignment and quality checks, the remaining sequences are dereplicated, clustered and classified. SILVAngs implements an approach similar to map and reduce. First all reads that are 100% identical (allowing overhangs) to another read are marked as replicate by the dereplication module. Next, the clustering module creates clusters of sequences with 98% sequence identity to each other (pairwise distance and single linkage clustering). The longest read in
39 each cluster is selected as its reference. Finally, the classification module classifies all reference sequences. Currently, BLAST in combination with the SILVA SSU or LSU Ref datasets are used to classify the sequences. The resulting classification of the reference sequence of a cluster is mapped to all members of the respective cluster as well as their replicates. Sequences having an average BLAST alignment coverage and alignment identity of less than 93% will be considered as unclassified and assigned to the virtual taxonomical group “No Relative”. All results can be downloaded as CSV and SVG files. Aligned sequence data can be downloaded in the FASTA and ARB file formats.
All sequence reads were processed by the NGS analysis pipeline of the SILVA rRNA gene database project (SILVAngs 1.3) (Quast et al., 2013). Each read was aligned using the SILVA Incremental Aligner (SINA SINA v1.2.10 for ARB SVN (revision 21008)) (Pruesse et al., 2012) against the SILVA SSU rRNA SEED and quality controlled (Quast et al., 2013). Reads shorter than 50 aligned nucleotides and reads with more than 2% of ambiguities, or 2% of homopolymers, respectively, were excluded from further processing. Putative contaminations and artefacts reads with a low alignment quality (50 alignment identity, 40 alignment score reported by SINA), were identified and excluded from downstream analysis. After these inital steps of quality control, identical reads were identified (dereplication), the unique reads were clustered (OTUs), on a per sample basis, and the reference read of each OTU was classified. Dereplication and clustering was done using cd-hit-est (version 3.1.2; http://www. bioinformatics.org/cd-hit) (Li and Godzik, 2006) running in accurate mode, ignoring overhangs, and applying identity criteria of 1.00 and 0.98, respectively. The classification was performed by a local nucleotide BLAST search against the non-redundant version of the SILVA SSU Ref dataset (release 132; http://www.arb-silva.de) using blastn (version 2.2.30+; http://blast.ncbi.nlm.nih.gov/Blast.cgi) with standard settings (Camacho et al., 2009). The classification of each OTU reference read was mapped onto all reads that were assigned to the respective OTU. This yields quantitative information (number of individual reads per taxonomic path), within the limitations of PCR and sequencing technique biases, as well as, multiple rRNA operons. Reads without any BLAST hits or reads with weak BLAST hits, where the function “(% sequence identity + % alignment coverage)/2” did not
40 exceed the value of 93, remain unclassified. These reads were assigned to the meta group “No Relative” in the SILVAngs fingerprint and Krona charts (Ondov et al., 2011). This method was first used in the publications of Klindworth et al. (2013) and Ionescu et al. (2012).
Genoinseq (Cantanhede, Portugal) provided three files in fastq format with the sequences of the 16S rRNA gene. The first file contains the raw sequences, generated by demultiplexing the forward and reverse raw reads extracted from illumina MiSeqÒ System, by removing sequence adapters with PRINSEQ 0.20.4 (Schmieder & Edwards, 2011). In the second file the sequences were quality-filtered to remove reads with less than 100 bases and trim bases with average quality lower than Q25 in a window of 5 bases with PRINSEQ 0.20.4, thus resulting in the fastq file with filtered reads. The third fastq file contained the forward and reverse sequences, that underwent through the processing above described, merged by overlapping paired end reads by using AdapterRemoval 2.1.5 (Schubert et al., 2016), with the default parameters.
2.1.4 Phylogenetic analysis of the bacteria strains
DNA collected after colonies isolation was extracted with the E.Z.N.A.® Bacterial DNA Kit (Omega, bio-tek). The quantification of the extracted DNA was evaluated by the kit Quant-it HsDNA and quantified in the Qubit fluorometer (Invitrogen). The quantification values were accessed by a comparison to the calibration curve, made of 2 standards solutions, S1 and S2, included in the kit. These solutions were made with 190 µL of the work solution, previously prepared and 10 µL of the standard solution, with a 2 min reaction period, and after that time, values were read in the Qubit fluorometer. The work solution was made in a 15 mL tube, with 199 µL of buffer and 1 µL of Qubit™ dsDNA HS reagent. For the extracted samples, 2 µL of each sample was mixed with 198 µL of the work solution in a 0.5 mL microtube, and left to rest, again, for 2 min before reading its value on the qubit fluorometer. No solution chemical compositions are provided by the kit manufacture. All this procedure was performed in a low light environment to prevent alterations in the reagents (photodegradation).
41 After the defrosting of the extracted samples, the amplification of the V1- V9 regions of the bacterial 16S rRNA gene, by the Polymerase Chain Reaction (PCR), with the universal primers 27F (5' AGAGTTTGATCMTGGCTCAG 3') and 1492R (5' TACGGYTACCTTGTTACGACTT 3') was proceeded.
An initial 2x QIAGEN Multiplex PCR Master mix was made, containing 5 µL of Qiagen and 1.5 µL of each universal primer.
Before the sequencing of the samples, a final volume of 10 µL of PCR samples was applied in the 0.5 mL PCR tubes. For that purpose, in each sample tube, 7µL of the QIAGEN Multiplex PCR Master mix was blended with 2 µL of the extracted DNA sample and 1 µL of DNA-free water. A control sample was also done, replacing the 2 µL of extracted DNA, by DNA-free water.
The samples were incubated in a 96-well thermal cycler, with the following program: an initial cycle of 15 min at 95 ºC, then 35 cycles at 94 ºC for 30 min, followed by 30 cycles 48 ºC for 1h 30min, 35 cycles at 72 ºC for 2 min and a final cycle of 10 min at 72 ºC.
An agarose gel was made dissolving 1.5 g of agarose in 100 mL of TAE (Tris-acetateEthylenediamine tetraacetic acid), and heated in the microwave for 4 min. Afterwards, 0.5 µl of SYBR® safe was added and the agarose solution was let settle in a cassette molder for 30 min.
Later the agarose gel was placed in a horizontal electrophoresis, where 3 µL of each sample, control and GRS Ladder 1 Kb was added to the wells. They were exposed to an electric flow of 150 V for 30min, and at the end the gel was observed, along with the DNA bands in the zone of 1500 bp. Next 7µL of the resulting PCR products were sent to the I3S institute for sequencing by sanger sequence.
42
2.1.5 Data Analysis
To evaluate the structure of the microbial communities, present in before and after oil enrichments, data were analysed in PRIMER 6 software (Gorley, 2006). For that, the data matrix was normalized using presence/absence pre-treatment function and samples were analyzed using Bray–Curtis similarity method, and then examined using a hierarchical cluster analysis. A multidimensional scaling (MDS) was obtained using default parameters with a minimum stress of 0.01 to generate a configuration plot based on percentage similarity.
43
44
3.1 Initial/Final sample community
3.1.1 NGS analyses
Identification and characterization of the microbial communities in the original 11 samples was performed by using 16S rRNA amplicon sequencing on an illumine MiSeq platform. Analysis of data from NGS was performed and processed using the software SILVAngs.
This assessment is important to have bulk notion of the composition of the microbial community present in the initial natural sample and after the experimental work.
An analysis of the alpha diversity was performed to understand the microbial diversity and structure by relating the number of OTUs with the number of sequences obtained by NGS analysis. Through rarefaction curves (Figure 7) it was possible to observe that the sequencing effort was not enough to capture the entire diversity present, in most natural samples, as the curves have not reached a plateau.
Rarefaction curves showed a clear decrease in the biodiversity of natural microbial communities after two-weeks of enrichment with crude oil, which was confirmed by the lower richness and Shannon diversity indexes (Figure 7). It must be noted that it was not possible to present results for all the samples, due to the low concentrations of DNA obtained from some of the samples. In fact, it was only possible to obtain valid results for 9 of the initial samples and 6 of the final samples.
45 0 200 400 600 800 1000 78 79 80 81 82 136 138 E147 MA3 MDS
Richness (OTUs)
Final InitialFigure 7 – Rarefaction curve of initial and final samples’ correlation between OTUs numbers and total number of sequences; Richness and Shannon diversity indexes
0 1 2 3 4 5 78 79 80 81 82 136 138 E147 MA3 MDS
Diversity H'
Final Initial46
3.1.2 Phylogenetic analyses
Taxonomic characterization is presented Figure 8, resulting from OTUs tables that were made in order to compare the microbial community genotypes presented in the samples. Regarding this, two different tables were prepared to compare both initial/final communities.
When comparing the microbial communities in the beginning and at end on the enrichment experiments, it was possible to observe that the initial ones all present abundance in the phyla Actinobacteria, Proteobacteria and Firmicutes, but final ones after enrichment lost great part of the Actinobacteria ones.
Well, in fact, the amount of bacteria diversity in the end is significantly lower than the initial one. Although, doesn’t mean necessarily that the number of bacteria with ability to degrade HC’s has diminished. Some species after the enrichment
disappear, but the ones with ability to degrade the HC’s increase a lot their
abundance. Such data are confirmed with the MPN results. Fact also is, all sample sites present bacteria strains that degrade hydrocarbons.
47 0% 10% 20% 30% 40% 50% 60% 70% 80% 90% 100%
Initial/final pairs (phylum)
Bacteria;Proteobacteria Bacteria;Firmicutes Archaea;Thaumarchaeota Bacteria;Bacteroidetes Bacteria;Actinobacteria Bacteria;Planctomycetes Bacteria;Acidobacteria Bacteria;Chloroflexi Bacteria;Gemmatimonadetes Bacteria;Verrucomicrobia Eukaryota;Opisthokonta No Relative
Bacteria;Dadabacteria Bacteria;Omnitrophicaeota Bacteria;Nitrospinae Bacteria;Nitrospirae Archaea;Nanoarchaeaeota
48 0% 10% 20% 30% 40% 50% 60% 70% 80% 90% 100%
Initial/final (genus)
Bacteria;Bacillus; Bacteria;Domibacillus; Bacteria;Paenisporosarcina; Bacteria;Marinobacter; Bacteria;Woeseia; Archaea; Nitrosopumilus; Bacteria; Cobetia; Bacteria;uncultured; Archaea;Nitrosopumilaceae;
Bacteria;NB1-j Bacteria;Alcanivorax; Bacteria;Pseudomonas;
Bacteria;uncultured; Bacteria;Joostella; Bacteria;Photobacterium; Bacteria;Moritella; Bacteria;uncultured; Bacteria;Idiomarina; Bacteria;Dietzia;
Figure 8 – Comparison between initial and final samples microorganism community (most common phylum and genus) before and after oil enrichment
49
3.2 Bacterial Strains Identification
Of a total of 93 bactrial strains were isolated, belonging to 3 main phyla: • 66.6% (Firmicutes), in which 100% belong to the Class Bacillli
• 23.7% (Proteobacteria), in which 72% belong to the Class Gammaproteobacteria and 28% belonged to the Class Alphaproteobacteria
• 5.4% (Actinobacteria)
According to the data obtained (Table 5), samples’ isolates are sub-divided by colour categories (samples 80; 79; 81; MDS; E147; MA3; 78; 102; 136 respectively). Phylum and Genus categories according to samples are presented
in Figure 9. Samples 82 and 139 are not presented in Table 5, because it was
not possible to isolate any strains due to technical (high contaminations or impossibility to growth in the media).
The most abundant Genus were Bacilus and Paenisporosarcina, although several and other diverse not so common Genus were detected, such as Dietzia and Sphingopyxis.
Sample
s Identification bp Phylum
80 Bacterium strain BS1670 16S ribosomal RNA gene, partial sequence 135
4 Firmicutes
80 Paenisporosarcina sp. ARK-14-voll partial 16S rRNA gene, isolate ARK-14-voll 142
6 Firmicutes
80 Bacillus sp. (in: Bacteria) strain RP-1-6 16S ribosomal RNA gene, partial sequence 142
0 Firmicutes
80 Bacillus sp. (in: Bacteria) strain RP-1-6 16S ribosomal RNA gene, partial sequence 142
0 Firmicutes
80 Bacillus sp. (in: Bacteria) strain CJKOP-135 16S ribosomal RNA gene, partial
sequence
125
4 Firmicutes
80 Sporosarcina sp. CL2.40 partial 16S rRNA gene, isolate CL2.40 131
1 Firmicutes
79 Bacillus simplex strain 266XG9 16S ribosomal RNA gene, partial sequence 141
8 Firmicutes
79 Paenisporosarcina sp. strain N15246 16S ribosomal RNA gene, partial sequence 142
5 Firmicutes
79 Marine bacterium IIIA010 16S ribosomal RNA gene, partial sequence 142
2 Firmicutes
79 Bacillus sp. BA(2014) 16S ribosomal RNA gene, partial sequence 142
2 Firmicutes
50
79 Paenisporosarcina sp. strain N15246 16S ribosomal RNA gene, partial sequence 142
5 Firmicutes
79 Bacillus simplex strain 262XG6 16S ribosomal RNA gene, partial sequence 141
8 Firmicutes
79 Paenisporosarcina sp. Sl65 gene for 16S ribosomal RNA, partial sequence 142
6 Firmicutes
79 Marine bacterium IIIA010 16S ribosomal RNA gene, partial sequence 141
7 Firmicutes
79 Bacillus simplex strain 266XG9 16S ribosomal RNA gene, partial sequence 141
6 Firmicutes
79 Bacillus simplex strain 266XG9 16S ribosomal RNA gene, partial sequence 1433 Firmicutes
79 Bacillus baekryungensis strain CW126-A01 16S ribosomal RNA gene, partial sequence 1424 Firmicutes
81 Paenisporosarcina sp. Sl65 gene for 16S ribosomal RNA, partial sequence 1425 Firmicutes
81 Bacillus sp. (in: Bacteria) MH10 gene for 16S ribosomal RNA, partial sequence 1423 Firmicutes
81 Uncultured bacterium clone AJ-P-Z-2 16S ribosomal RNA gene, partial sequence 1426
81 Bacillus sp. (in: Bacteria) strain CJKOP-135 16S ribosomal RNA gene, partial sequence 1422 Firmicutes
81 Paenisporosarcina sp. Sl65 gene for 16S ribosomal RNA, partial sequence 1422 Firmicutes
81 Bacillus baekryungensis strain CW126-A01 16S ribosomal RNA gene, partial sequence 1423 Firmicutes
81 Bacillus sp. K7SC-10 16S ribosomal RNA gene, partial sequence 1417 Firmicutes
81 Bacillus horikoshii strain TS9 16S ribosomal RNA gene, partial sequence 1416 Firmicutes
81 Marinobacter xestospongiae strain UST090418-1611 16S ribosomal RNA, partial sequence 1407 Firmicutes
81 Mesorhizobium sp. SLG310A2-20 16S ribosomal RNA gene, partial sequence 930 Proteobacteri a
81 Erythrobacter sp. strain C2O 16S ribosomal RNA gene, partial sequence 1357 Proteobacteri a
81 Vibrio sp. strain 201709CJKYOP-49 16S ribosomal RNA gene, partial sequence 1424 Proteobacteri a
81 Vibrio sp. VibC-Oc-085 16S ribosomal RNA gene, partial sequence 1285 Proteobacteri a
81 Bacillus sp. (in: Bacteria) strain 201707CJKOP-93 16S ribosomal RNA gene, partial sequence 1350 Firmicutes
81 Bacillus sp. K7SC-10 16S ribosomal RNA gene, partial sequence 1417 Firmicutes
81 Bacillus sp. YIM DKMY31-1 16S ribosomal RNA gene, partial sequence 1424 Firmicutes
81 Bacterium strain sp7 16S ribosomal RNA gene, partial sequence 1334 Firmicutes
81 Bacillus aquimaris strain 0179 16S ribosomal RNA gene, partial sequence 1424 Firmicutes
81 Bacillus sp. (in: Bacteria) strain 201707CJKOP-93 16S ribosomal RNA gene, partial sequence 1356 Firmicutes
81 Uncultured bacterium clone AJ-P-Z-2 16S ribosomal RNA gene, partial sequence 1426
81 Bacillus subterraneus strain HWG-A11 16S ribosomal RNA gene, partial sequence 1424 Firmicutes
81 Bacillus horikoshii strain TS9 16S ribosomal RNA gene, partial sequence 1413 Firmicutes
81 Bacillus sp. (in: Bacteria) MH10 gene for 16S ribosomal RNA, partial sequence 1427 Firmicutes
MDS Pseudomonas sp. strain LPB0260 16S ribosomal RNA gene, partial sequence 1396 Proteobacteri a
MDS Idiomarina sp. strain DT017 16S ribosomal RNA gene, partial sequence 1406 Proteobacteri a
MDS Erythrobacter sp. strain C2O 16S ribosomal RNA gene, partial sequence 1336 Proteobacteri a
MDS Lysobacter maris strain HZ9B chromosome, complete genome 1300 Proteobacteri a
MDS Lysobacter maris strain HZ9B chromosome, complete genome 1307 Proteobacteri a
MDS Sphingopyxis sp. strain QW20 16S ribosomal RNA gene, partial sequence 1211 Proteobacteri a
MDS Labrenzia sp. strain LSS-21 16S ribosomal RNA gene, partial sequence 1335 Proteobacteri a
MDS Erythrobacter sp. T-70 16S ribosomal RNA gene, partial sequence 1342 Proteobacteri a
MDS Microbulbifer taiwanensis strain CC-LN1-12 16S ribosomal RNA, partial sequence 1388 Proteobacteri a
MDS Idiomarina sp. H1-1 16S ribosomal RNA gene, partial sequence 1405 Proteobacteri a