THE USE OF CYCLIC TRIAXIAL TESTS IN THE CHARACTERIZATION OF PROTUGUESE UGM
ABSTRACT
Coarse aggregate is widely used in the unbound granular layers (UGM) of roads, in particular as granular sub-base and base. However, although various studies have been conducted on these materials, their mechanical behaviour still has not been properly characterized, in Portuguese conditions, especially due to reasons connected to the heterogeneity of the rock masses from which they come from. This has special importance for Portuguese pavement technology. In the attempt of contributing for a better knowledge of that behaviour, a work was developed having the aim of obtain the mechanical characterization and the establishment of behaviour models for crushed materials coming from different lithologies, namely limestone and granite, susceptible of being used as UGM. This paper describes the principal results obtained from the work and pointing out the main directives that can be extracted from it, in terms of the global behaviour of a road pavement.
USED MATERIALS
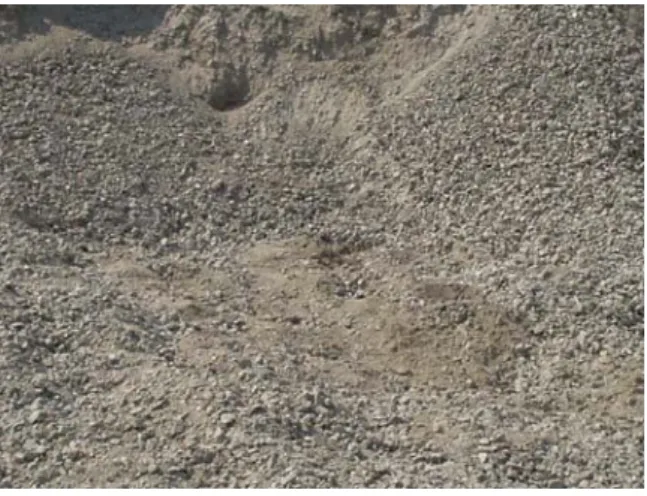
The materials used in these work were limestone and granite, Figure 1. They were characterized 5 samples of crushed limestone, from Pombal, centre of Portugal, and 3 samples of crushed granite, 2 of them outcrops near Celorico da Beira and the 3rd near Braga, interior centre and north of Portugal.
All the materials were used in granular subbase of pavements constructed in Portugal, namely in the motorway A23, fragment of Castelo-Branco Sul - Fratel, center of Portugal, where it has been used the limestone.
Hugo Silva Department of Civil Engineering University of Minho Portugal hugo@civil.uminho.pt
Luís Picado Santos Department of Civil Engineering University of Coimbra Portugal picsan@dec.uc.pt Rosa Luzia
Department of Civil Engineering Polytechnic Institute of Castelo
Branco Portugal rluzia@est.ipcb.pt
GEOTECHNICAL AND MECHANICAL BEHAVIOUR CHARACTERIZATION Geotechnical Characterization
On the collected samples a set of lab tests was per-formed in view to the evaluation of their characteristics in what concerns the granulometry distribution, hardness, resistance and water susceptibility.
a) b)
Figure 1. Used materials: a) limestone; b) granite
For that the following tests were performed: Los Angeles (LNEC E 237), the micro-Deval, Figure 2 (NP EN 1097-1), the sand equivalent (LNEC E 199) and the methylene blue (NF P 18-592), the California bearing ratio (CBR) (LNEC E 198) and compaction, which, due to the grading characteristics of the material, was executed by vibration, according to the BS 1377: part 4 standard (BSI, 1990), compacting specimens with the thickness varying between 127 mm and 133 mm in 3 layers for 60 seconds each.
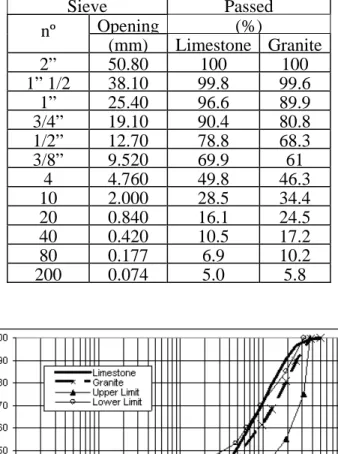
The results of the grading analysis are presented in Table 1 and Figure 3 (using the Portuguese road national administration specifications as reference) and the results of geotechnical characterization are presented in Table 2.
Mechanical Behaviour Characterization
The laboratory mechanical characterization of the materials was done by cyclic triaxial tests, according to AASHTO TP 46 standard (AASHTO, 1994). The test has 16 sequences, with variation of the stresses, where the first one, with 1000 cycles, corresponds to the confinement of the sample, and the other 15, with 100 cycles each, correspond to the resilient modulus.
Figure 2. Micro-Deval test equipment
Table 1. Results of the grading analysis
Sieve Passed Opening (%) nº (mm) Limestone Granite 2” 50.80 100 100 1” 1/2 38.10 99.8 99.6 1” 25.40 96.6 89.9 3/4” 19.10 90.4 80.8 1/2” 12.70 78.8 68.3 3/8” 9.520 69.9 61 4 4.760 49.8 46.3 10 2.000 28.5 34.4 20 0.840 16.1 24.5 40 0.420 10.5 17.2 80 0.177 6.9 10.2 200 0.074 5.0 5.8
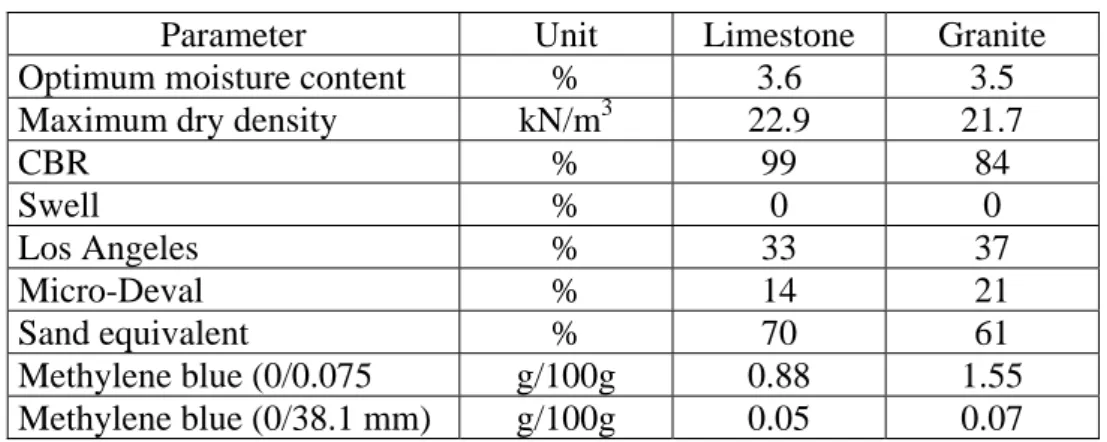
Table 2.. Results of the characterization tests
Parameter Unit Limestone Granite
Optimum moisture content % 3.6 3.5
Maximum dry density kN/m3 22.9 21.7
CBR % 99 84 Swell % 0 0 Los Angeles % 33 37 Micro-Deval % 14 21 Sand equivalent % 70 61 Methylene blue (0/0.075 g/100g 0.88 1.55 Methylene blue (0/38.1 mm) g/100g 0.05 0.07
The duration of each cycle is 1 second. The phase of load corresponds to 0.1 second and the phase of rest to 0.9 second.
From the test is obtained the resilient modulus, Mr in Equation 1, corresponding to each one of the 16 sequences. This value is the average found for the 5 last cycles of each
sequence. Mr =
ε
σ
r cyclic =ε
σ
σ
r 3 1− MPa (1) Where:σcyclic - resilient stress; εr - resilient axial strain σ1-σ3 - differential stress
The cyclic triaxial equipment, that exists in the Lab of Road Pavement Mechanics of the Department of Civil Engineering of the University of Coimbra, Figure 4, consists of a triaxial load frame of 100 kN of capacity, with a triaxial cell for 160mm x 300 mm specimens, 8 channels for control and data acquisition and a 25 kN load cell and compressor.
The compaction of the specimens, with 150 mm diameter and 300 mm high was executed with a vibrating hammer with the characteristics: frequency of percussion = 2750 impacts by minute, absorbed power = 750 W and diameter of compactor head = 147 mm.
The specimens tested were compacted for two conditions of compaction: the density and moisture content obtained in the lab conditions, that is, 95% of the maximum dry density and optimum moisture content, and the conditions of in situ compaction the material. Average values of these quantities are for limestone and laboratory conditions 21.7 kN/m3 and 3.6% and 22.7 kN/m3 and 3.5%, respectively. For the granite the average values are 21.1 kN/m3 and 4.3 % and 22.1 kN/m3 and 4.2 %, respectively for laboratory and in situ conditions.
Figure 4. Triaxial equipment of Lab of Road Pavement Mechanics of the Department of Civil Engineering of the University of Coimbra
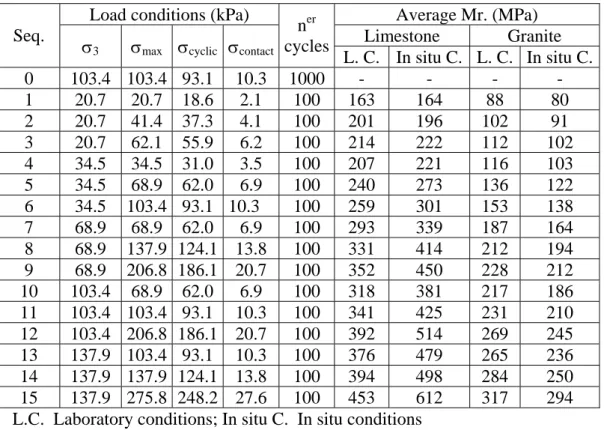
All the cyclic triaxial tests were performed using the conditions of load presented in Table 3. In the same table is presented the resilient modulus obtained for each material and in the aforementioned conditions.
The permanent deformation during the test, varied between 0.4 % and 1.4 % for limestone and between 1.2 % and 2.4 % to the granite
To the resilient modulus, we tried to adjust some behaviour models (Lekarp et al., 2000; NCHRP, 1998) generally used in granular materials mechanical behaviour modelisation, namely Dunlap (Mr = k1σ3k2), k-θ (Mr = k3θk4), differential stress (Mr = k5σdk6), Tom and Brown (Mr = k7(p/q)k8), Pezo (Mr = k9qk10σ3k11) and Uzan (Mr = k12θk13qk14). The results of this modeling are presented in Table 4.
After that, it was chosen the better and more conservative one, what means, the one having determination coefficient more closed to 1 and, on the other hand, the one which gives lower values of resilient modulus. The obtained is the model presented in Equation. 2.
Mr = 877,37q0,2384σ30,3828 (2)
where:
σ3 - confining stress q - differential stress
Table 3. Load conditions and resilient modulus obtained from cyclic triaxial tests Load conditions (kPa) Average Mr. (MPa)
Limestone Granite Seq. σ
3 σmax σcyclic σcontact ner cycles L. C. In situ C. L. C. In situ C. 0 103.4 103.4 93.1 10.3 1000 - - - - 1 20.7 20.7 18.6 2.1 100 163 164 88 80 2 20.7 41.4 37.3 4.1 100 201 196 102 91 3 20.7 62.1 55.9 6.2 100 214 222 112 102 4 34.5 34.5 31.0 3.5 100 207 221 116 103 5 34.5 68.9 62.0 6.9 100 240 273 136 122 6 34.5 103.4 93.1 10.3 100 259 301 153 138 7 68.9 68.9 62.0 6.9 100 293 339 187 164 8 68.9 137.9 124.1 13.8 100 331 414 212 194 9 68.9 206.8 186.1 20.7 100 352 450 228 212 10 103.4 68.9 62.0 6.9 100 318 381 217 186 11 103.4 103.4 93.1 10.3 100 341 425 231 210 12 103.4 206.8 186.1 20.7 100 392 514 269 245 13 137.9 103.4 93.1 10.3 100 376 479 265 236 14 137.9 137.9 124.1 13.8 100 394 498 284 250 15 137.9 275.8 248.2 27.6 100 453 612 317 294 L.C. Laboratory conditions; In situ C. In situ conditions
Table 4. Modelisation results of limestone and granite
Laboratory conditions r2 in situ conditions r2 Limestone Mr = 880.91σ30.3916 0.8914 Mr =1488.00σ30.5195 0.8898 Mr = 522.13θ0.4388 0.8914 Mr = 744.47θ0.5832 0.9857 Mr = 771.22σd0.3854 0.8347 Mr = 1256.10σd0.5140 0.8423 Mr = 288.82(p/q)0.0533 0.0041 Mr = 339.19(p/q)0.0634 0.0033 Mr = 583.98θ0.3672 q0.0821 0.9963 Mr = 883.67θ0.4647q0.1301 0.9981 Mr = 973.52q0.1930σ30.2543 0.9973 Mr = 1681.55q0.2696σ30.3215 0.9988 Granite Mr = 863.241σ30.5521 0.9401 Mr = 770.65σ30.5495 0.9213 Mr = 406.38θ0.6067 0.9981 Mr = 366.57θ0.6088 0.9945 Mr = 654.05σd0.5078 0.7691 Mr = 607.53σd0.5204 0.7995 Mr = 177.49(p/q)0.1718 0.0224 Mr = 160.33(p/q)0.1295 0.0126 Mr = 417.43θ0.5902 q0.0193 0.9982 Mr = 408.43θ0.5482q0.0753 0.9982 Mr = 945.90q0.1954σ30.4093 0.9986 Mr = 872.65q0.2388σ30.3798 0.9990
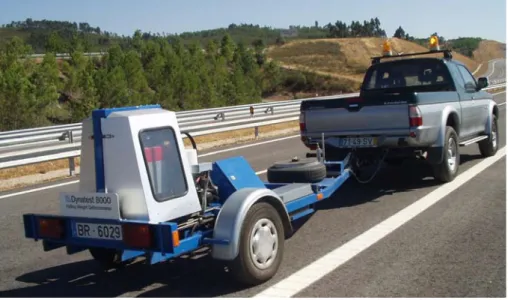
The in situ mechanical characterization was made with the Falling Weight Deflectometer of Coimbra and Minho Universities, Figure 5, and the deformability modulus obtained to the sub-base layer was, approximately, 570 MPa for the limestone and 250 MPa for the granite.
Figure 5. Falling Weight Deflectometer of Coimbra and Minho Universities
ANALYSIS OF MODELISATION RESULTS
On trying to confirm the values of resilient modulus obtained from cyclic triaxial tests, was done, in a typical Portuguese pavement, a small parametric study using Elsym5 and Bisar.
It consisted in the determination of the stresses to middle of the granular layer, considering for that the linear-elastic behaviour for materials and typical modules and Poisson coefficients, generally used in Portuguese pavement design practice, and then, calculate the module falling back upon the found model, Equation 2, with the obtained stresses.
The calculated values of resilient modulus, using that procedure, vary from 40 MPa to 60 MPa, so they are much more lower, 2.5 to 3 times, than the ones from which we departed. Because of that, the same procedure has been used with the results of FWD and the calculated values of resilient modulus were comparable.
The explanation for those values could be, for the cyclic triaxial tests, the confining stress used during the test, which is higher than the installed in an unbound granular layer and for the in situ characterization, a suction phenomenon that could happen in the unbound granular layers, caused by the variations in the moisture content after compaction, because of climacteric changes during summer time and some moisture reposition during winter period.
CONCLUSIONS
Analysing the characterization results of the two materials, we may conclude that they are not plastic, given the values of adsorption of the methylene blue obtained.
We also conclude that it is a material with good overall resistance regarding average CBR values, which range between 85 % and 99 %, as well as a good resistance to deterioration by abrasion and impact, taking into account the results of the Los Angeles and micro-Deval tests.
With respect to the mechanical behaviour, we found values of the resilient modulus variable between, approximately, 160 MPa and 600 MPa, to the limestone and between 80 MPa and 300 MPa to the granite.
We verified, on the other hand, that the permanent deformation during the test, varied between 0.4 % and 1.4 % for the limestone and 1.2 % and 2.4 % for the granite.
In terms of the resilient modulus modelling it was verified that the better simulation of the resilient behaviour of the two materials is obtained by Equation.2, which relates the modulus with the differential stress (q) and the confining stress (σ3).
The resilient modulus obtained from a parametric study using Elsym5 and Bisar, 40 a 60 MPa, is 2.5 to 3 times lower than the usually used in the design and generally obtained from tests, which are, probably, the real values of UGM resilient modulus, unless they are subject to suction phenomena.
ACKNOWLEDGMENTS
This research was developed with the support of the Program for the Educative Development in Portugal (PRODEP III), Measure 5 - Action 5.3 - Advanced Formation of Teachers of the Superior Education, through the scholarship given to the first author, which we are thankful for.
We also would like to thank to the Directorate Board of SCUTVIAS Auto-estradas da Beira Interior, for their help with data concerning the motorway A 23.
REFERENCES
AASHTO (1994). “Standard test method for determining the resilient modulus of soils and aggregate materials”. TP 46, American Association of State Highway and Transportation Officials, USA.
AFNOR (1990). “Granulats. Essai au Bleu de Méthylène. Méthode à la Tache”. NF P 18-592, Association Française de Normalisation, France
BSI (1990). “Soils for civil engineering purposes. Part 4: Compaction-related tests”. BS 1377: part 4, British standard institution, England.
IPQ (2002). “Ensaios das propriedades mecânicas dos agregados. Parte 1: Determinação da resistência ao desgaste (micro-Deval)”. NP EN 1097-1, 2ª ed., Instituto Português da Qualidade, Lisboa.
Lekarp, F.; Isacsson, U.; Dawson, A.(2000). “State of the art I: Resilient response of unbound aggregates”. Journal of Transportation Engeneering, American Society of Civil Engineers, Vol. 126, nº1, pp 66-75
LNEC (1967). “Solos. Determinação do CBR”. E 198, Laboratório Nacional de Engenharia Civil, Lisboa.
LNEC (1967). “Solos. Ensaio de Equivalente de Areia”. E 199, Laboratório Nacional de Engenharia Civil, Lisboa.
LNEC (1970). “Ensaio de Desgaste pela Máquina de Los Angeles”. E 237, Laboratório Nacional de Engenharia Civil, Lisboa.
NCHRP (1998). “Laboratory Determination of Resilient Modulus for Flexible Pavement Design”, Final Report, Web Doc 14, National Cooperative Highway Research Program, USA.