Reallocation of resources between the tradable and non-tradable
sector in Portugal:
Assessing the degree of structural transformation in the Portuguese economy
Filipa Canas (STD. No.: 13174)
A Project carried out as Field Directed Internship for the Strategy and Research Office of the Portuguese Ministry for the Economy, for the Award of a Masters Degree in Economics from the NOVA – School of Business and Economics, under the supervision of Susana Peralta and Ana Gouveia (at the time, Head of the Economic Developments Unit - Research and Strategy Office - Ministry for the Economy).
January 2015
Abstract: Portugal implemented a large number of structural reforms in the recent
years, which are expected to enhance the allocation of resources in the economy, namely from the non-tradable to tradable sector. We argue that the methodology to identify the tradable sector used by some international institutions is outdated and may hamper an accurate assessment of the progress achieved so far. Based on an enhanced methodology to identify the tradable sector, we are able to provide a more accurate, clearer picture of the recent structural developments of the Portuguese economy.
Table of Contents
I. Introduction ……… 3
II. Economic Background ………... 5
III. Literature Review ……….. 7
a. Academic Literature ………... 7
b. International Institutions’ Methodology ………. 9
IV. Methodology……… 9
a. The FIPEI tradable/non-tradable sector classification criterion ………. 9
b. Allocation Key – reconciling the classification of goods and services when measuring international transactions ……….. 11
V. Tradable/non-tradable Sector Classification yielded by the FIPEI Criterion ………. 15
VI. Results: Assessment of Structural Economic Transformation in Portugal ………… 18
a. Investment ……….. 20
b. Employment ………... 21
c. Unit Labour Costs ……….. 22
d. Foreign Direct Investment ……….. 23
e. Debt-to-equity (D/E) and Return on Assets (ROE) of non-financial corporations 24 VII. Conclusions ……… 27
VIII. Bibliography ……….…. 28
IX. Appendix ……… 31
a. Private and Government Sector Debt, Portugal (2005-2014) ……… 31
b. Protection of Permanent Workers Against Individual and Collective Dismissals (2008-2013) ……… 31
c. Data ………. 31
d. Import substitution, export orientation and TOR for all business sectors (as coded in 1-digit NACE 2) in the Portuguese Economy ………. 35
e. Allocation Key – Allocating international transactions of services to industries as specified in CAE Rev. 3. ……… 35
I. Introduction
The present article was developed for the Strategy and Research Office (GEE) of the Portuguese Ministry for the Economy, one of the entities responsible for designing and implementing economic policy in Portugal. The question it addresses is therefore one of pressing relevance for future policy design: what was the degree of structural transformation in the Portuguese economy in recent years? We provide an economic depiction based on a more precise tradable/non-tradable division which is expected to guide policy in addressing the barriers to an efficient allocation of resources between the tradable (TR) and non-tradable (NTR) sectors. Asymmetries in the allocation of resources between these two sectors were, indeed, identified as one of the root causes for the macroeconomic imbalances experienced by the country over the last decades, and therefore one of the central targets of the comprehensive and broad-based structural reforms package implemented within the 2011-2014 Adjustment Program. Rebalancing the Portuguese economy towards the tradable sector is expected to increase the economy’s flexibility and competitiveness, and ultimately minimize the social and economic costs of the adjustment.
This research tackles a subtle, yet fundamental underlying assumption of structural transformation measurement: the TR/NTR division criterion applied. We develop a refined methodology upon which structural transformation can be more accurately measured, and therefore better inform future policy actions. In fact, international institutions usually use one of two criteria: the rule-of-thumb of considering the manufacturing sector as the only TR one – a criterion that is becoming more obsolete as technological progress decisively unleashes the tradable potential of service sectors; or a dynamic and evidence-based criterion that uses export data (namely, the export-to-output ratio) to determine a sector’s tradability – defining TR sectors as exporting ones.
We build on this second approach and classify a sector as TR if part of its final output is either exported or imported. This extension, which entails some computational challenges, allows for a given sector that is not yet an exporter to be classified as TR as long as other countries are exporting the same kind of products: it can simply not have yet achieved the sufficient level of competitiveness to enter international markets. By numerically capturing the tradable potential of each sector, our division criterion closes a gap in the methodology which has been repeatedly identified by both previous authors
and international institutions, while guaranteeing the criterion’s parsimony in applicability and hence its policy suitability.
In the final chapter, discuss the gains from applying the TR/NTR distinction developed in this article. We assess the evolution, across the TR and NTR sectors, of investment and employment; labour productivity; foreign direct investment; firms’ financial and operational health indicators; and prices and markups. We then compare the results obtained with our dynamic, forward-looking criterion (henceforth, the FIPEI – Final Product Exports and Imports criterion) to the ones obtained by employing two other widely used criteria: the static IMF criterion; and the dynamic1, yet only based on exported content, criterion of Amador and Soares (2012).
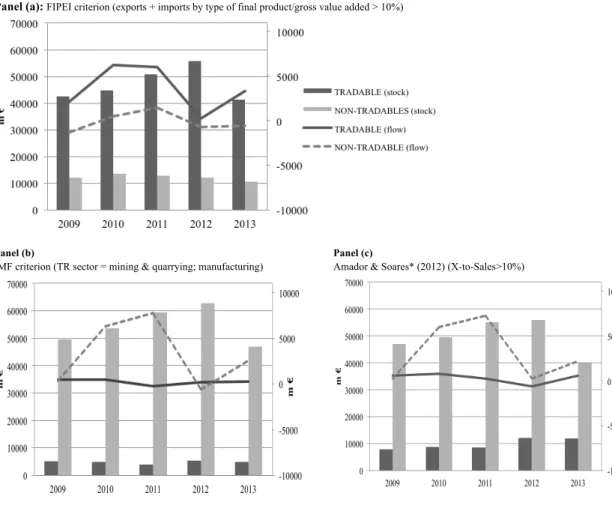
We show that the misspecification of the TR sector compromises the accurate assessment of exchanges of resources between the TR and NTR sectors of the Portuguese economy, in the period considered. The FIPEI criterion identifies a larger TR sector, thus portraying a more advanced adjustment process than international institutions’ country-monitoring reports, as evidenced by a catch-up of investment towards the TR sectors, but also by the relatively larger destruction of jobs in NTR sectors. Figure 1 offers an initial idea of the differences in allocation of resources across TR and NTR sectors for the case of investment.
Regarding the remaining structural indicators, the FIPEI criterion attests that the majority of foreign direct investment was directed at TR sectors, suggesting a softening in the misallocation of resources between the TR and NTR sectors. Despite the observed adjustment in unit labour costs, excessive rents persist in NTR sectors, as evidenced by relatively higher unit labour costs when using either three of the selected criteria. NTR sector firms remain more leveraged than those in TR sectors, albeit the significant reduction observed in the overall leverage of the economy, mostly due to recent developments in the construction sector. Accordingly, TR sectors appear to have a higher ROE2 relative to NTR ones, independently of the criterion applied. Because we observe substantial differences in the depiction of the distribution of different resources between TR and NTR sectors, we conclude that there are significant gains to be collected from applying TR/NTR enhanced classification systems.
1 We classify both the Amador and Soares (2012) and the FIPEI criteria as dynamic given their ability to classify a sector as tradable
according to their current exported, or exported and imported, respectively, content.
2 ROE stands for Return on Equity (i.e., the amount of net income returned as a percentage of shareholders equity). It measures a
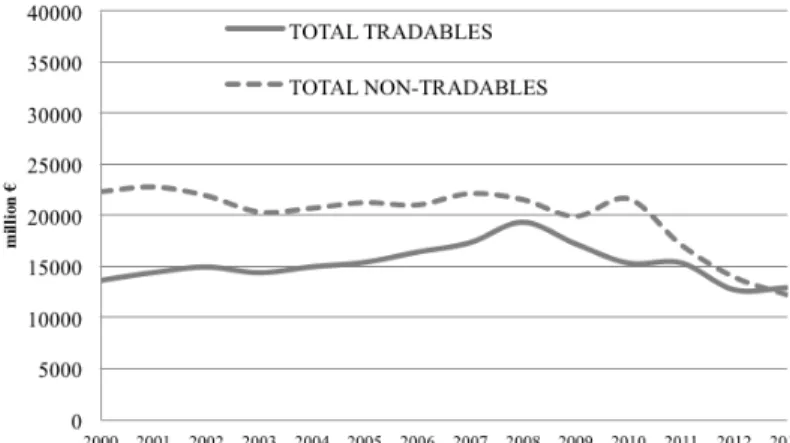
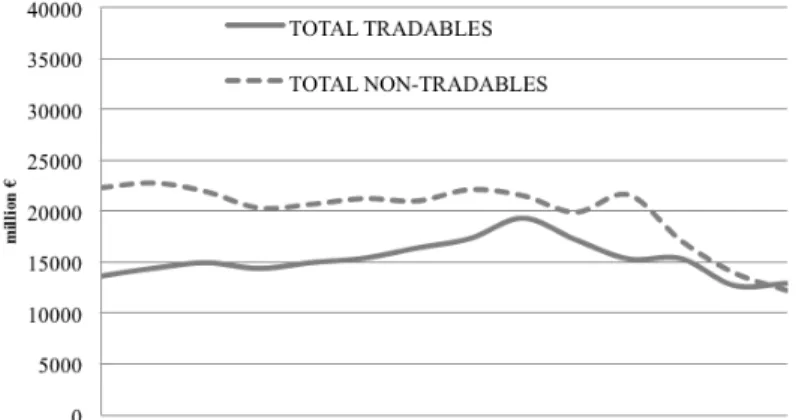
Figure 1: Investment (Gross fixed capital formation) in the TR and non-TR sectors (2000-2013), INE
Panel (a) FIPEI criterion (exports + imports by type of final product/gross value added > 10%)
Panel (b)
IMF criterion (TR sector = mining & quarrying; manufacturing)
Panel (c)
Amador & Soares* (2012) (X-to-Sales>10%)
II. Economic Background
In the last two decades, the Portuguese economy has averaged an annual economic growth of 1.1%: an average of 4.1% between 1996 and 2000 and zero growth for the remainder period. This sluggish economic behavior is due to structural problems that potentiated an array of macroeconomic imbalances:3:
• The existence of traditionally sheltered sectors, often inflated by easy credit, offering excessive rents and therefore distorting the allocation of resources in the economy, away from the TR sector and towards the NTR one. Notwithstanding, the Portuguese economy climbed 14 positions in the OECD’s Product Market Regulation Index4 between 2008
3 Unless otherwise stated, all the features of the Portuguese economy presented below are extensively discussed in the periodic
reports about the Portuguese economy issued by the IMF and the EC (See, for e.g., European Commission, Alert Mechanism Report (2016).
4 PMR (index scale 0 to 6 from least to most restrictive) is a comprehensive and internationally comparable set of indicators that
measure the degree to which policies promote or inhibit competition in areas of the product market where competition is viable. They measure the economy-wide regulatory and market environments as proxied by state control variables, barriers to entrepreneurship and barriers to trade and investment (OECD (2013), Product Market Regulation Database).
and 2013, having become less strict in almost all barriers to trade, investment and entrepreneurship indicators in 2013.5
• Chronic current account deficits that fed large negative net international investment positions and high private indebtedness. Despite the current account surpluses of 2013 and 2014, it is still estimated that higher current account surpluses are needed in order to reduce the net external liabilities in a timely fashion6.
• An accumulation of public deficits since the 1970s, often aggravated by substantial off-budget spending and large tax evasion.7 Simultaneously, the private sector – both households and non-financial corporations – has remained over indebted, as illustrated in Figure 2, reflecting the extent of over-borrowing due to easy and cheap credit prior to the crisis.
• As shown in Figure 4 in Appendix B, Portugal had the strictest labour market legislation in 2008 in Southern Europe, as measured by the OECD’s Employment Protection Legislation (EPL) indicators. As a result of the comprehensive set of labour market reforms pursued, it now exhibits the largest loosening of labour market legislation.8,9
The unfolding of the 2007-08 financial crisis, which culminated in a sudden stop of credit inflows to Europe’s highest indebted countries, led the Portuguese government to negotiate a three-year Adjustment Program with the ECB, the EC and the IMF. The broad-based set of reforms implemented allowed GDP growth to resume in 2014 (+0.9%), unemployment is falling and export performance has been recouping, turning the current account balance positive in 201310. In 2013, Portuguese SMEs started to deleverage, further accelerating that process in 2014.11.
5 Last available data
6 Macro Imbalances Procedure (MIP) Scoreboard, European Commission, Alert Mechanism Report (2016). The MIP's alert
mechanism consists of an economic reading of a scoreboard with 14 headline indicators which cover the most relevant dimensions of macroeconomic external and internal imbalances, competitiveness and labour and social adjustment issues. The AMR uses a scoreboard of selected indicators, plus a wider set of auxiliary indicators, to screen Member States for potential economic imbalances in need of policy action. Member States identified by the AMR are then analyzed an In-Depth Review (IDR) by the Commission to assess how macroeconomic risks in the Member States are evolving.
7 Despite the relatively high general government sector debt depicted in Figure 2 in Appendix A, the country’s fiscal adjustment is
set to slow down in the coming years, according to EC’s projections. Macro Imbalances Procedure (MIP) Scoreboard, European Commission, Alert Mechanism Report (2016). See Figure 2 of the Appendix A.
8 We compare Portugal with other Southern European countries undergoing similar economic adjustment processes at the time, and
with Germany, as one of Europe’s example of a stable labour market environment (as documented by its EPL legislation, in Figure 3, that has remained unchanged between 2008 and 2013.
9 Reforms targeted not only a decline in unit labour costs, but also the recoupment of competitiveness through enhanced training and
employment policies, as well as educational reforms.
10 Current account is not 1.4% of GDP, from -12.1% of GDP in 2008, One of the largest balance improvements recorded in the
European Union
11 Corporate debt on a consolidated basis, excluding SOEs, was at around 189% of GDP, from 209.6% in 2012. Dashboard on credit
International institutions, albeit recognizing some progress, continue to perceive the need to maintain reform momentum beyond the horizon of the program and towards the export sector. However, implementation of further effective reforms requires taking stock of the impact yielded by the ones undertaken so far. Having in mind that the utmost goal of the reform agenda is to ensure a more efficient allocation of resources, this paper addresses the degree of structural transformation of the Portuguese economy in the recent years via the reallocation of resources from the NTR to the TR sector.
III. Literature Review
As discussed before, an assessment of the re-allocation of resources towards the TR sector hinges on an accurate criterion to distinguish between TR and NTR. However, and despite its relevance for policy design, a consensual criterion remains to be worked out. More refined TR/NTR divisions tend to incorporate the effects of technological progress12, which unleash the tradable potential of several sectors. Several authors have recognized this thus straining away from traditional ad-hoc TR/NTR classifications. The fundamental discrepancy in TR/NTR methodologies lies in their ability to capture changes in sectors’ composition over time: a methodology based on actual tradability characterizes a sector as TR if it is already exporting its final products at an expressive level; a methodology that, instead, accounts for sectors’ tradable potential, characterizes as TR a sector which is not necessarily exporting at a given moment in time, so long as that sector has the potential to become an exporting one, when sufficient scale and efficiency are reached. The latter methodology recognizes the difference between a product being tradable, and it actually being traded internationally.
a. Academic Literature
The TR/NTR dichotomy is modeled13 as having special relevance for, inter alia, the effects of devaluation, the purchasing power parity theory of exchange rates, the determination of inflation in open economies and the specification and estimation of international trade flows (Goldstein and Officer, 1979). Empirical work has always lagged behind theoretical developments, due in large part to data limitations.
12 Spence and Hlatshwayo (2011) note that internet connectivity, innovative software and cross-border specialization allows services
which were not traded internationally some decades ago, to now be performed remotely at lower cost, often in another country
13 Relevant literature includes the work of Salter (1959), Swan (1963), Mundell (1971), Dornbusch (1973) and Kravis and Lipsey
(1978) on the effects on exchange rate changes; of Balassa (1964), McKinnon (1971), and Officer (1976) on productivity bias in the purchasing power parity theory of exchange rates; of Aukrust (1970), Edgren and others (1969), and Cross and Laidler (1976) on the determination of inflation in open economies; and of Murray and Ginman (1976), Clements (1977), and Goldstein and others (1980) on the estimation of trade flows.
Goldstein and Officer (1979) developed one of first comprehensive TR/NTR criterion. The authors use both trade flows and market behavior in identifying TR and NTR commodities or industries, defining as TR, not only commodities that are actually traded, but also those which could be internationally traded at some plausible range of variation in relative prices. The authors find that the degree of internationally commodity arbitrage, as measured by cross-country price correlation, is higher for TR than for NTR; and that TR are closer substitutes for imports than NTR.
Dwyer (1992) also strands away from the standard practice of subjectively assigning broad industry categories to the TR and NTR sectors, and rather classifying the sectors based on disaggregated input-output table data. Each industry's output is classified to a sector according to the export or import substituting propensity of its output. The decision rule for the sectoral allocation is based upon the orientation of production, as measured by import penetration and export orientation ratios. This method was later applied to Australia by Knight and Johnson (1997).
Jensen and Kletzer (2005) developed an approach to identify activities that were potentially exposed to international trade at a more detailed level (2-digit industry codes),, with particular focus on service sectors. The geographic concentration of service activities within the United States, as measured by the locational Gini, is used as a proxy for the domestic tradability of service activities.14
The US Treasury was one of the first institutions to add the volume of service exports to value-added production GDP of industries most likely to produce tradable output, namely, the primary sector and manufacturing. Authors such as Amador (2012) and Dixon et al (2004) identify as TR sectors all manufacturing markets plus those exhibiting an export-to-sales ratio above 15 percent, upon recognition that “several non-manufacturing sectors exhibited relatively high export-to-sales ratios”.
These methodologies, however, still fail at capturing the tradable potential of each sector, measured by indicators such as imports [by type of final product]; they just measure the value of actually traded products. We aim at closing such gap, by developing a TR/NTR dynamic classification which is able to capture technological progress and classifies as tradable all sectors with potential to compete in foreign markets, additionally to those already doing so.
14 This methodology should be applied cautiously as e.g. legal services, although highly tradable at a national level, are not so
b. International Institutions’ Methodology
International institutions such as the IMF or the ECB have traditionally proxied the TR sector with the manufacturing one, for parsimony. 15 Such classification is still adopted nowadays in country-assessment reports. Some institutional bodies nuance this ad-hoc classification. The macro-economic database of the European Commission's Directorate General for Economic and Financial Affairs (AMECO) includes in the TR sector manufacturing and mining, agriculture and fisheries, but also trade, hotels, transports and utilities; the most recent classification of the TR sector by the European Commission encompasses agriculture, forestry and fishing, industry, wholesale and retail trade, transportation and storage, accommodation and food service activities, and, in some cases, also the energy, water supply and sewerage sectors.16 The ECB (2012) added to the traditional manufacturing and primary sector accommodation and food service activities, information and communication activities and financial services.17
The methodologies of international institutions –the focus of comparison for this study’s results –, have important limitations: crude proxies are static; the manufacturing sector represented only around 14% of total gross value added by the economy between 2009 and 2013, and around 25% of the TR output produced in that period. Basing structural assessments on proxies, as the TR/manufacturing one, which disregard roughly three quarters of TR output, may have substantial impact on subsequent policy assessments..
IV. Methodology
We aim at bringing the most recent advances in the TR/NTR classifications provided by the academic literature to the policy debate, which has so far mostly relied on ad-hoc static distinctions. At the same time, we must do so with a tractable approach, sufficiently economical in terms of data requirements.18
a. The FIPEI TR/NTR sector classification criterion
The TR/NTR classification criterion developed in this article captures the effects of technological evolution on potential tradability over time19 for all sectors of the economy,
15 See, for example, Tressel and Wang (IMF, 2014); Portugal – Selected Issues (IMF, 2015); Occasional Paper Series No. 139
(ECB, 2012).
16 See, for example, EC’s Quarterly Report on the Euro Area, Volume 12 No 4, 17 ECB (2012), Occasional Paper Series No. 139
18 This precludes us from using methods based e.g. on the locational Gini (Jensen and Kletzer, 2005) or the ones using gravity
approaches
19 Spence and Hit (2011) state that both the decrease in transport costs and the reduction in the degree of international trade
while remaining clear and of easy use for policy makers. It thus serves one of the institutional purposes of this work: to strain away from the use of crude proxies for the TR sector in the national authorities’ assessment of structural economic transformations, allowing for a more accurate depiction of the economic situation. By adding imports (by type of final product, following NACE [Nomenclature Générale des Activités
Economiques dans les Communautés Européennes] 2) to exports, we are able to compute
the trade-to-output ratio, capturing the previously unaccounted for TR potential of each sector. The idea is that, if final products of the same type are being imported by the country, then national sectors should be able to export their products, when sufficient scale and efficiency are reached – thus materializing their TR potential. The inexistence, to date, of exports and/or imports from and to that sector should not necessarily imply that it is a NTR sector; rather, it should only point to the presence of gains from efficiency to be collected from competing with the rest of the world.
The first step in this process consists of combining the two most intuitive and widely accepted definitions of tradability. The first is a textbook one: a TR sector is one facing international competition.20 The second characterization of a TR good or service encompasses all goods and services that can be produced in one country and consumed in another, or, in the case of tourism and education, consumed by people from another country.21 Coupling these two, as long as we can track international transactions (i.e., exports and/or imports) of a good or a service produced by a given sector, virtually anywhere in the world, then that sector should be considered TR, since it is certainly potentially TR22. Although tracking international transactions for all sectors on a worldwide basis is beyond the scope of this work, it is perfectly feasible to extend it in this direction23. This tradability concept was first used by Bems (2008) with the trade-to-output ratio (TOR), whereby a sector is TR if the sum of its exports and imports is higher than that of the retail and wholesale sector, a benchmark NTR sector in the literature. We modify Bems’s approach and use imports and exports by type of final product in the computation of the TOR24. An industry shall be classified as TR if the TOR exceeds 10%. Our novelty lies in measurement of international transactions (the numerator in our
20 Attewell and Crossan (OECD, 2013) classify tradable industries as industries where the majority of the output faces international
competition
21 Spence and Hlatshwayo (2012). 22 Please note that we do
23 However, we should note that some goods may be traded, or tradable, between two given countries, but not between some others
in which barriers to trade are still too high.
24 We account for final products because data on the imports of each sector does not yield any information about the tradable
potential of that sector’s final products (for e.g., a service sector may import machinery, but that does not qualify as imports of that sector’s kind of final product, and we would not therefore know whether that sector’s final produce can be traded internationally).
modified TOR): imports and exports of a given sector are proxied by all final goods and services, exported or imported, as classified in the second revision of the industrial classification NACE Rev. 2.
The steps taken in construction of this methodology are presented below.
1. We compute the TOR (M+X by type of final product/GVA) for each sector. 1.1. Output of each sector in the economy (following NACE Rev. 2 classification) is measured using the gross value added by industry at current prices for years 2010, 2011, 2012 and 2013. As explained by Amador and Soares (2012), using the GVA eliminates effects of changes economy structure. This is preferred to sales since this latter, albeit commonly used in the literature, overstates a decrease in competition in a sector of high sales but very little GVA or employment.
1.2. The value of each sector’s imports and exports is given by the sum of all final goods and/or services imported and exported in years 2010, 2011, 2012 and 2013. This means that, for e.g., the total imports of the agriculture, forestry and fishing sector [section A in NACE Rev. 2] in a given year correspond to all final farming, fishing and agriculture related products that were imported in that year; similarly, total exports correspond to the all final farming, fishing and agriculture related products that were exported.
2. All sectors with a TOR above 10%25 are considered TR.
b. Allocation Key – reconciling the classification of goods and services when measuring international transactions
Since, for most sectors, data relative to the exports/imports of goods by type of good are compiled by INE(INE), while international transactions of services are accounted for in the Balance of Payments compiled by the BdP (BdP), an allocation key had to be developed and applied so as to reconcile the classification of services as presented in the Balance of Payments (following Balance of Payments Methodology 6) with the classification of goods as presented by INE (CAE Rev. 3).
25 For a threshold sensitivity analysis, please see the appendix. A detailed list of each sector’s export orientation (ratio of exports,
proxied as explained above, to total sector gross value added) and import consumption (a ratio of competing imports, proxied as explained above, to total sector gross value added) can also be found in the appendix.
When accounting for international transactions of all types of goods and services, so as to determine each economic sector’s tradability level, we used different data sources (INE, BdP, or both) according to each particular sector’s content as described in CAE Rev. 3: we assign each item specified in the National Statistics’ Institute (INE) International Trade statistics “Imports/Exports by type of good, product by activity” as belonging to a certain section, according to the latter’s content as specified in CAE Rev. 3. Similarly, we assign each item specified in the national Balance of Payments, compiled by the BdP (BdP) as belonging to a certain section, according to the latter’s content as specified in CAE Rev. 3.
For goods-only producing sectors, data for the imports/exports of goods by type of good (INE) was used; for service sectors, we used data from the Balance of Payments (BdP) or from INE, depending on whether the description of that particular section’s content was more aligned with the description of the related items in the Balance of Payments (BdP) or in the International Trade Statistics (INE); for sectors internationally trading goods and services, we combined information from both sources, following the same rationale. Using CAE Rev. 3 classification of final goods and services, we allocated each service item as specified in the Balance of Payments to a given CAE, based on their content, to thereafter be able to sum the imports/exports of all goods and services included in each CAE. A detailed list of each tradable sector’s accounted for international transactions can be found below26.
Sector A: Agriculture, Forestry and Fishing. This is mainly a good-producing sector.
International transactions (i.e., exports and/or imports) of goods included in sector A encompass those of products of agriculture, hunting and related services; products of forestry, logging and related services; fish and other fishing products and aquaculture products. International transactions of fishing services are also accounted for under this sector. All data relative to transactions of this section was gathered from National Statistics.
Sector B: Mining and Quarrying. This is mainly a good-producing sector. International
transactions of goods of industry C accounted for include those of coal and lignite; crude petroleum and natural gas; metal ores; other mining and quarrying products. All data relative to transactions of this section was gathered from National Statistics.
Sector C: Manufacturing. This is also mainly a good-producing sector. International
transactions of goods of the manufacturing industry accounted for were collected from INE and include those of food products; beverages; tobacco products; textiles; wearing apparel; paper and paper products; coke and refined petroleum products; chemicals and chemical products; basic pharmaceutical products and pharmaceutical preparations; rubber and plastics products; fabricated metal products, except machinery and equipment; computer, electronic and optical products; electrical equipment; motor vehicles, trailers and semi-trailer; other transport equipment; furniture; other manufactured goods27. International transactions of services between 2010 and 2013 classified as belonging to the manufacturing industry are registered in the Balance of Payments, compiled by the BdP (BdP). The services accounted for include maintenance and repair services of ships, aircraft and other transport equipment. We classify these services as a ‘section C’ based on CAE Rev. 3, which considers the specialized repair of goods produced in the manufacturing sector with the aim to restore machinery and equipment to working order (division 33) as manufacturing (section C).
Sector D: Electricity, Gas, Steam and Air Conditioning Supply. International transactions
of goods of industry D accounted for include those of electricity, gas, steam and air conditioning products. All data relative to transactions of this section was gathered from National Statistics.
Sector H: Transportation and Storage. Transportation and storage services traded by
Portugal internationally are accounted for in the Balance of Payments. These include sea, air and other modes of transport and postal and courier services. Although some activities encompassed in this sector are intuitively non-tradable (e.g., local transportation), the fact that the sum of imports and exports of this type exceed the indicative 10% threshold in the computation of the TOR, signals the mostly tradable character of this industry.
Sector I: Accommodation and Food Service Activities. Data for international transactions
of accommodation and food service activities is compiled in the travel item of the Balance of Payments and exceeds the indicative 10% threshold upon computation of the TOR. This is in agreement with our intuition that Portugal, as a travel destination, is subject to international competition – someone may decide to visit Portugal instead if they see it as better value for money – and should therefore be considered as tradable.
Sector J: Information and Communication. Data for international transactions of section
J-type services is compiled in the Balance of Payments and includes: publishing services; motion picture, video and television program production services; sound recording and music publishing and telecommunications, computer, and information services.
Sector K: Financial and Insurance Activities. Data for international transactions of
section K-type services is the Balance of Payments and includes insurance, pension and financial services.
Sector M: Professional, Scientific and Technical Activities. Data for international
transactions of section M-type services is compiled in the Balance of Payments and includes: architectural and engineering services; technical testing and analysis services; research and development services; professional and management consulting services; legal, accounting, management and public relation services; advertising, market research and public opinion polling; other technical services.
Sector N: Administrative and Support Service Activities. Data for international
transactions of section N-type is compiled in the Balance of Payments and includes: rental and leasing activities (services like Airbnb mark the transition of the rental of households and household goods definitely towards the TR sector; rental and leasing operations of other machinery, equipment and tangible goods are common practice within large multinational groups); Travel agency, tour operator and other reservation service and related activities; security and investigation activities and Office administrative, office support and other business support activities (multinational groups often centralize IT services, accounting services, back office services, etc.)28; franchises and trademarks licensing fees.
The next section presents the resulting classification of the industries as TR or NTR. A critical discussion of these results is also presented. Thenceforth, in Part 2, we analyze the data for (foreign direct) investment, employment, productivity(as proxied by ULCs), EBITA ratios and profits of companies in the TR/NTR sectors, creation of new businesses, credit flows and credit stocks at the sectoral level and, finally, prices and
28 For multinational groups, we often observe that “activities that may relate to the group as a whole are those centralized in the
parent company or a group service center (such as a regional headquarters company) and made available to the group (or multiple members thereof). The activities that are centralized depend on the kind of business and on the organizational structure of the group, but in general they may include administrative services such as planning, coordination, budgetary control, financial advice, accounting, auditing, legal, factoring, computer services; financial services such as supervision of cash flows and solvency, capital increases, loan contracts; assistance in the fields of production, buying, distribution and marketing; and services in staff matters such as recruitment and training. (OECD Transfer Pricing Guidelines for Multinational Enterprises and Tax Administrations, July 2010) [last updated version].
mark-ups for the TR and NTR sectors, between 2008 and 2013, with the goal of evaluating the actual reallocation of resources between the two sectors.
V. TR/NTR Sector Classification yielded by the FIPEI criterion
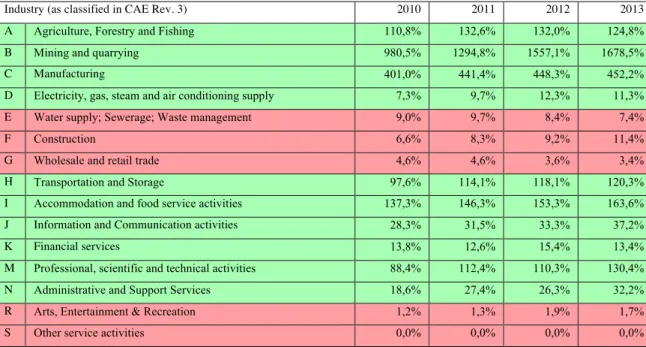
The classification results yielded by our TR/NTR methodology are presented and discussed in this section. In Table 1, the composition of the TR and NTR sectors over time (from 2010 to 2013) is shown. For a more detailed characterization of each of the represented sector’s degree of importability and exportability, please see the Appendix. Table 2: TORs for all business sectors (as coded in CAE Rev. 3, 1-digit industry classification) in the Portuguese
Economy, between 2010-2013, following the GVA criterion. TR sectors are in green; NTR ones in red.
The decision rule is that if the degree of import substitution or export orientation (when rounded) for an industry is greater than or equal to the threshold value of 10% then the relevant industry is eligible for inclusion in the tradable sector. When an industry is eligible for inclusion in both the importable and the exportable sectors, it is highlighted in green in the table. No data on imports/exports by goods is compiled either by the BdP or INE(INE) for the following sectors: L, O, P and Q. Although data for the S sector was available, the TORs equaled zero in every single yearly period of the analysis. For that reason, the sector is thenceforth left aside.
Table 2 shows the composition of the TR and NTR sectors over time, with the majority of sectors exhibiting an enhancement in their tradable character in the period during analysis.
Firstly, our methodology performs in a satisfying manner in characterizing the literature-attested high tradability level of the primary, the mining and quarrying and the manufacturing sectors. The results yielded by our methodology attribute to all these three sectors the relatively tradability ratios, as measured by the TOR (124.8%, 1678,5 and 452,2, respectively, in 2013). The mining and quarrying sector, traditionally classified in Industry (as classified in CAE Rev. 3) 2010 2011 2012 2013 A Agriculture, Forestry and Fishing 110,8% 132,6% 132,0% 124,8% B Mining and quarrying 980,5% 1294,8% 1557,1% 1678,5%
C Manufacturing 401,0% 441,4% 448,3% 452,2%
D Electricity, gas, steam and air conditioning supply 7,3% 9,7% 12,3% 11,3% E Water supply; Sewerage; Waste management 9,0% 9,7% 8,4% 7,4%
F Construction 6,6% 8,3% 9,2% 11,4%
G Wholesale and retail trade 4,6% 4,6% 3,6% 3,4% H Transportation and Storage 97,6% 114,1% 118,1% 120,3% I Accommodation and food service activities 137,3% 146,3% 153,3% 163,6% J Information and Communication activities 28,3% 31,5% 33,3% 37,2%
K Financial services 13,8% 12,6% 15,4% 13,4%
M Professional, scientific and technical activities 88,4% 112,4% 110,3% 130,4% N Administrative and Support Services 18,6% 27,4% 26,3% 32,2% R Arts, Entertainment & Recreation 1,2% 1,3% 1,9% 1,7%
the literature, both academic and institutional, as tradable, registered a 698.0% increase in its TOR, albeit the importing substitution has accounted mostly for this (+652.0% vs. 46.1% increase in the export-orientation over the 4-year period considered).On the other end, the professional scientific and technical activities sector, registered one of relatively largest growths (+42%) between 2010 and 2013, mostly owing to the expansion of its TOR to a 41.0% increase in its export orientation over this period. The manufacturing sector, commonly accepted as tradable, is attested by our methodology as having enhanced its tradable character by 51.2% over this 4-year period, further considering a 60.1% growth in its export orientation.
The tradable potential of the transporting and storage sector is both acknowledged in previous literature29 and recognized as having an impact on real exchange rate economic theory30. The classification of the accommodation and food service activities sector as tradable is also relatively indisputable: when foreigners consider Portugal as a travel destination, prices (namely the prices of accommodation and food service activities) at destination do play a role in comparing destinations, so one can already to be tempted to attest sensibility to such classification. Notwithstanding, however, the tradable potential of this sector is further attested by applying our abstract criterion to it: not only does the accommodation and food service activities sector seem to be subject to international competition, as it is recognized as tradable by Spence and Hlatshwayo (2011), alongside education, as an example of a tradable good which can be consumed by foreigners. The information and communication sector – which includes activities such as software, computer programing and related consultancy, motion picture, video, television program and music publishing activities, telecommunications and computer service activities like web portals, data processing and hosting activities– should indeed, by implication of the gap this methodology tries to close, be classified as TR by our methodology; the increase in the pace of communication allowed for by technological evolution, while undeniable, was not yet fully reflected in TR/NTR division literature or international institutions methodological practices.
The tradability of the financial services sector, not only globally established, is attested for by the European and overall world effort to push for convergence in the financial supervisory and banking union practices and standards31. Finally, the tradability of the
29 Sachs & Larrain, B. F. (1993) 30 MacDonald & Ricci, L. A. (2001) 31 Latest developments on Basel III
administrative and support services sector, as attested by our criterion, can also be confirmed by intuition: the worldwide availability of websites like Airbnb32, a short-term apartment and room-rental service, reinforce the tradable character of rental of households and household goods, while rental and leasing operations of other machinery, equipment and tangible goods are common practice within large multinational groups. Furthermore, office administrative, office support and other business support activities are currently commonly centralized in multinational groups33 and regulated by OECD’s Transfer Pricing Guidelines.
The construction and the electricity, gas, steam and air conditioning supply sectors stand for paradigms of sectors whose tradability potential has crossed the border from mostly NTR towards mostly TR sectors. The tradable portion of construction sector activities mostly concern, as specified in their NACE classification, the development of construction projects, as well as real-estate promotion activities and the technical and financing gathering of means to realize the construction. However, because the construction’s sector tradability only exceeds the 10% threshold imposed upon the TOR in one year, and given further that it does not satisfy our conceptual definition of tradability, whereby a sector is defined as TR if the goods and services which compose them can be produced in a country and consumed in another. Because the bulk of the construction sector activity remains actual construction work, and those activities are not TR by definition, we chose to classify the construction sector as non-TR.
The electricity, gas, steam and air conditioning supply sector’s shift towards tradability could indicate that some degree of liberalization within the energy market, after international institutions’ continuous push, both during the implementation of the Economic Adjustment Program and in the country assessment reports that followed, for deep product market reforms in this sector towards freer competition. We will accept the methodological results proposing the electricity, gas, steam and air conditioning supply sector as TR.
32 By the end of 2016, listings on home-renting platform Airbnb Inc. could make up as much as 1.2% of hotel offerings. Airbnb
listings could make up 3.6% to 4.3% of inventory by 2020, the analysts say (Merrill Lynch publications, 2015).
33 For multinational groups, we often observe that “activities that may relate to the group as a whole are those centralized in the
parent company or a group service center (such as a regional headquarters company) and made available to the group (or multiple members thereof). The activities that are centralized depend on the kind of business and on the organizational structure of the group, but in general they may include administrative services such as planning, coordination, budgetary control, financial advice, accounting, auditing, legal, factoring, computer services; financial services such as supervision of cash flows and solvency, capital increases, loan contracts; assistance in the fields of production, buying, distribution and marketing; and services in staff matters such as recruitment and training. (OECD Transfer Pricing Guidelines for Multinational Enterprises and Tax Administrations, July 2010 [last updated version]).
The remaining sectors – wholesale and retail trade; arts, entertainment and recreation; and other service activities such as those of membership organizations, trade unions, repairement of personal household good and hairdressing, among others – are intuitively, yet as also yielded by our methodology, mostly non-tradable, as recognized34 by several previous authors in the literature. Kletzer and Johnson (1997) use the evidence of the ubiquitous geographic presence of retail trade as a direct implication of its non-tradable character. The arts, entertainment and recreation sector, as including activities such as performing arts, libraries, archives and museum activities, sports activates and amusement and recreation activities, is constituted mostly of activities which do not get consumed in a country other than where they were producer (for reasons of culture and language, in the case of performing arts, or for motives of geographic proximity, as in the case of maintenance activities related to the other specified areas).
In the next chapter, we provide a comparative analysis of the evolution of the tradable and non-tradable sectors of the Portuguese economy between 2010 and 2014, analyzing the reallocation of resources between the two sectors as redefined by our methodology and discussing our main findings against international institutions’ result on the same issue.
VI. Results: Assessment of Structural Economic Transformation in Portugal
In this final chapter, we answer our initial research question and discuss the gains from applying the TR/NTR methodology developed in this article. By looking at recent developments on a set of core economic indicators under an enhanced methodology, we provide a more reliable depiction of the dynamics between the TR and NTR sectors of the Portuguese economy. This exercise should contribute to the clarification of two main questions: What was the degree of structural transformation in the Portuguese economy over the recent years? Does an increased accuracy in identifying the TR sector yield different conclusions about Portugal’s recent economic developments than those suggested by the application of more widely used measures of tradability?
To answer such questions, we assess the evolution, across the TR and NTR sectors, of a set of indicators that provide a comprehensive assessment of an economy’s structural progress: investment; employment; labour productivity; foreign direct investment; and firms’ financial and operational health indicators.
34 Knight and Johnson (1997) use the evidence of the ubiquitous geographic presence of retail trade as a direct implication of his
We further compare the results obtained with our dynamic, forward-looking criterion to the results one obtains by employing two other widely used criteria: the static IMF criterion and the dynamic, yet still based on de facto outcomes, criterion of Amador and Soares (2012) – showing that a misspecification of the tradable sector may compromise an accurate assessment of the economic developments in a country.
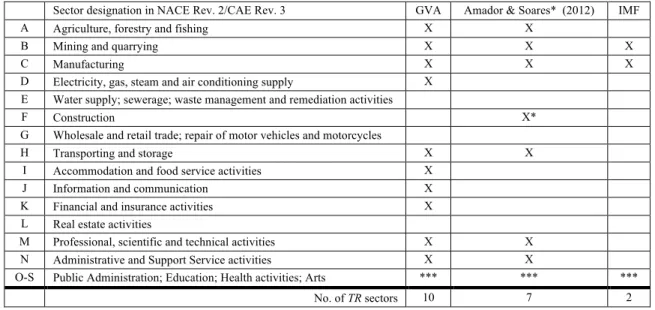
Table 2: TR/NTR sector classification results yielded by GVA, Amador e Soares* (2012) and the IMF criteria
Sector designation in NACE Rev. 2/CAE Rev. 3 GVA Amador & Soares* (2012) IMF
A Agriculture, forestry and fishing X X
B Mining and quarrying X X X
C Manufacturing X X X
D Electricity, gas, steam and air conditioning supply X E Water supply; sewerage; waste management and remediation activities
F Construction X*
G Wholesale and retail trade; repair of motor vehicles and motorcycles
H Transporting and storage X X
I Accommodation and food service activities X J Information and communication X K Financial and insurance activities X L Real estate activities
M Professional, scientific and technical activities X X N Administrative and Support Service activities X X
O-S Public Administration; Education; Health activities; Arts *** *** *** No. of TR sectors 10 7 2 X*: Under the original identification in Amador and Soares (2012), which places the indicative threshold for tradability above 15%, rather than 10%, the construction sector is classified as non-tradable.
***: INE does not publish disaggregated unit labour costs or imports/exports [by type of final product] for sectors S to O (Public Administration; Education; Health activities; and the Arts), often aggregating it as presented here.
The IMF criterion stands as paradigm for the crudest TR/NTR classification. Other international institutions such as the EC and the ECB tend to follow a similar approach, either proxying the TR sector using only the mining and quarrying and the manufacturing, or applying modest nuance to this ad-hoc method. Even in the latter case, institutions tend to apply different extensions upon the simpler manufacturing proxy, giving rise to little consensus and often yielding the same conclusions on assessment of countries’ structural results. Amador e Soares (2012) criterion, which we modify for the purposes of this analysis, constitutes somewhat a middle ground between the IMF criterion and our own. It uses the export-to-sales ratio, which captures the tradability of any sector exporting at that point in time (therefore classifying as TR sectors other than the mining and quarrying and the manufacturing industries, as detailed in the previous chapter), but not that of other sectors which, albeit not yet exporting, can begin to do so when sufficiently competitive, and should therefore be classified as TR (as they are in our own methodology through the incorporation of the imports by type of final product indicator). Finally, the GVA criterion improves on the previous two, by capturing the effects of technological evolution on tradability over time for all sectors of the economy,
even if they are not yet exported by the country, while remaining clear and of easy use for policy makers. Table 2 presents the TR/NTR sector classification results yielded by these three criteria.
a. Investment
Between 2000 and 2012, investment in the TR sector lagged behind investment in the NTR, but the difference between the two was progressively being diminished (Figure 5 – panel a). With the onset of the crisis, investment in the NTRs was more severely hit and, in 2013, with the slight improvement in the investment in the TR sector, the amount of resources invested in the TRs surpassed, for the first time in the period assessed, that in the NTRs.
Would different criteria allowed us to reach the same conclusions? As depicted in panels (b) and (c), we observe substantial discrepancies in the distribution of investment flows across the TR and NTR sectors of the Portuguese economy. Both the IMF and the Amador & Soares criteria point to a much larger gap between the two sectors and the persistence of the gap in 2013.. Indeed, while the European Commission (2014) states that “there were no signs, as of 2013, of an improvement in investment activity in tradable industries”, the opposite becomes true using the GVA criterion. The IMF TR/NTR criterion yields a negative average annual growth rate for both the TR and the NTR sectors (-1.66% and -2.89%, respectively), whereas the GVA criterion points to a much less pronounced contraction in investment directed at TR sectors (-0.43%, comparing to a decrease of -2.72% in the investment directed towards NTR sectors).
Figure 5: Investment (Gross fixed capital formation) in the TR and NTR sectors (2000-2013), INE
Panel (b)
IMF criterion (TR sector = mining & quarrying; manufacturing)
Panel (c)
Amador & Soares* (2012) (X-to-Sales>10%)
b. Employment
The use of the FIPEI criterion points to a convergence, in the last years, of the number of jobs in the TR and NTR sectors. Since 2011, we observe a larger contraction of employment in NTR sectors – a tendency that remains in 2012 and 2013. Panel (a.1) of Figure 6 also evidences the significant labour shredding that occurred since 2009, following the onset of the financial crisis.
When analyzing the creation of jobs between 2000 and 2008, the differences yielded by the use of alternative TR/NTR criteria are, once again, substantial. Contrastingly to the convergence picture yielded by the FIPEI criterion, the IMF criterion suggests a persistently larger creation of jobs in NTR sectors. Relative to the FIPEI criterion, the Amador & Soares criterion suggests a more pronounced destruction of jobs in the TR sector on a yearly basis, since 2009 (-3.24% vs. -2.00%). Additionally, the Amador criterion points to a relatively larger annual destruction of jobs in the tradable sector (-1.53%), a result that is contradicted by both the FIPEI and the IMF criteria. Thus, the results yielded by the FIPEI criterion signal a potentially stronger reallocation of labour from the NTR towards the TR sectors between 2000 and 2013 than that suggested by cruder proxies.
Figure 6: Employment (year-on-year absolute change in the number of jobs, 2000-2013), INE Panel (a.1): FIPEI criterion (exports + imports by type of final product/gross value added > 10%)
Panel (a.2): Number of jobs in the TR and NTR sectors following the FIPEI criterion (2000-2013), INE
Panel (b)
IMF criterion (TR sector = mining & quarrying; manufacturing)
Panel (c)
Amador & Soares* (2012) (X-to-Sales>10%)
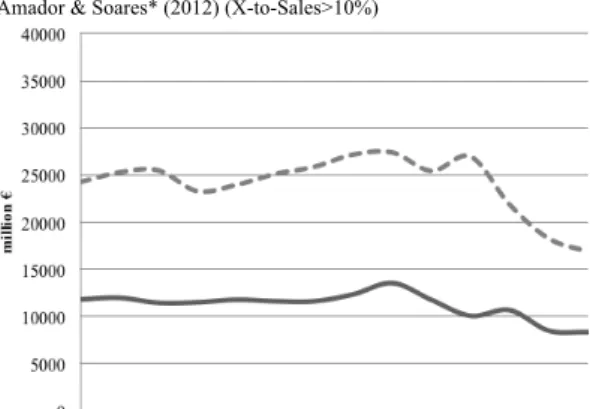
c. Unit Labour Costs
The Portuguese economy was characterized by weak growth over a protracted period before the onset of the crisis in 2009. Following the implementation of the Adjustment Program, the 2% annual decline in unit labour costs vis-a-visa the euro area between 2011 and 2013 crucially supported the export growth35. The FIPEI criterion points to a sharper adjustment (driven by cuts in employment and wage restraint) in NTR sectors after 2009, although a marked decrease in unit labour costs in TR sectors was also observed. Notwithstanding these developments, international institutions continue to emphasize that the reallocation of the labour force toward the traded sector remains limited36, mainly hindered by the significant segmentation in the labour force. All three criteria yield confirm the existence of higher unit labour costs in NTR sectors, possibly reflecting the excessive rents in some NTR markets, part of which are passed on to employers37.
35 The Economic Adjustment Programme for Portugal 2011-2014. EC (2014). 36 Portugal – Selected Issues (IMF, 2015)
37 In 2012, the human health and social activities sector remained as the most unionized of the non-tradable sectors. The
administrative and support services sector was in 2012 the second most unionized. However, the transportation and storage sector (classified as tradable under the FIPEI criterion), is by far the most heavily unionized (Costa, Dias e Soeiro, 2012).
Figure 7: Unit Labour Costs (annual average) for the TR [TULC] and NTR [NTULC] sectors, INE. Panel (a): FIPEI criterion (exports + imports by type of final product/gross value added > 10%)
Panel (b) Panel (c)
IMF criterion (TR sector = mining & quarrying; manufacturing) Amador & Soares* (2012) (X-to-Sales>10%)
d. Foreign Direct Investment (FDI)
International institutions point to the attractiveness of the NTR sector as an in investment destination (offering opportunities for rent-seeking, due to the prevailing noncompetitive environment, such as barriers to entry, heavy regulation, etc.) as an important source of misallocation of resources, while other authors point to misallocation of foreign investment flows towards NTR sectors in earlier stages than those under current analysis38. However, as illustrated in Panel (a) of Figure 7, the FIPEI criterion suggests that, between 2009 and 2013, the majority of foreign investment was directed at TR sectors (stocks), evidencing a stronger pace of reallocation of foreign investment towards more productive sectors of the Portuguese economy.
Conversely, the application of both the IMF and the Amador criteria conveys an idea of foreign investment to have been mostly concentrated in NTR sectors between 2009 and 2013, as attested in Panels (b) and (c) of Figure 8. Foreign direct investment flows for the NT sectors are higher for both the Amador and the IMF criterion, while the FIPEI criterion suggests a recent downward adjustment in FDI flows for those sectors.
Figure 8: Foreign Direct Investment in Portugal
Panel (a): FIPEI criterion (exports + imports by type of final product/gross value added > 10%)
Panel (b)
IMF criterion (TR sector = mining & quarrying; manufacturing)
Panel (c)
Amador & Soares* (2012) (X-to-Sales>10%)
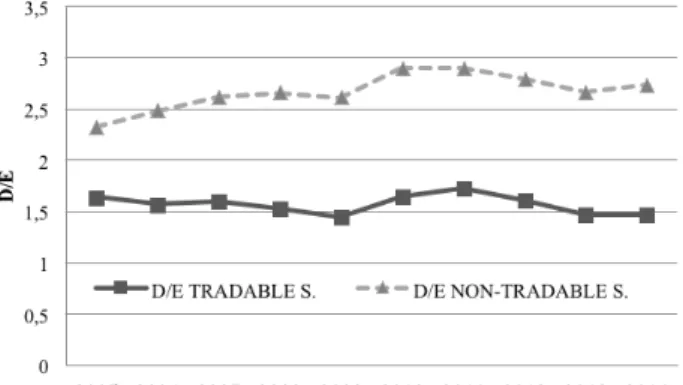
e. Debt-to-Equity (D/E) and Return on Assets (ROE) of non-financial corporations
We now look at indicators expected to portray the financial and operational health of the Portuguese firm tissue. High corporate leveraging and non-performing loans were perceived as acute economic problems before and during the adjustment process, since excessive debt impacts the profitability of firms and hence their ability to obtain funding and might refrain them from investing39. Panel (a) of Figure 9 shows a slight deleveraging of non-financial corporations of both sectors, between 2011 and 2013. A great part of the NTR sector deleveraging observed is due to recent developments in the construction sector40. Hence, the differences in results yielded by the Amador criterion, relative to the IMF’s and FIPEI, are probably caused by the classification of the construction sector as tradable under Amador, which decreases the overall debt-to-equity ratios for the NTR sector.
39 Cecchetti et Al. (2010) show that corporate debt becomes a drag on growth for levels beyond 90 percent of GDP. More recently,
the European Investment Bank documents a negative relationship between NFC credit growth and the share of NPLs (EIB (2015)). Bergthaler, et Al. (2015) find that high corporate debt and NPLs represent a significant drag on investment, as credit-constrained firms cut back on spending to repay debt.
Figure 9: D/E ratios for firms in the TR and NTR sectors
Panel (a): FIPEI criterion (exports + imports by type of final product/gross value added > 10%)
Panel (b)
IMF criterion (TR sector = mining & quarrying; manufacturing
Panel (c)
Amador & Soares* (2012) (X-to-Sales>10%)
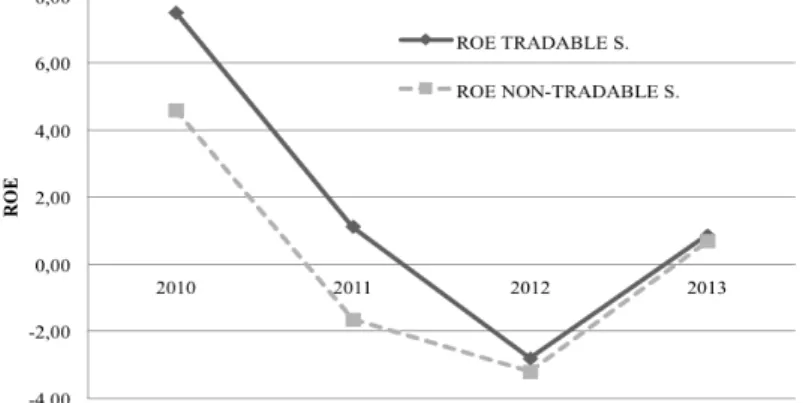
Now turning to the results on TR and NTR sector firms’ profitability (proxied by the return on assets ratio), on Figure 10, the FIPEI criterion points to a convergence of ROE levels between TR and NTR sectors since 2012, suggesting an elimination of investment distortions across the two sectors, and following a period of negative returns for whole of non-financial corporations since 2010. The recovery of profit margins in the TR sector was partly supported by wage cost reductions and a fall of the relative price of NTR sectors, as discussed below.
The gap between the relatively higher returns for TR sectors and NTR ones is closed in 2012 under both the Amador and the FIPEI criterion, but persists upon implementation of international institutions TR/NTR methodology. The FIPEI criterion additionally points to a same paced improvement in returns for both sectors since 2012, contrastingly to either one of the other two criteria considered.
Figure 10: ROE for non-financial firms in the TR and NTR sectors (2010-2013), INE Panel (a): FIPEI criterion (exports + imports by type of final product/gross value added > 10%)
Panel (b)
IMF criterion (TR sector = mining & quarrying; manufacturing
Panel (c)
Amador & Soares* (2012) (X-to-Sales>10%)
VII. Conclusions
The FIPEI criterion offers substantial improvement on the depiction of exchanges of resources between the tradable and non-tradable sectors of the Portuguese economy, in the period considered. We show that this adjustment progress is currently more advanced than portrayed in international institutions’ country-monitoring reports, as evidenced by a catch-up of investment towards the TR sectors, which is, as of 2013, at higher levels than that directed at NTR sectors, and contrarily to results yielded by either the IMF or the Amador criterion; but also by the relatively larger destruction of jobs (and firms) in non-TR sectors than that suggested by the other two criterion. Not only that, the FIPEI criterion seems to attest that the majority of foreign direct investment was directed at TR, rather than NTR sectors, suggesting a softening in the misallocation of resources between the two sectors. Despite the observed adjustment in unit labour costs, excessive rents persist in NTR sectors, as evidenced by relatively higher unit labour costs in the NTR sectors when using either three of the selected criteria.
NTR sector firms remain more leveraged than those in TR sectors, albeit the significant reduction observed in the overall leverage of the economy, mostly due to recent developments in the construction sector. Accordingly, sectors appear to have a higher ROE relative to NTR ones, independently of the TR/NTR criterion applied. However, the FIPEI criterion additionally points to a same paced improvement in returns for both sectors since 2012, contrastingly to either one of the other two criteria considered, and suggesting more aligned levels of productivity between the two sectors.
Based on these results, we conclude that there are significant gains to be collected from applying TR/NTR enhanced classification systems. We were therefore able to better capture the real adjustment progress in the allocation of resources between the tradable and non-tradable sectors of the Portuguese economy, pointing to a level of adjustment that is higher than that suggested by international institutions. We should, however, note, that the here developed FIPEI criterion yields the upper bound for the impact of the implemented reforms, particularly regarding the allocation of resources between tradable and non-tradable sectors. These findings shall, notwithstanding, guide future policy, hence serving the purpose of the partnership established for this research, between the author and the Strategy and Research Office of the Portuguese Ministry for the Economy.
VII. Bibliography
Amador, João, and Ana Cristina Soares (2012). Competition in the Portuguese Economy:
a view on tradables and non-tradables, Economic Bulletin and Financial Stability Report
Articles
Attewell, J., and S. Crossan (2013). The tradable sector and its relevance to New
Zealand’s GDP. New Zealand Association of Economists Conference, Wellington, New
Zealand.
Bems, Rudolfs (2008). Aggregate investment expenditures on tradable and nontradable
goods. Review of Economic Dynamics 11.4 (2008): 852-883.
Bergthaler, W., Kang, K., Monaghan, D., Liu, Y. (2015). Tackling Small and Medium
Sized Problem Loans in Europe. IMF Staff Discussion Note, Washington DC.
International Monetary Fund.
Cecchetti, Stephen, M.S. Mohanty, and Fabrizio Zampolli (2011). The Real Effects of
Debt. BIS Working Papers No. 352. Basel: Bank for International Settlements.
Costa, Dias e Soeiro (2014). As greves e a austeridade em Portugal: Olhares, expressões
e recomposições, Revista Crítica de Ciências Sociais.
Dixon, H., Griffiths, D. and Lawson, L. (2004). Exploring tradable and non-tradable
inflation in consumer prices. Working Paper, Statistics New Zealand.
Dwyer, Jacqueline (1992). The Tradeable NonTradeable Dichotomy: A Practical
Approach. Australian Economic Papers 31.59 (1992): 443-459.
European Central Bank (2012). Competitiveness and external imbalances within the euro
area, Working Group on Economic Modelling of the European System of Central Banks,
Occasional Paper Series, No 139, December.
European Commission (2014): Quarterly Report on the Euro Area, Vol. 12.
European Commission (2014). The Economic Adjustment Programme for Portugal, Occasional Paper Series No. 2012, Directorate-General for Economic and Financial Affairs Unit Communication and Interinstitutional Relations.
Eurostat (2008). NACE Rev. 2. Statistical Classification of economic activities in the
European Community
Goldstein, Morris, and Lawrence H. Officer (1979). New Measures Of Prices And
Productivity For Tradable And Nontradable Goods. Review of Income and Wealth 25.4
(1979): 413-427.
International Monetary Fund (2009). Balance of Payments Manual, Sixth Edition. Washington, D.C.
International Monetary Fund (2015). Portugal – Selected Issues, IMF Country Report No. 15/127, Washington DC, May.
Instituto Nacional de Estatística (2007). Classificação Portuguesa das Actividades
Económicas Rev.3, Lisboa.
Jensen, J. Bradford, et al. (2005). Tradable services: Understanding the scope and impact
of services offshoring. Brookings Trade Forum. Brookings Institution Press,
Knight, G., & Johnson, L. (1997). Tradables: developing output and price measures for
Australia's tradable and non-tradable sectors.
MacDonald, R., & Ricci, L. A. (2001). PPP and the Balassa Samuelson effect: The role
of the distribution sector (Vol. 442).
OECD (2010) Transfer Pricing Guidelines for Multinational Enterprises and Tax
Administrations.
OECD (2015). OECD Employment Outlook 2015, OECD Publishing, Paris.
Pina, A. and Abreu, I. (2012). Portugal: Rebalancing the Economy and Returning to
Growth Through Job Creation and Better Capital Allocation. OECD Economic
Department Working Papers, No. 994
Reis, R. (2013). The Portuguese Slump and Crash and the Euro Crisis. Brookings Papers on Economic Activity, Spring, 143–193.
Spence, Michael, and Sandile Hlatshwayo (2012). The evolving structure of the American
economy and the employment challenge. Comparative Economic Studies 54.4 (2012):
703-738.
Tressel, Thierry, and Shengzu Wang (2014). Rebalancing in the Euro Area and
X. Appendix
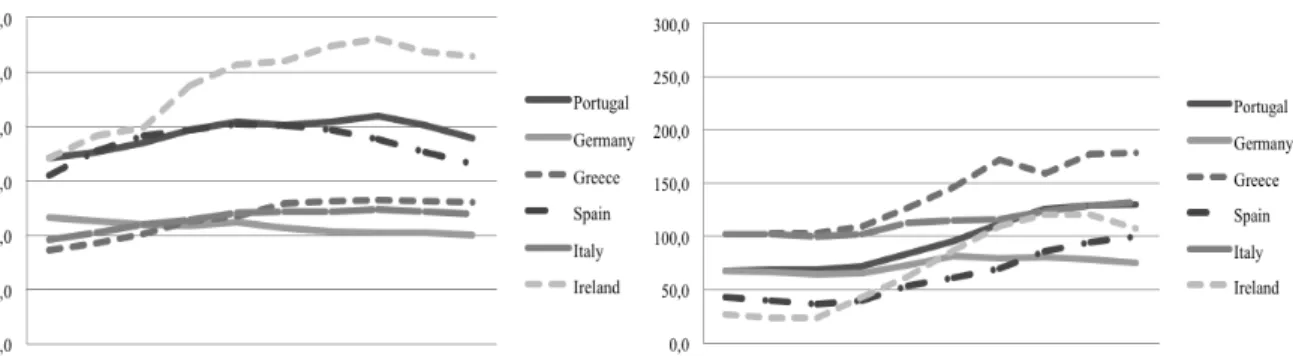
Appendix A: Private and Government Sector Debt, Portugal (2005-2014)
Figure 2: Private Sector Debt, Consolidated (% of GDP) Figure 3: Government Sector Debt Consolidated (% of GDP)
Source: European Commission, Macro Imbalances Procedure, 2015.
Appendix B: Protection of Permanent Workers Against Individual and Collective Dismissals Figure 4. Protection of Permanent Workers Against Individual and Collective Dismissals
Employment Protection Legislation, OECD, 2016)
Appendix C. Data
The modified trade-to-output (henceforth designated as TOR), for which computations and results are presented in section VI, constitutes the main product of this research, since it is the measured upon which industries’ tradability is determined.
Trade (i.e., international transactions) is measured as the sum of exports of goods and services, by type of final product, according to CAE Rev. 3 guidelines (harmonized with NACE Rev. 2). Yearly data for imports and exports of goods by type of good was collected from the INE [INE] (series ‘Exports (€) of goods by Place of destination and Type of good, product by activity (CPA 2008); Monthly’ and Imports (€) of goods by
![Figure 7: Unit Labour Costs (annual average) for the TR [TULC] and NTR [NTULC] sectors, INE](https://thumb-eu.123doks.com/thumbv2/123dok_br/15617529.1054511/23.892.137.795.122.591/figure-unit-labour-costs-annual-average-ntulc-sectors.webp)