Construction of a quality index for granules produced by fluidized bed technology and application of the correspondence analysis as a discriminant procedure
Teresa Albuquerque1, Vitor H. Dias2, Norbert Poellinger3 and João F. Pinto2
1
IPCB – Dep. Engenharia Civil, Escola Superior de Tecnologia, Av. do Empresário, P-6000-767 Castelo Branco, Portugal
2
Dep. Tecnologia Farmacêutica, Faculdade de Farmácia, Universidade de Lisboa, Av. Prof. Gama Pinto, P-1649-003 Lisboa, Portugal
3
Process Technlogy, Glatt GmbH, Werner-Glatt-Str. 1, D-79589 Binzen, Germany
Abstract
The production of granules by wet granulation in a fluidized bed was assessed after the construction of a quality index based on a file of attributes (relevant factors). These attributes are combined by a methodology relying on Correspondence Analysis, as a discriminant procedure, using two extreme simulated active vectors representing, respectively, the best and the worst cases for the granules quality output (“bad” and “good” pole). From those a single continuous synthetic variable – the quality index – can be produced referring to a more significant set of samples. As an example of the methodology the work compares the quality of granules produced at a laboratory scale and a pilot scale. The factors contribution to the bad or good pole allowed the identification of the most relevant factors that affect the quality of the granules. The factors studied, according to a center of gravity design, included formulation (solubility of a drug, different grades of polyvinylpirrolidone, the polarity of the granulation solution) and processing factors (the rate of administration of the granulation solution, the atomizing air pressure and the fluidizing air rate). Granules were evaluated for production yield, drug content, size, densities (true, bulk and tapped), friability, flowability and compressibility. The study has emphasized the differences between the laboratory and pilot scales and the relative importance of each factor for the quality of the granules produced.
Keywords: Correspondence Analysis, Fluidized bed, Granulation, Quality Index, Relevant Factors
1. Introduction
The production of granules by wet granulation remains an import activity in the pharmaceutical industry to minimize several physical and technological related limitations of many drugs. Granulation of powders improves their compressibility and compactibility, promotes a better handling as a consequence of a higher control over the product’s bulk density (even for high drug contents), narrows the size distribution of the particles produced and provides a better control of the drug’s content uniformity at low drug concentrations [1]. It must be pointed out that on top of the mechanical properties mentioned, granules should present other properties with clinical impact (e.g. strength, activity and controlled drug dissolution rate) within tight specifications which can be difficult to achieve. Although continuous efforts have been made to produce tablets by direct compression, wet granulation to produce granules for compression has not been replaced partly because of development cost considerations and tradition and partly because it remains in some cases an attractive technique [2]. These authors have considered both formulation and processing conditions and techniques and evaluated their effect on the properties of the granules produced. Litster et al. [3] claimed that the fluid bed granulation is an
intrinsically robust process with a limited variation in product quality due to the settling of coarse granules which never resurface to reach the binder sprayed in an upper position, thus stopping their growth. The complexity of the process of granulation has been recognized by a few authors. Schepky [4] discussed the design, theory and principles of fluid bed granulators, such as mixing, agglomeration, drying, sieving of the granules, granulation time, reproducibility and scaling up. Kristensen and Schaefer [5] have identified the fundamentals of granule growth that are affected by changes on the methods of granulation and equipment (fluid bed and high shear mixers). In a fluid bed granulation the spreading of the binder liquid droplet in the powder bed is critical, because it is this phenomenon that controls most of the agglomeration. Droplet size of the binder solution contacting the powder bed and humidity in the bed are key parameters. If one manages to understand the coalescence and growth process for the wet granules in terms of process variables upon optimization of the process it will be possible to predict the end point properties of the wet granulation based on a numerical approach using a mechanistic modelling (population balance) of the process of granulation [6, 7]. Boerefijn and Hounslow [1], managed to identify and quantify the dominant mechanisms found in the balance of fluxes of solids and binder, together with heat-transfer and conduction. The understanding of the mechanisms involved in granulation allows for the control of the growth kinetics and ease on scale-up procedures. However, the complexity of fluid bed granulation remains to be interily solved and other approaches based on chemometrics and statistical analysis still play an important role on process understanding.
Scaling up encompasses the use of conservation equations to understand the process of agglomeration because the mass of the starting powder is conserved [6] together with the use of dimensionless numbers, independent of the scale considered (eg. Froude, Reynolds, Power) that ultimately allow the identification of equations promoting a relationship between a set of dependent variables (the properties of the granules) and the independent variables (the processing and formulation components). By opposition to a complete empirical approach, multivariate statistics and chemometrics, on the other hand, can play an important role on scaling up a process. For instance, Faure et al. [2] have described several techniques, namely by monitoring one parameter and relating it backwards to one or more properties, modeling the process using experimental designs (once established the models that can estimate the quality of the granules produced) or modeling the granule’s population balance which require assumptions on the granulation. It follows that, to extract the maximum information from the process of scaling up different experimental designs [8] have been considered upon addressing this type of problems, namely, response surface methodology [9], factorial and multifactorial analysis, factor discriminant analysis, regression models [10]. Some authors [11, 12] recognize that by employing models and simulations in identifying key transformations, linkages between process parameters and the material properties are reconciled in the form of controlling groups.
In a previous work Dias and Pinto [13] have identified the most relevant factors that affect the production of granules in a laboratory scale fluid bed granulator. However, from an industrial perspective it is important to identify changes on the properties of the granules in a process of scaling up.
This work suggests a different approach on the evaluation of the properties of granules produced in a laboratory and pilot scales granulators by the construction of a quality index based on a file of attributes. These attributes are combined by a methodology relying on Correspondence Analysis, as a discriminant procedure, using two extreme simulated active vectors [14].
2. Statistical analysis (Methodology for the ‘Granules Quality Index’, GQI, construction)
The method considered to create a Granules Quality Index (GQI) is based on a multivariate statistical approach. The procedure involves three important steps, namely: (1) selection of the parameters to be included in the index; (2) standardisation of the parameters and (3) the aggregation of the parameters. The type and number of parameters selected depends mainly on the purpose of the index construction and the availability of data.
In the present case the GQI is created to monitor the impact of producing granules with laboratorial and pilot scale equipments on the quality of the granules.
The aggregation of the standardised parameters was developed by Benzécri in the early sixties [15], FCA belongs to a group of factor extraction methods whose main objective is to discover the underlying pattern of relationships within a data set. This is basically done by rearranging the data into a smaller number of uncorrelated “components” or “factors” that are extracted from the data by statistical transformations. Such transformations involve the diagonalisation of the some sort of similarity matrix of the variables, such as a correlation or variance-covariance matrix. Each factor describes a certain amount of the statistical variance of the analysed data and is interpreted according to the intercorrelated variables. The main advantage of FCA is that symmetry is conferred to the data matrix [14], thus permitting the simultaneous study of correlations within and between variables and samples. A detailed discussion of the theory behind FCA goes beyond the scope of this article, but its application in the present case is rather straightforward.
3. Materials and Methods
Drug substances (Table 1) were supplied by Delta Laboratories (Portugal). The excipients considered were lactose monohydrate EP, 200 mesh (Meggle, Germany), polyvinylpirrolidone of different grades (Kollidon 120 mesh K17PF, K25 and K30, BASF, Germany). Ethanol and freshly demineralised water were used in different proportions for the preparation of the solution of granulation.
3.1 Materials
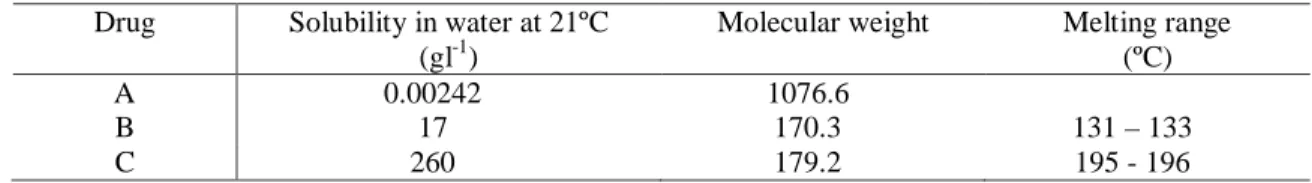
Table 1: Properties of the drugs used in the experiments
A standard formulation containing 1:8:1 parts of drug, lactose and polyvinylpirrolidone dissolved in a mixture of ethanol and water up to 3.85parts. The alcoholic solution was prepared before the polyvinylpirrolidone was added under stirring. Different formulations were prepared according to the experimental design presented in Table 2. Granules were prepared in fluidized bed granulators (UniGlatt and GPCG 15, Glatt Air Techniques, GmbH, Germany) in batches of 1 and 10kg, respectively. The drug and lactose were mixed for 5 minutes. Then granulation started by spraying the granulating solution over the powder for 60 minutes. Both mixing and granulation were carried out at an in let air temperature of 40ºC. Granules were dried at 60ºC for 10 minutes. A typical process chart is shown in Figures 1 and 2.
3.2 Preparation of the granules
Drug Solubility in water at 21ºC
(gl-1)
Molecular weight Melting range
(ºC)
A 0.00242 1076.6
B 17 170.3 131 – 133
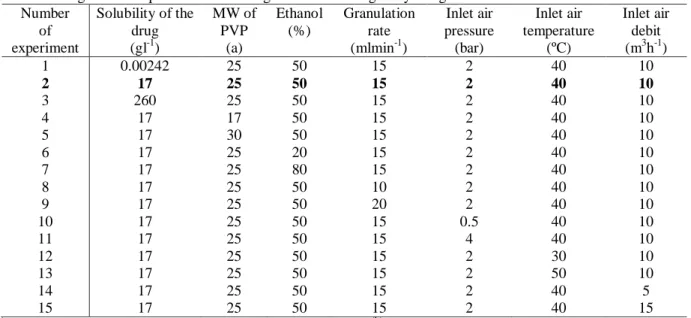
Table 2: Formulation, processing conditions and levels of the variables considered in the experiments
Independent variable Level in the experiments (a)
Solubility of the drug SOL (gl-1) 0.00242 17 260
Average molecular weight of PVP PVP 17 25 30
Granulation solution GS (% of ethanol) 20 50 80
Granulation solution rate GR (mLmin-1) 10 15 20
Atomizing air pressure AP (bar) 0.5 2 5
Inlet air temperature IAT (ºC) 30 40 50
Inlet air rate IAR (m3h-1) 5 10 15
(a)
bold characters represent the values for the center of gravity in the experimental design
0 20 40 60 80 0 20 40 60 80 T emp erat u re (ºC) Time (min)
Figure 1: Variation of the temperature throughout the process
( --- ) Set inlet air temperature, (-□- ) Inlet air temperature, ( -◊- ) Product air temperature, ( -Δ- ) Outlet air temperature
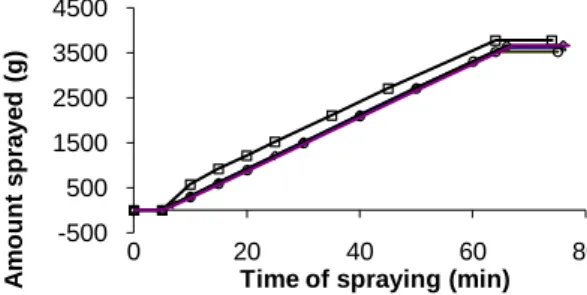
Figure 2: Variation of the amount of granulation rate sprayed over time for different experiments (chosen
randomly)
( -□- ) experiment 1; ( -◊- ) experiment 2; ( -Δ- ) experiment 3; ( -°- ) experiment 14
The yield of the process was found as the percentage of material collected from the container
(PER1). Furthermore, to characterize the process the percentage of granules over 2000µm
diameter (sieving) was determined as an indicator of a non controllable process (PER2). Further characterization of the granule’s size was done by sieving 100g of granules of each batch through a set of sieves in a √2 progression (Retsch, Germany), for 5 minutes. A cumulative percentage undersize plot was constructed and the median (SIZ) and the interquartile range (IQR) were determined. The friability of the granules was determined in an Roche type friabilator (T.A.3, Erweka, Germany) at 25 r.p.m. for 5 minutes, as described by Saleh and Stamm [16]
(FRI). The true density was determined by helium pycnometry (Micromeritics Accupyc 1330,
USA) (TD), whereas the bulk (BD) and tapped (TaD) densities were determined according to the 3.3 Characterization of the granules
European Pharmacopoeia (2008) using a 250 mL graduated cylinder. In order to check a proper drug distribution within the batches, assays (Assay) of each drug in the granules were carried out. Drugs ‘A’ and ‘C’ were quantified by spectrophotometry (Perkin-Elmer spectrophotometer, 550
-500 500 1500 2500 3500 4500 0 20 40 60 80 A mo u n t sp rayed ( g )
SE, USA), whereas drug ‘B’ was determined by potentiometry (Metron potentiometer, Herisau E 576, Switzerland). The flowability of the granules was assessed according to the method described in the European Pharmacopoeia (funnel) [17]. The Carr’s index (CARR) was derived from the experimental values produced by the tests described previously (Table 3).
Table 3: Variables considered as properties of the granules
Percentage of total granules produced PER 1 (%)
Percentage of granules over 2000µm diameter PER 2 (%)
Drug assay (%)
Median granule size SIZ (µm)
Interquartile range IQR (µm)
True density TD (gcm-3)
Bulk density BD (gcm-3
Tapped density TaD (gcm-3)
Carr’s index Carr
Angle of repose AnRep
Flowability FLO (gs-1)
Friability FRI (%)
3.4 Statistical analysis
Experiments were run in triplicate according to a center of gravity design [18]. The formulation and processing conditions considered and the full experimental design are presented in Table 4.
Table 4: Design of the experiments according to the center of gravity design
Number of experiment Solubility of the drug (gl-1) MW of PVP (a) Ethanol (%) Granulation rate (mlmin-1) Inlet air pressure (bar) Inlet air temperature (ºC) Inlet air debit (m3h-1) 1 0.00242 25 50 15 2 40 10 2 17 25 50 15 2 40 10 3 260 25 50 15 2 40 10 4 17 17 50 15 2 40 10 5 17 30 50 15 2 40 10 6 17 25 20 15 2 40 10 7 17 25 80 15 2 40 10 8 17 25 50 10 2 40 10 9 17 25 50 20 2 40 10 10 17 25 50 15 0.5 40 10 11 17 25 50 15 4 40 10 12 17 25 50 15 2 30 10 13 17 25 50 15 2 50 10 14 17 25 50 15 2 40 5 15 17 25 50 15 2 40 15 (a)
average molecular weight of the polyvinylpirrolidone chain; (b) center of gravity experiment
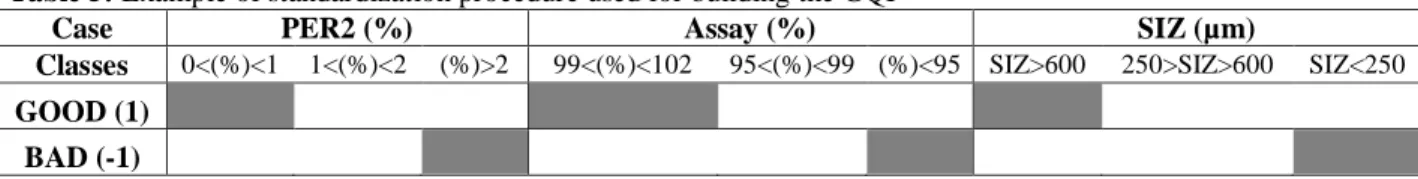
As described before the statistical technique considered [14] subdivides each variable into three classes as exemplified in Table 5. As and example, for variables ‘PER2’,:
The 1st class considered the results between 0 and 1%, the 2nd class, the results between 1% and 2% and the 3rd class the values higher than 2% to the expected result. Similarly, the ‘assay’ and the ‘siz’ and the remaining variables were also grouped into 3 classes; the same principle was applied to ‘Assay’ and ‘SIZ’ in Table 5 and to the other variables;
1) Standardisation of the variables was done by applying a simply binary codification system to the samples: ‘0’ if sample does not belong to class or, ‘1’ if it does;
2) Aggregation of the standardised parameters into the final index value is performed by using a multivariate statistical approach based on the principle of Factorial Correspondence Analysis (FCA).
Table 5: Example of standardization procedure used for building the GQI
Case PER2 (%) Assay (%) SIZ (µm)
Classes 0<(%)<1 1<(%)<2 (%)>2 99<(%)<102 95<(%)<99 (%)<95 SIZ>600 250>SIZ>600 SIZ<250 GOOD (1)
BAD (-1)
The first step involved the definition of two standard granules samples; one of very high and the other of very low quality (Table 5). The high quality standard sample (the ´good´ pole) has ideal values whereas for the low quality sample (the ´bad´ pole) values considered doubled the ones for the high quality standard sample. Following this procedure, each experimental sample result is located in an arbitrary scale defined by these two extreme poles, by the bias of the FCA supplementary projection. The resulting scores correspond to the final index values, which range between ‘-1’ and ‘1’. The new variable obtained by this method is defined as a ‘Regionalized
Variable’ and consequently additive by construction, since the barycentric principle of FCA
guarantees that two samples with given profiles in the variable can be replaced by a new individual, whose profile is given by the coordinates of the centre of gravity of the two original samples [15].
4. Results
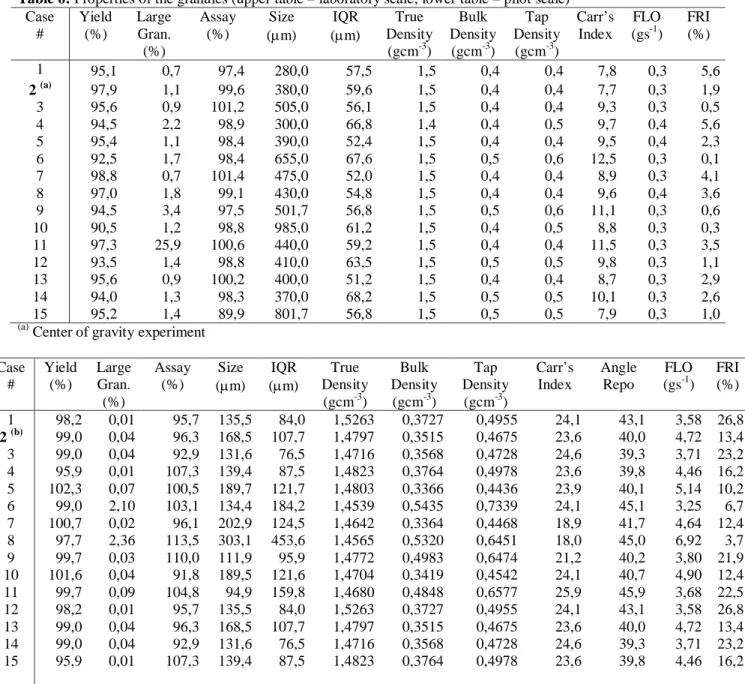
Table 6 summarizes the results (means) of the experiments carried out according to the experimental design in the laboratory scale equipment (upper part) and the pilot scale equipament (lower part). A fine analysis of the results did not show relevant changes within the same equipment or between equipments.
For a better understanding of the gotten results data was grouped in four classes. It’s possible this way to obtain a representation of two extreme classes (best and worse results) and two intermediary classes. Assuming the changeable index values between -1 and 1 the zero is assumed as origin of the referential that will allow us to analyze data quality distribution.
5. Discussion
Although it would be possible to analyze the results variable by variable, allowing the possibility of identifying patterns between the equipments, the full understanding of the work would be lost. Thus, the authors discuss the results on the basis of the groups formed. The experimental data was grouped in four classes. In this way, it was possible to obtain a representation of two extreme classes (best and worse results) and two intermediary classes. Assuming that the values for the index ranged between -1 and 1, the zero is assumed as the origin of the referential that will allow the data quality distribution.
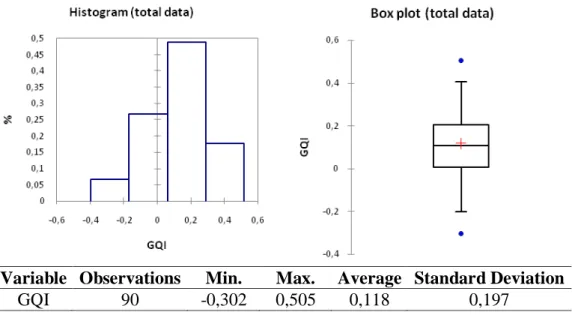
In Figure 3 it can be seen the total data distribution and in Figures 4 and 5, one can observe separately the granules produced by the industrial and laboratorial equipments, respectively. Thus, the overall distribution of the GQI is characterized emphasizing the contributions of the pilot scale equipment versus the laboratory scale one. It is also necessary to understand if the quality of the process (reflected on high values of the GQI) is homogeneously distributed or, if there are tests that generate extreme values (reflected by maximum or minimum values for the
GQI). It follows that, the correct evaluation of the causes of extreme values from the process is, from the standpoint of quality control, very important because it may reflect a deficient operational implementation.
Observing the histograms represented in Figure 4 (GQI for the experiments run in a pilot scale equipment) it is possible to see a clear difference between the data distribution patterns. Furthermore, the data produced from this equipment shows a distribution with and apparent strong asymmetry on the right, by opposition to the data produced from the laboratory scale equipment, which presents an almost symmetrical distribution. However, for the pilot scale data distribution, the histogram shows an “empty” class. This observation is further explained by the observation of its box plot representation (Figure 4, right), where extreme values (marked by blue dots) appear promoting the asymmetry observed in the histogram (Figure 4, left).
Table 6: Properties of the granules (upper table – laboratory scale; lower table – pilot scale)
Case # Yield (%) Large Gran. (%) Assay (%) Size
(µm) (µm) IQR Density True (gcm-3) Bulk Density (gcm-3) Tap Density (gcm-3) Carr’s Index FLO (gs-1) FRI (%) 1 95,1 0,7 97,4 280,0 57,5 1,5 0,4 0,4 7,8 0,3 5,6 2 (a) 97,9 1,1 99,6 380,0 59,6 1,5 0,4 0,4 7,7 0,3 1,9 3 95,6 0,9 101,2 505,0 56,1 1,5 0,4 0,4 9,3 0,3 0,5 4 94,5 2,2 98,9 300,0 66,8 1,4 0,4 0,5 9,7 0,4 5,6 5 95,4 1,1 98,4 390,0 52,4 1,5 0,4 0,4 9,5 0,4 2,3 6 92,5 1,7 98,4 655,0 67,6 1,5 0,5 0,6 12,5 0,3 0,1 7 98,8 0,7 101,4 475,0 52,0 1,5 0,4 0,4 8,9 0,3 4,1 8 97,0 1,8 99,1 430,0 54,8 1,5 0,4 0,4 9,6 0,4 3,6 9 94,5 3,4 97,5 501,7 56,8 1,5 0,5 0,6 11,1 0,3 0,6 10 90,5 1,2 98,8 985,0 61,2 1,5 0,4 0,5 8,8 0,3 0,3 11 97,3 25,9 100,6 440,0 59,2 1,5 0,4 0,4 11,5 0,3 3,5 12 93,5 1,4 98,8 410,0 63,5 1,5 0,5 0,5 9,8 0,3 1,1 13 95,6 0,9 100,2 400,0 51,2 1,5 0,4 0,4 8,7 0,3 2,9 14 94,0 1,3 98,3 370,0 68,2 1,5 0,5 0,5 10,1 0,3 2,6 15 95,2 1,4 89,9 801,7 56,8 1,5 0,5 0,5 7,9 0,3 1,0 (a)
Center of gravity experiment Case # Yield (%) Large Gran. (%) Assay (%) Size
(µm) (µm) IQR Density True (gcm-3) Bulk Density (gcm-3) Tap Density (gcm-3) Carr’s Index Angle Repo FLO (gs-1) FRI (%) 1 98,2 0,01 95,7 135,5 84,0 1,5263 0,3727 0,4955 24,1 43,1 3,58 26,8 2 (b) 99,0 0,04 96,3 168,5 107,7 1,4797 0,3515 0,4675 23,6 40,0 4,72 13,4 3 99,0 0,04 92,9 131,6 76,5 1,4716 0,3568 0,4728 24,6 39,3 3,71 23,2 4 95,9 0,01 107,3 139,4 87,5 1,4823 0,3764 0,4978 23,6 39,8 4,46 16,2 5 102,3 0,07 100,5 189,7 121,7 1,4803 0,3366 0,4436 23,9 40,1 5,14 10,2 6 99,0 2,10 103,1 134,4 184,2 1,4539 0,5435 0,7339 24,1 45,1 3,25 6,7 7 100,7 0,02 96,1 202,9 124,5 1,4642 0,3364 0,4468 18,9 41,7 4,64 12,4 8 97,7 2,36 113,5 303,1 453,6 1,4565 0,5320 0,6451 18,0 45,0 6,92 3,7 9 99,7 0,03 110,0 111,9 95,9 1,4772 0,4983 0,6474 21,2 40,2 3,80 21,9 10 101,6 0,04 91,8 189,5 121,6 1,4704 0,3419 0,4542 24,1 40,7 4,90 12,4 11 99,7 0,09 104,8 94,9 159,8 1,4680 0,4848 0,6577 25,9 45,9 3,68 22,5 12 98,2 0,01 95,7 135,5 84,0 1,5263 0,3727 0,4955 24,1 43,1 3,58 26,8 13 99,0 0,04 96,3 168,5 107,7 1,4797 0,3515 0,4675 23,6 40,0 4,72 13,4 14 99,0 0,04 92,9 131,6 76,5 1,4716 0,3568 0,4728 24,6 39,3 3,71 23,2 15 95,9 0,01 107,3 139,4 87,5 1,4823 0,3764 0,4978 23,6 39,8 4,46 16,2 (a)
Variable Observations Min. Max. Average Standard Deviation
GQI 90 -0,302 0,505 0,118 0,197
Figure 3: GQI distribution – Pilot and Laboratory scale
Variable Observations Min. Max. Average Standard Deviation
GQI 45 -0,099 0,505 0,190 0,190
Figure 4: GQI distribution – Pilot scale
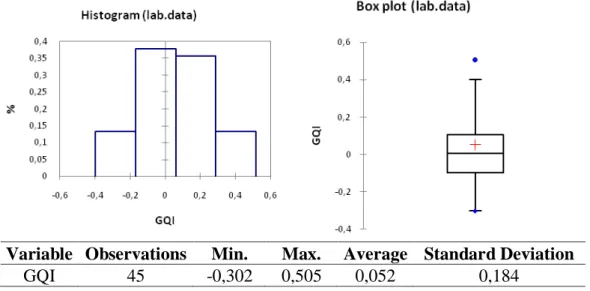
The data produced by the laboratory scale equipment was more homogeneous, where the box plot representations confirm the symmetry of the distribution histogram (Figure 5, right and left). Finally, it should be noted that two main tendencies must be referred:
1) The results obtained with the pilot scale equipment are in frequency of better quality when compared to the ones produced by the laboratory scale equipment (Figures 4 and 5);
2) The extreme values distribution is, however, more favorable when we analyze the laboratory scale data. Two results from the industrial scale equipment are severely anomalous with extreme positive values, which must be carefully controlled and verified in future work (Figures 4 and 5).
Variable Observations Min. Max. Average Standard Deviation
GQI 45 -0,302 0,505 0,052 0,184
Figure 5: GQI distribution – Laboratory scale 6. Conclusions
The study has emphasized the complexity of a process of granulation whereby two different scale equipment produced granules with different properties.
The statistical methodology considered has the advantage of showing the full picture of the process. However it must be pointed out that variables do have different degrees of importance which were not considered in the study. It means that a careful planning of the experiments and future analysis of the variables considered is of paramount importance.
Finally, the study has emphasized the good scalability of both equipments by considering equivalents the results, once the outliers are excluded. This is critical for a company whiling to carry out a process of scaling up a new medicine.
7. Acknowledgements
The authors acknowledge Delta Laboratories, Portugal, for chemicals and technical support and Glatt, GmbH for access to its facilities and equipment.
8. References
1. Boerefijn, R and Hounslow, MJ (2005) Studies of fluid bed granulation in an industrial R&D context. Chemical Engineering Science 60, 3879-3890.
2. Faure, A, York P and Rowe, RC (2001) Process control and scale-up of pharmaceutical wet granulation process: a review. European Journal of Pharmaceutics and Biopharmaceutics 52, 269-277.
3. Litster, JD, Hapgood, KP, Michaels, JN, Sims, A, Roberts, M and Kameneni, SK (2002) Scale-up of mixer granulators for effective liquid distribution, Powder Technology 124, 272-280. 4. Schepky, G (1978) Fluid bed granulation. Acta Pharmaceutica Technologica 24, 185-212.
5. Kristensen, H and Schaefer, T (1987) Granulation: a review of pharmaceutical wet granulation. Drug Development and Industrial Pharmacy 13, 803–872.
6. Cryer, SA (1999) Modeling agglomeration processes in fluid-bed granulation, AIChE. Journal 45, 2069-2078.
7. Cryer, SA and Scherer, PN (2003) Observations and Process Parameter Sensitivities in Fluid-Bed Granulation, AIChE Journal 49, 2802-2809.
8. Paterakis, PG, Korakianiti, ES, Dallas, PP and Rekkas, DM (2002) Evaluation and simultaneous optimization of some pellets characteristics using a 33 factorial design and the desirability function. International Journal of Pharmaceutics 248, 51-60.
9. Iskandarani, B, Shiromani, PK and Clair, JH (2001) Scale-up feasibility in high-shear mixers: determination through statistical procedures. Drug Development and Industrial Pharmacey 27, 651-657.
10. Wehrlé, P, Nobelis, PH, Cuiné, A and Stamm, A (1993) Scaling-up of wet granulation a statistical methodology. Drug Development and Industrial Pharmacy 19, 1983-1997.
11. Mort, PR (2005) Scale-up of binder agglomeration processes. Powder Technology 150, 86-103.
12. Dávid, A, Benkóczy, Z, Ács, A, Greskovits, D and Dávid, AZ (2000) The theoretical basis for scaling-up by the use of the method of microwave granulation. Drug Development and Industrial Pharmacy 26, 943-951.
13. Dias, VH and Pinto, JF (2002) Identification of the most relevant factors that affect and reflect the quality of granules by application of canonical and cluster analysis. Journal of Pharmaceutical Sciences 91, 273-281.
14. Pereira, HG, Brito, MG, Albuquerque T, Ribeiro, J (1993), “Geostatistical estimation of a Summary Recovery Index for Marble Quarries”,.Geostatistics Troia’92, Kluwer Academic Publishers vol. 2, 1029-1040.
15. Benzécri, JP (1977) « L’analyse des correspondences », Les Cahiers de l’Analyse des Données, Vol. II, No 2, pp125-142.
16. Saleh, SI and Stamm, A (1988) Contribution to the preparation of a directly compressible L-ascorbic acid granular form: comparison of granules prepared by three granulations methods and evaluation of their corresponding tablets. STP-Pharma- Pratiques 4,182-187.
17. European Pharmacopoeia (2008) Council of Europe, Strasburg.
18. Podczeck, F (1995) The development and optimization of tablet formulations using mathematical methods. In Alderborn G, Nyströn C (editors). Pharmaceutical Powder Compaction Technology, New York: Marcel Dekker Inc. p 561-593.