i
Internship Report
Master’s in Civil Engineering
Production Monitoring and Performance of Recycled Aggregates from
Construction and Demolition Waste
Kalyan Sagar Rajgopal Reddy
ii This page was intetionally left blank
iii
Internship Report
Masters in Civil Engineering
Production Monitoring and Performance of Recycled Aggregates from
Construction and Demolition Waste
Kalyan Sagar Rajgopal Reddy
Report developed under the academic supervision of Doctor Miguel Filipe Barreto dos Santos, professor at the School of Technology and Management of the Polytechnic Institute of Leiria and Doctor João Paulo Veludo Vieira Pereira, professor at the School of Technology and Management of the Polytechnic Institute of Leiria. Report developed under the company supervision of Engineer Fernando José de Oliveira Matos Romão, CEO of AMBILEI, Valorização e Tratamento de Resíduos Sólidos S.A.
iv This page was intetionally left blank
v
Acknowledgement
I wish to dedicate this report for my parents, my brother, sister and friends for their encouragement in doing my masters. I would like to thank all Professors of Civil Engineering Department of the School of Technology and Management and to all Professors from other Department for the knowledge they have given me throughout my journey in this Institution. I must also thank to the company AMBILEI, Valorização e Tratamento de Resíduos Sólidos S.A. for giving me an opportunity to gain information and knowledge that was important for carrying out my course. I feel happy in thanking Professor Miguel Barreto Santos and Professor João Veludo for willing to clarify any questions or solve any problem that arose in support of this report. I would also like to thank Engineer Vania Marques for her support and guidance in Civil Laboratory of Polytechnic Institute of Leiria.
vi This page was intetionally left blank
vii
Abstract
This internship report is about production, monitoring and performance of recycled aggregates (RA) from construction and demolition wastes (CDW). Use of RA can be useful for environmental protection and economic terms. The focus of this internship was to identify the basic properties of RA produced in the company. Natural aggregates present in the Laboratory of Institute Polytechnic of Leiria are used as reference aggregates. Similarly, the properties of RA concrete were determined and explained here. Concrete is prepared considering natural aggregate concrete as base concrete, RA of 20% and RA of 100%. Basic concrete properties like slump test, compressive strength, Ultrasonic pulse velocity test explained here for different combinations. Use of RA has been found useful for pavement construction. Reasons for use of RA in pavement construction, with experimental results are explained here in detail.
Keywords: Construction and demolition waste, Recycled Aggregates, Natural Aggregates, Concrete, Pavement
viii This page was intetionally left blank
ix
Acronyms
RA- Recycled Aggregates NA- Natural Aggregates
CDW- Construction and Demolition Waste RMA – Recycled Masonry Aggregate
LNEC – Laboratório Nacional de Engenharia Civil (National Laboratory of Civil Engineer) BS EN – British Standard European Norm
CO2 – Carbon dioxide
CBR – California Bearing Ratio W/C – Water Cement Ratio
x This page was intetionally left blank
xi
List of Figures
Figure 1.1 - Process of recycled aggregate ... 2
Figure 1.2 Procees of Recycled aggregates ... 6
Figure 1.3 Flow chart indicating the processing methods and layout in the Ambilei. ... 6
Figure 2.1 General layout sequence of the CDW recycling plant (Coelho & Brito, 2013) ... 12
Figure 3.1- Washed aggregate (left) and sieving machine (right). ... 24
Figure 3.2 Fines- Sand equivalent test ... 28
Figure 3. 3 Methylene Blue test ... 30
Figure 3.4 Los Angeles Abrasion test ... 31
Figure 3.5 CBR and proctor test ... 33
Figure 3.6 container filled with the aggregate for determining loose density and voids ... 34
Figure 3.7 Drying of aggregates in ventilated oven. ... 35
Figure 3. 8 Particle density and water absorption ... 37
Figure 3. 9 The Cumulative % passing of NA ... 41
Figure 3.10 The slump of the mixed concrete. ... 47
Figure 3.11 Compressive strength of concrete ... 50
Figure 4. 1 Sieve analysis of aggregates ... 53
Figure 4. 2 Proctor value. ... 57
Figure 4. 3 The bulk density of RA and NA ... 59
Figure 4. 4 The % of voids volume of RA and NA. ... 59
Figure 4. 5 The % of water absorption of RA and NA. ... 60
Figure 4. 6 The slump value of NA, RA-20, RA-100... 62
Figure 4. 7 Represents the ultra-sonic pulse velocity of NA, RA-20, RA-100. ... 63
xii This page was intetionally left blank
xiii
List of Tables
Table 2.1 Hand operated tools use in demolition´s (Lamond et al.,2002). ... 13
Table 2.2 Mechanical methods of demolition (Hendrics and pieterson, 2000). ... 13
Table 2.3 Thermal cutting equipment (Hendrics & Pieterson, 2000) ... 14
Table 2.4 Habitats and environmental impacts (Coelho & Brito, 2013). ... 20
Table 3.1 Assumed standard deviation Values (IS 456, 2000). ... 38
Table 3.2 Indicating the values of cement content and w/c ratio (IS 456, 2000) ... 39
Table 3.3 Maximum water content values (IS 456, 2000) ... 39
Table 3.4 Indicating the w/c ratio based on various zones (IS 456, 2000) ... 40
Table 3. 5 Denotes the Final concrete mix Proportion ... 40
Table 3. 6 Indicating the sieve analysis and fineness modulus of NA for mix design ... 41
Table 3. 6 Cement dosage based on various size of aggregates. ... 42
Table 3.7 Represents values of A and B. ... 43
Table 3.8 Values denoting volume of voids based on ACI. ... 43
Table 3.9 Represents the value of K and K’. ... 44
Table 3. 10 Denotes the value of ‘a’ ... 45
Table 4. 1 Specification limits values for sand equivalent (Nikolaides et al., 2007) ... 55
Table 4. 2 Specification limits values for Methylene blue test (Nikolaides et al., 2007) ... 55
Table 4. 3 Indicating the limiting values for the use of material. ... 56
Table 4. 4 The general soil type and CBR limit values ... 58
Table 4. 5 The oven dry and saturated surface dry density values of RA and NA ... 60
Table 4. 6 Results of hardened concrete value. ... 62
Table A.1 Calculation of Sieve analysis of recycled and natural aggregate. ... 71
Table A. 2 Calculation of flakiness index of RA. ... 71
Table A. 3 calculation for Elongation of aggregates ... 72
Table A. 4 values of sand equivalent of fine aggregates ... 72
Table A. 5 Standard proctor test value... 72
Table A. 6 The soaking value of mould in CBR test ... 73
Table A. 7 The penetration value after soaking ... 73
Table A. 9 Bulk density of natural aggregates ... 74
xiv
Table A. 10 water content of recycled aggregate drying in a ventilated oven ... 76 Table A. 11 Tabulation of particle density and water absorption using pycnometer for recycled and natural aggregates ... 76 Table A. 12 Calculation on slump cone test of fresh concrete ... 77 Table A. 13 Compressive strength and ultrasonic velocity of hardened concrete ... 77
xv This page was intetionally left blank
xvi
Table of Contents
Acknowledgement ... v Abstract ... vii Acronyms ... ix List of Figures ... xiList of Tables ... xiii
1 Introduction ... 1 1.1 Preamble ... 1 1.2 Objective ... 1 1.3 Methodology ... 3 1.4 Internship overview ... 4 1.4.1 About company... 4
1.4.2 Sources and production of RA in the company ... 5
1.5 Report organization ... 7
2 Literature Review... 9
2.1 Production of recycled aggregates ... 9
2.1.1 Compositions of Construction & Demolition waste... 9
2.1.2 Recycling Plant and equipment ... 10
2.1.3 Quality of RA ... 14
2.1.4 Standards and Specifications for the use of RA ... 15
2.2 Properties of RA ... 16
2.2.1 Density ... 16
2.2.2 water absorption ... 16
2.2.3 Size and Shape ... 17
2.2.4 Contaminants ... 17
xvii
2.3.1 Experience in road base ... 18
2.3.2 Experience in concrete ... 18
2.4 Environmental and Economic impact ... 19
2.4.1 Environmental impact... 19
2.4.2 Economic impacts... 20
3 - Development of experimental work ... 21
3.1 Introduction ... 21 3.2 Materials ... 21 3.3 Geometrical Characterization ... 22 3.3.1 Sieve analysis ... 22 3.3.2 Flakiness Index ... 23 3.3.3 Elongation Index... 26
3.3.4 Assessment of Fines- Sand equivalent test ... 27
3.3.5 Assessment of fines- Methylene Blue test ... 29
3.4 Mechanical properties of aggregates ... 30
3.4.1 Determination of resistance of fragmentation – Los Angeles ... 30
3.4.2 Standard test method for CBR (California Bearing Ratio method) and Proctor test for soil compaction ... 30
3.5 Physical Properties ... 32
3.5.1 Determination of Loose bulk density and Voids ... 32
3.5.2 Determination of water content by drying in a ventilated oven ... 33
3.5.3 Determination of Particle density and water absorption ... 35
3.6 Study of concrete with recycled aggregates ... 37
3.6.1 Mix design (Faury and Indian method) ... 37
3.6.2 Mix preparation ... 46
3.6.3 Testing Procedure ... 46
xviii
3.6.3.2 Compressive strength test………. ………..47
3.6.3.3Ultra-sonic pulse velocity……….………49
4 Results and discussion ... 51
4.1 Geometrical Properties ………. 51
4.2 Mechanical Properties ………...54
4.3 Physical Properties ……….56
4.4 Concrete Properties………59
5 Conclusion and Future work ... 63
References ………...65
1
1 – Introduction
1.1 Preamble
This report describes all the work of research, experimentation, analysis and evaluation that was made during the period of internship in company Ambilei (Valorização e Tratamento de Resíduos Sólidos S.A.) about production monitoring and characterization of developed recycled aggregates (RA) from construction and demolition waste (CDW).
Since it was decided to make a study based on the materials that are produced in the company. Company produce three types of RA that are mainly based on ceramic, stone, concrete materials and other RA based on retention and RA based on bituminous mixture. During the period of work, it was essential to know the usage of RA produced based on ceramic, stone and concrete mixture that are obtained from CDW. Related to this field of work some relevant scientific studies are made gathering the ideas of other authors concerning to this work.
Large quantity of RA is being produced every year throughout the world. The use of RA is gaining a potential nowadays, because the concrete industry is coming under intense scrutiny and criticism due to increase in our environmental consciousness. Waste concrete can be produced in number of different sources, the most common are CDW. The RA processed in Ambilei is majorly of these CDW. Most of the research works are being processed considering the coarse RA once rather than the fine RA, since the fine leaves a large amount of cement paste adhered to the surface during the process of crushing.
1.2 Objective
This document includes a study related to recycled aggregates (RA) from construction and demolition waste (CDW), produced in Ambilei. The studies on the use of RA have been going on for past years, since the utilization of RA seems to be one of the solutions to the waste material problem.
Therefore, it was decided to make an internship related to characterization of the material produced in the company, production monitoring and products quality criteria, assessment of
2
the applicability of company aggregates, particularly in concrete and pavements. This part of work is important to the company since the production of RA have implemented a control system that aims to ensure in obtaining of CE marking, fulfilling the technical specifications for the purpose for which they are intended. Thus, it was important in knowing the behaviour of material that fit either to the concrete works or as a material for the road base. It was also decided to appreciate the environmental and economic impact due to the use of RA from CDW. Some studies concerning to the recent development and field of application of these materials was analysed.
According with internship program, in first stage it was necessary to follow the source of the material extracted and monitor the manufacturing process of the several RA. This was important in understanding the type of materials dumped in company. During this period, a knowledge about different component of materials used in recycling has been gained, later it was important to study and analyse with the company about quality criteria and the minimum requirements requested for the recycled aggregates produced. The example of process of the aggregate in the company Ambilei is shown in Figure 1.1.
Figure 1.1 - Process of recycled aggregate
Second stage was fulfilled with transporting equipment’s. In this stage it was verified the vehicles that are helpful for transporting to the destination place and functioning of various crushing machines used in the company. While the process is carried out by the machines the separation of material has been observed.
3
In third stage, it was important to know the characterization of RA according to geometrical, physical and mechanical properties. It was decided to perform the most relevant laboratory tests to aggregates as, test sieve; particle density and water absorption; bulk density and voids; water content; Los Angeles abrasion; density and others. Characterization tests were performed in Laboratory of Civil Department in School of Technology and Management (ESTG) of Polytechnic Institute of Leiria (IPLeiria). After obtaining the test results, some comparison are made with concern to the natural aggregates (NA) and it was investigated the behaviour of concrete with incorporation of RA studied.
Summarizing, the main objective of the work is study concerning production monitoring and characterization of developed RA from CDW and also, study the possibility to use company RA in concrete and road pavements. The main stages of work can be resumed as:
1. Studying the geometrical, physical, mechanical properties of RA that explains the main characteristic behaviour of the material;
2. Based on the test results it can be examined the possibilities of using RA in concrete mixes or as a pavement to the road;
3. The mix design has been calculated initially for the reference concrete and later to concrete with company RA;
4. To investigate some fresh and hardness properties of concrete with RA.
1.3 Methodology
The internship plan contemplated the following tasks, developed during the same period: Task 1: Production monitoring and products quality criteria: The first method that must be followed is knowing the source of the supply of materials to the company which means knowing briefly by collecting the information concerning to the source of waste generated to the company.
Task 2: Physical and mechanical characterization of the developed recycled aggregates: After the process of recycling it’s essential to know the characteristic of aggregates. It was important to bring samples of the RA from Ambilei to IPLeiria labs for the experimental tests. Since the sample has been brought directly from the site it contains various particles. Before conducting the tests cleaning, washing and drying of the sample has done for some of
4
the tests. Several tests are conducted based on European Standard (EN) which relates to the characterisation of aggregate as:
- Geometrical properties: Sieve analysis, Flakiness Index, Elongation Index, Fine Sand Equivalent test, Fine Methylene blue test.
- Mechanical Properties: Determination of resistance to Fragmentation.
- Physical Properties: Determination of loose bulk density & voids, Determination of Water content by drying in ventilated oven, Determination of Particle density and water absorption.
Task 3: Mix design and behaviour of concrete with incorporation of recycled aggregates: Preparing the reference concrete with proper mix design to produce later concrete block is prepared using RA. Conducting several tests to know the behaviour of produced concrete like, slump test, compressive strength, ultra-sound velocity. Summary and conclusions based on the test results obtained.
1.4 Internship overview
1.4.1 About company
Ambilei is a 12 years old company in production of RA. It was established in 2006 but started its activity from 2009 as an intend of assuring its clients the quality of its service and the correct management of the waste. At the beginning Ambilei is committed in giving CDW as a second chance but now the focus of the company is related in producing aggregates using this CDW.
Name of the company Ambilei
Address Rua da calmeira, no 60, Andrinos, Apartado 2875, 2401-901, Leiria
Tel 244892236
Fax 244092892
5
1.4.2 Sources and production of RA in the company
There are three stages of processing the materials in the company namely: reception, sorting and recovery of the waste. The CDW are carried out from site to the storage area using some of the transporting vehicles. The waste is discharged into the storage area and then subjected to sorting, which results in the separation of inert residues (eg. bricks, tiles, concrete and ceramic materials).
The company has four stages in processing material, at the beginning stage it aims in dumping of material from the site to the plant using some of the load carrying vehicles namely trucks as shown in Figure 1.2 (a). Later the material is being sorted separating the inert residues and building materials i.e., CDW as shown in Figure 1.2 (d). After the material is separated since the CDW contains dust the materials are being washed to reduce dust pollution during processing as shown in Figure 1.2 (b). In the very next stage the washed CDW is carried out for the process of crushing using some mechanical machines namely JCB and transformed to the crushing machines for the process as shown in Figure 1.2 (c).
6
c) Recycling of material to obtain various sized aggregate d) separated plastic, wood and scrap Figure 1.2 Procees of Recycled aggregates
The process of production is briefly detailed using the flowchart mentioned in Figure 1.3.
Figure 1.3 Flow chart indicating the processing methods and layout in the Ambilei.
Waste Reception
Visual Inspection
Conformity of Accompany Guide in Waste?
Weighing (Gross Weight)
Download in the Zone Waste Storage
Waste Sorting Waste materials ceramic, stone and concrete Recycled Aggregates material base ceramic, stone and concrete Concrete waste
Recycled Aggregates with a concrete base Waste mixtures bituminous s / tar Recycled Aggregates based on mixtures bituminous Clean Lands Paper/card Metal Plastic Glass Scrap Weighing (Net Weight)
Weighing Guide and Certificate of Receipt of Waste
Discharge Rejection
8
1.5 Report organization
The presentation of the work is organized in five chapters. The following distributions are made:
Chapter 1 – In this chapter introduction to the internship work is made. It is described the aim, objective and methodology of work. This chapter also gives a brief explanation concerning to the establishment, processing method and essential information related to Ambilei company.
Chapter 2 – Several researchers have their own processed work related to RA. In this chapter is presented reference works related to the use of RA. The most important conclusion of such authors have been gathered and selective information that helps to this work are mentioned. Finally, it explains about the environmental impact and also the cost of production.
Chapter 3 - This chapter describes the testing and experimental results that are obtained in laboratory of IPLeiria. This chapter also analyse and discuss characterization of developed RA according to results obtained in physical, mechanical and geometrical test.Results were measured with European Standard limits and been analysed possibility to incorporate RA (from Ambilei) in concrete or in basis road pavement. Further this chapter mentions the results and discussion related to the experimental use of RA in concrete with comparison to a concrete developed by only addition of NA.
Chapter 4- Contains the test results and discussion related to those tests. Chapter 5 - Contains the conclusion and future work.
10
2 Literature Review
In this chapter it was essential and important to make the review of literature of several authors regarding CDW and the use of RA. Further this chapter gives an discussion of various aspects like recycling plant and equipment used during the process, quality criteria of the produced product, standards and specifications used for several test methods and later some observations related to properties of produced RA are being described in further work.
2.1 Production of recycled aggregates
2.1.1 Compositions of Construction & Demolition Waste
With the studies concerning to the waste generated in Portugal has been categorised into Municipal Solid Waste (MSW), and Construction Demolition Waste (CDW), in which MSW generates about 4,550,000 ton/year waste, where CDW production rises to 6,440,000 ton/year waste. This means that, at least in terms of quantity, CDW is a greater problem than MSW (Coelho & Brito, 2010).
Concerning CDW composition, generally it is divided into five main fractions; metal, concrete and mineral, wood, miscellaneous and unsorted mixed fraction. It may contain: concrete, bricks, tiles and ceramics, wood, glass, plastic, bituminous mixtures and tars, metals (ferrous & non-ferrous), soils and stones, insulation materials, chemicals, waste electronic and electrical equipment, packaging materials, hazardous substances (Pellegrino & Faleschini, 2016)
The composition of CDW generally varies highly in relation to the site, because of the local typology and construction technique, climatic conditions, economic activities and technologic development of an area. The composition of CDW is also changing during time, due to ageing of the existing buildings and hence it is difficult to define a composition representative for a large region (Pellegrino & Faleschini, 2016).
11
2.1.2 Recycling Plant and equipment
There are two types of recycling plants as stationary and mobile. Stationary plants have capacity of 100-350 ton/h usually adopt higher level of technologies and are typically provided with the sorting equipment for the separation of unwanted fractions (Serdar et al., 2017).
In general, they are suitable in high density areas, capable of producing a high quality of product. However, the initial investment of setting such a plant can be in excess. Mobile plants of which capacities are up to 100 ton/h treat smaller quantities of CDW in temporary demolition worksites, and typically produce low grade recycling aggregates by in-situ recycling. They are economically feasible and there are limited cleaning facilities in this type of installation, and therefore the recycled product is normally of low quality (Kumbhar et al., 2013).
Based on the studies concerning to the CDW recycling is highly mechanized facility, capable of receiving a complete mixture of CDW and separating all the main valuable/marketable constituents and rejecting only dangerous materials and wet sludge carrying ultra-fine mixed particles. A general flow diagram, studied by the authors, is represented in Figure 2.1. Each piece of equipment was characterized according to its power, initial cost, maintenance cost, average service life, plus environmental factors such as intrinsic primary energy and carbon which are relevant for other parts of the overall study (Coelho & Brito, 2013).
There are several demolition techniques and concrete removal methods. They may be classified as manual or mechanical methods, thermal cutting and mechanical cutting. Manual labour- based demolition is still being used in some countries where labour is cheaper than the cost of buying demolition equipment’s. These has been used often after first and second world war. Some of the hand operated tools are being mentioned below in the Table 2.1. (Lamond, et al., 2002).
12
13
Table 2.1 Hand operated tools use in demolition´s (Lamond et al.,2002).
Hand tools Hammers, chisels, drills may be used for
removing small amount of materials
Manual electric tools These have lower energy output, and mostly
used in confined areas
Manual hydraulic tools Small impact hammers, drills, saws and
grinders
Manual pneumatic tools Pavement breakers available in a wide range
of sizes
Mechanical demolition methods are normally associated with the heavy demolition of large facilities. To demolish a structure impact, crushing or shear-based methods are used. Table 2.2 represents some of those equipment’s that are used as a mechanical operated equipment’s (Hendrics & Pietersen, 2000).
Table 2.2 Mechanical methods of demolition (Hendrics and pieterson, 2000).
Impact breakers and hammers
These are used commonly in demolition industry. For underwater work pneumatic and hydraulic breakers are used
Spring-action hammers These are used to break concrete pavements,
decks, walls, and other thin members
Mechanical splitters This equipment is placed on pre-drilled
holes
Concrete crushers
These have a wide range of sizes and cutting jaw configurations. These can remove kerbs, slabs, beams and wall sections
The object may be divided into smaller parts by creating narrow slots, like we can consider that iron and steel are cut by heating them to high temperatures to initiate combustion and then maintaining it. Some of the thermal cutting tools are described below in the table 2.3 (Hendrics & Pietersen, 2000).
14
Table 2.3 Thermal cutting equipment (Hendrics & Pieterson, 2000)
Cutting torch
These tools work on oxygen and fuel gas. The gases are obtained from high-pressure cylinders.
Powder cutting torch These torches have three intakes: oxygen,
fuel gas and pressurized air.
Powder cutting lance
This unit has connections for oxygen and the powdered air mixture. They are used for steel and other metals
Electrical heating This method is used to separate concrete
from around its steel reinforcements
2.1.3 Quality of RA
As we consider the use of recycled aggregates in construction it has high potential for reuse and recycling of CDW since most of its components have a high resource value. The reuse market for RA derived from CDW is especially adequate in landscaping, road construction (unbound sub-base and base layers, bituminous surface pavements), increase the thickness of concrete elements (Silva et al., 2014).
Recycled Masonry Aggregate (RMA) in general contains masonry rubble and is a collective designation for various mineral building materials resulting from the construction and demolition of structures. This family of materials may include lightweight concrete blocks, ceramic bricks, blast-furnace slag bricks and blocks. Masonry rubble often contains mortar rendering and burnt clay materials such as roofing tiles (Hansen 1992 cited in Silva et al, 2014). RMA typically have a higher porosity than NA, because concrete with RA absorbs a higher amount of moisture than ordinary concrete (Hendriks & Pieterson, 1998).
The RA by comparison with NA have lower particle density and higher water absorption this is because that there is tendency of RA mixes to require more mixing water than the NA mixes. The relatively high-water demand of RA will have their impact on shrinkage. When comparing aggregates of similar size, the RA have lower bulk density than the NA. this is due to more porous nature and sharper shape of RA (Hansen 1992 cited in Silva et al, 2014). Quality management is a crucial step towards increasing the confidence in the CDW. Some of the following factors influence the quality management of these materials that includes:
15
1. Quality of primary process: Quality management at this process has high end application and in large volumes, since it contains various materials like unbound RA, asbestos, and some of the recovered plastics and wood.
2. Quality management at waste identification, source separation and collection stages: Quality control during pre – demolition and demolition should be taken seriously, in terms of CDW materials, because if hazardous substances are not removed properly entire waste streams can get contaminated.
3. Quality management during CDW transport: CDW should be transported safely and legally without causing any harm to the environment or risking workers health.
4. Quality management during CDW processing and treatment: The recycling company ensures good quality of input materials and elimination of hazardous substances and impurities during the treatment process.
5. Quality of products and product standards: CDW recycled materials must be assessed in accordance with requirements of European product standards when covered by them.
2.1.4 Standards and Specifications for the use of RA
In Portugal, the use of RA for structural purposes is regulated by specification LNEC E 471 (2009) from Nacional Laboratory of Civil Engineering (LNEC). This specification classifies coarse RA and defines minimum requirements for their use in concrete. Various other standards exist about the use of RA for several applications. LNEC E 472 focuses on hot mix asphalt applications, LNEC E 473 is about unbound pavement layers, and LNEC E 474 is about embankment and capping layer of transport infrastructures (LNEC E 471, 2009).
The British Standard European Norm (BS EN) classifies the various aggregates based on their sites of application, according to BS EN 13242 standard. This specification classifies aggregates for unbound RA in pipe bedding drainage, granular fill and general fill capping and for the sub base. BS EN 12620 standard specifies RA for concrete and BS EN 13043 standard specifies general use of aggregates for bituminous mixtures and surface treatments for roads, airfields and other trafficked areas.
16
2.2 Properties of RA
Characterization of aggregates can be observed based on the properties with respect to the geometrical, physical and mechanical. Further it has been discussed about general behaviour of RA based on density, water absorption, size, shape.
2.2.1 Density
The simplest and most common way to characterize the aggregate is normal weight, light weight and high weight. RA also belongs to this characterization group. Several parameters can be identified that can affect RA density. Since mortar is less dense than NA, the more adhered cement paste in coarse RA the lower the density of the aggregates. Another aspect of recycling procedure is the existence and quality of sorting techniques. Recycling plant separate the major part of light contaminants.
Some researchers, who examined the effects of the number of crush stages on the properties of coarse RA, found that the higher the levels, the higher the density of the resulting RA due to the cumulative breaking up of adhered cement paste on the surface of coarse RCA (Silva, et al., 2014).
An increase in a share of recycled aggregate in total mass of component aggregate reduces the bulk density of fresh concrete (Pani & Concu, 2011).
2.2.2 Water absorption
Water absorption of RA differs most from the aggregate obtained from natural resources. It is because that the older cement material adhered to the aggregates. According to all the research available states that the recycled concrete aggregate has higher water absorption level compared to that of NA. The reason for that is original cement mortar, which is integral part of recycled aggregate, which has significantly more porous structure compared to natural aggregates, its porosity depends on the water-cement ratio of the old concrete. Smaller the fraction, greater the amount of cement mortar as well as the level of water absorption (Marinkovic et al., 2009).
17
2.2.3 Size and Shape
Size and shape of the resulting aggregates are influenced by the number of processing stages and type of crushing devices used to break down into larger pieces. In the process of recycling normally uses primary and secondary crushing stages. In the primary crushing stage jaw crushers are used that provide the best grain-size distribution of RA for concrete production. To obtain round and less sharp particles second crushing is done (Ferreira et al., 2011).
Cone and impact crushers are used as secondary crushers, as cone crushers have 200 mm maximum size and give a spherical shape to RA. To produce good quality coarse aggregates, it can be done by simply adjusting the setting of crusher aperture (Hansen, 1992 cited in silva et al, 2014).
2.2.4 Contaminants
After the demolition of existing structure that severely degrade the strength of concrete variety of contaminants can be found in RA. These materials include asphalt, gypsum, metals, plastic and other contaminants.
Bituminous materials have a general effect of reducing strength, depending on their construction application. In a report related to Hansen states that the addition of 30% by volume of asphalt reduced 30% of compressive strength (Hansen, 1992 cited in silva et al, 2014).
In most of the parts of Europe, glass is removed from buildings and has given the recycling efforts. The sorting of material is vital because glass is brittle and ends up with fine content during crushing in recycling plants. In some of the proposed amendment to EN 12620 and other specifications glass content is specified not to exceed 1% by mass (EN 12620, 2002) Wood and plastic are difficult to separate from CDW during process of crushing. These materials can be separated using air blowers. And can also be separated by hand from a conveyor belt moving between the primary and secondary crushing. Wood and plastic that float in water are classified as floating non-stone material.
18
2.3 Use of RA in construction
CDW constitute a major portion of total solid waste production in the world. Some studies have estimated that up to 90% of demolition waste going to the landfills can be recycled and reused as a concrete or as a road base material and other civil construction works. There is high potential for recycling and re-use of CDW, as few components have high resource value. In general, there is a re-use market for aggregate derived from CDW in roads, drainage and other construction projects (Herrador et al., 2012).
2.3.1 Experience in road base
Worldwide many studies are being conducted to know the possibility of using recycled CDW. Research focus mainly on the use of RA of concrete and RA of ceramic bricks in the construction of lower layers of roadways (Vivian et al., 2018).
In some European countries, the use of RA of concrete has been used since 1970s and in the Netherlands, the use of recycled aggregate coming from concrete and bricks as a road base is a common practice (Herrador et al., 2012).
Arisha & Gabr (2018) evaluated the use of CDW materials, particularly mixture of aggregates of recycled concrete with recycled crushed bricks as unbound granular material for road construction in Egypt. They discovered that the recycled unbound granular material showed better pavement performance in terms of rutting and fatigue cracking as compared to virgin aggregate.
Diagne et al. (2015) made an investigation on using mixture of RA of concrete with recycled crushed bricks as unbound base course in pavement construction. The authors used various proportions of RA of concrete and RA of bricks in their experiments.
2.3.2 Experience in concrete
RA can be designed for concrete mixes in the same way as used for NA, considering the extra water absorption in the former material that determines the unit water content (Akash et al.,
19
2007). According to RILEM (1994), there are some of the salient features that are recommended for proportioning of recycled aggregate concrete (RAC):
when designing a concrete mix using RA of varying quality, a higher standard deviation should be employed to determine target mean strength;
when coarse RA is used with natural sand, at the design stage it may be assumed that the free W/C ratio required for certain compressive strength will be same for coarse RA as for conventional concrete.
for a RA mix to achieve same slump, the free water content will be approximately 5% more than for conventional concrete.
The sand-to-aggregate ratio for coarse RA is the same as when using NA.
The use of RA as concrete in construction work is a subject of high priority in building industry throughout the world. 10% of used aggregates in Great Britain are RAC, 78000 tons of RAC were in Holland in 1994. The rapid development in research on the use of RAC to produce new concrete has also led to the production of concrete of high strength performance. It is noted that use of coarse RAC upto 30% is normally recommended (Oikonomou, 2005).
2.4 Environmental and economic impact
Large variety of aggregate sources are available including quarries, alluvial such as gravel and river sands, or recycled aggregates from different commercial and industrial waste materials mainly CDW. The extraction of these virgin natural resources and crushing them in quarries to produce aggregates is hugely damaging the environment by depletion of natural resources (SICEST, 2016).
2.4.1 Environmental impact
Recovering and recycling CDW have four highly important benefits considering reduced use of natural resources, reduced transportation, reduced consumption of energy and reduced CDW volume sent to land-fill.
Coelho & de Brito (2013) made an analysis on environmental sensitivity of CDW recycling plant in Lisbon area, Portugal. The installation factors include incorporated, operation and transport, which then converts into energy use and carbon dioxide emissions. In the work that
20
conducted authors observed that environmental benefits of installing such a recycling plant are substantial, the process involved in recycling and using recycled materials from this plant in construction applications generated nearly 90% less carbon dioxide (CO2) emission than
using natural resources. Table 2.4 describes the positive environmental impacts on RA using. Table 2.4 Habitats and environmental impacts (Coelho & Brito, 2013).
Habitats Impacts
Reduced use of natural resources Less damage to habitat and less visual damage
Reduced transportation of natural resources
Reduced greenhouse gas emission, pollution emissions, less use of fossil fuel resources
Reduced energy consumption Greenhouse gas emission, pollution emission
reduces, less fossil fuel resources
There are some of the energy related costs involved in the manufacturing process of RA which involves the aggregate washing which may involve amounts of to remove contaminants which will not be disposed properly and may pollute the groundwater. Considering all these aspects CDW recycling operations are likely to generate some of the main environmental impacts that includes (Coelho & de Brito, 2013):
Visual and aesthetic impacts of recycling plant and the loss of natural features and habitats;
During the storage, processing and transportation of materials the dust that has been produced;
Some of the transportation impacts like road delay, poorer safety;
Noise, vibration, gas emission and odour derived from processing operation and transportation vehicles.
So considering above all factors it is essential to produce and process the RA either during the transportation of material, during the process and some other environmental issues has to be considered during procedure.
2.4.2 Economic impacts
Söderholm (2011) made an analysis on the efficiency of environmentally motivated taxes on virgin raw materials. Author analyzed both the economic-theoretical foundations of virgin natural resource taxation, as well as the empirical experiences of aggregates taxes in three
21
European countries, i.e., taxes on, for instance, gravel, rock, stone etc. The theoretical analyses showed that taxing natural resource output or use typically represents a ‘second-best’ policy alternative, which could be used when, for instance, the monitoring of non-point source emissions and/or efficient property rights regimes are hard to implement. The empirical analysis shows that low own-price elasticities typically lead to low aggregate demand responses and limited substitution to alternative (recycled) materials.
Tam (2008) carried out a detailed comparative analysis of the costs and benefits of conventional practice of CDW disposal relative to a recycling approach. In that study, conventional practice means that CDW are dumped in landfills and concrete is produced with natural resources (energy is wasted in both the disposal of CDW and the production of NA for concrete manufacture). The proposed recycling method consisted of sending CDW to processing plants (i.e. reduced NA extraction- related energy and amount of landfilled materials) the result of which would be used in concrete production. After having conducted detailed interviews with the staff of various construction and demolition companies, recycling plants and landfills, the results showed that the recycling method had a positive net benefit of nearly € 20 million per year, while the conventional method had a negative net benefit of about $44 million per year.
22
3 - Development of experimental work
3.1 Introduction
Ambilei produce and market RA of extensive granulometry and clean lands. They offer three types of RA: RA based on ceramics, stone and concrete materials, RA based on retention, RA based on bituminous mixture. But in this work, it was essential to know the properties of RA based on ceramic, stone and concrete materials produced in the company. Hence it was important to know properties of RA in accordance with the laboratory results that are obtained to compare with the NA. Chapter 3 describes and explain several tests that have been conducted. To characterize aggregates, it was studied the geometrical behaviour of aggregate like sieve analysis, flakiness index, elongation index, assessment of fines - sand equivalent and methylene blue test. Some physical properties were also analysed as bulk density, water content, determination of voids, particle density and water absorption, along with some mechanical properties consists of Los Angeles abrasion test, California bearing resistance (CBR), standard proctor test. All RA results are compared and discussed taking into account NA results and main properties. Results are discussed in chapter 4.
3.2 Materials
RA used in the experimental study are obtained from the Ambilei, and it is mostly used in the road base. The set of RAs consists mainly of: ceramics of 20%, concrete material of 40% and rest stone materials.
Maximum size of RA used in the study are 31.5 mm. The natural aggregate used in the experiment is obtained from the laboratory of IPLeiria with three various samples of size 22.4 mm with Di/di dimension as 5.6/22.4 (of coarse aggregate), 8 mm with 4/11.2 (of medium sized), fine aggregate of size lesser than 4 mm with 0/2. It was used cement CEM I 52.5 R to concrete mix. Reference for testing of the aggregates is based on several European standards that are described under for individual tests.
23
3.3 Geometrical Characterization
3.3.1 Sieve analysis
This test has been performed based on the European standard (BS EN 933-1) that describes the distribution of aggregate based on the size. This analysis is important and useful that gives the cumulative percentage by weight of the total sample.
Principle: The test consists of dividing and separating a material into several particle size
classifications of decreasing sizes by means of a series of sieves.
Apparatus: Test sieves, tightly fitting pan and lid for the sieves, ventilated oven, washing
equipment, trays, brushes, sieving machine.
Procedure: It describes the performance of laboratory work conducted in which various
steps are being performed like separation of the aggregate, washing and finally sieving the sample. Below it describes the detailing of the test conducted.
(1) Washing
Initially the sample has been weighed as M1 that is required for the test which is described
based on the standard, later the test portion is placed in a container, further it is continued by washing the sample until the water passing the 0.063mm test sieve is clear as represented in left side of Figure 3.1 (this is important in order to remove the adhered particle stuck to the aggregate). Drying of the residue has been done by placing in a ventilated oven that is retained on the 0.063 mm sieve to constant mass.
(2) Sieving
The sample is taken out after drying it in ventilated oven for ± 24 hours and the weight of sample is recorded as M2. The sample is poured into the sieving column. The column
comprises several sieves fitted together and arranged from top to bottom in order of decreasing aperture sizes considering the main series of sieves (31.5, 22.4, 16, 11.2, 8, 5.6, 4, 2, 1, 0.5, 0.25, 0.125, 0.063 mm) with the pan and lid.
24
The column is being mechanically shaken as represented at the right side of the figure 3.1. Then sieves are removed one by one commencing with the largest aperture size opening. Each sieve is manually shaken ensuring no material is lost.
(3) Weighing
The retained material for the sieve with the largest aperture size is weighed and its mass is recorded consequently as R1, R2…….Rn. Finally, the weight of screened material if any
remaining in the pan is recorded as P.
Finally, the calculation is carried out with respect to the cumulative % passed and cumulative % retained and graph is being obtained with respect to sieve number in X- axis and cumulative % passed in the Y-axis.
Figure 3.1- Washed aggregate (left) and sieving machine (right).
3.3.2 Flakiness Index
This test is used to determine the particle shape of the aggregate and each particle being preferred under specific condition like particle size depends on the shape. BS EN 933-3 describes the reference method, used for type testing and in case of dispute, for the determination of the flakiness index of the aggregates.
25
Principle: The test consists of two sieving operations. First using test sieves, the sample is
separated into various particle fractions di/Di, each of the particle size fractions di/Di is then
sieved using bar sieves which have parallel slots of width Di/2. Apparatus:
- Test sieves, with square aperture, conforming with the following aperture sizes; 100, 80, 63, 50, 40, 31.5, 25, 20, 16, 12.5, 10, 8, 6.3, 5.4.
- Corresponding bar sieves, comprising parallel cylindrical bars conforming to; 80/100, 63/80, 50/63, 40/50, 31.5/40, 25/31.5, 20/25, 16/20, 12.5/16, 10/12.5, 8/10, 6.3/8, 5/6.3, 4/5.
- Balance or scale
Procedure: The sample of aggregate is weighed based on the specifications, and later the test
has been performed in two sieves, below it has been detailed about the procedure of two sieves.
(1) Sieving on test sieves
Initially the particles are separated and discarded all particle passing the 4-mm sieve and retained on the 100-mm sieve.
The weight of the particles is taken in each particle size fraction di/Di. (2) Sieving on bar sieves
Sieving is done based on each particle size fraction di/Di on the corresponding bar sieves.
This sieving operation is carried out manually and separated. Finally, the particles are weighed considering the material from each particle size fraction passing through the corresponding bar sieve.
Calculation:
𝐹1 = (𝑀2𝑀1) ∗ 100 Equation 1
Where,
26
M2 = Sum of the masses of the particles in each particle size fraction passing the corresponding bar sieve
Validation of results: If the sum of the masses R1 together with the masses of any discarded
particles and any size fractions that are not tested differ by more than 1 % from the mass M0 the test shall be repeated using another test portion. In the test that has been conducted obtains the following result.
100 ∗𝑚0{£𝑅1+£(𝑑𝑖𝑠𝑐𝑎𝑟𝑑𝑒𝑑 𝑚𝑎𝑠𝑠𝑒𝑠)}𝑀0 100 ∗5000{2920+2028}5000 = 1 < 1%
3.3.3 Elongation Index
This test has been conducted to know the shape index of the particle either cubical or non-cubical, which corresponds to the further improvement of the work to be done. BS EN 933-4 describes the method used for type testing and in cases of dispute, for the determination of the shape index of coarse aggregates.
Principle: Individual particles in a sample of coarse aggregate are classified based on the
ratio of their length L to the thickness E using a side gauge where necessary. The shape index is calculated as the mass of particles with a ratio of dimensions L/E more than 3 expressed as a percentage of the total dry mass of particles tested.
Apparatus: Particle slide gauge, Test sieves, Tightly fitting pan and lid, Balances or scales,
Trays.
Procedure: The particles are initially separated by sieving in accordance with EN 933-1.
Later the particles smaller than di and any larger than Di are discarded. The mass is recorded for the particle size fraction di/Di that is to be tested.
Later the length (L) and the thickness (E) of each particle is assessed using the particle slide gauge. The classification of cubical and non-cubical particles is set aside as those particles which have a dimensional ratio L/E > 3 is being classified as non-cubical and mass of those particles is taken as M2 and the remaining particles are being considered as cubical with mass
M1 as mentioned in the data obtained in Table A.3 of annex A.
27
3.3.4 Assessment of Fines- Sand equivalent test
This test is conducted to describe the equivalent value to the relative amount, fineness and clay like material present in the specimen of test. The European Standard (BS EN 933-8) specifies a method for the determination of the sand equivalent value of the 0/2 mm fraction in fine aggregates.
Principle: The sand equivalent value is calculated as the height of sediment expressed as a
percentage of the total height of the flocculated material in the cylinder.
Apparatus: Two graduated cylinders, Test plunger assembly, stop clock, 500 mm scale, test
sieve, sieve brush, Spatula, washing tube, Flask, Rubber, Funnel, Shaking machine, Thermometer, balance, Filter paper.
Procedure: Sample of 200 gram for each cylinder is to be sieve using the sieves of 0/2 mm
to obtain the fine sample. Siphon washing solution is added to each cylinder up to the mark on the graduated cylinders.
Using the funnel, the test portion is to be poured into each cylinder and the bottom of the cylinder is tapped several times to remove the air bubbles. Each cylinder is left for 10 min to soak as mentioned in the Figure 3.2 After 10 min of soaking one of the cylinders is been sealed using the rubber cork and fixed onto the shaking machine for around 30 secs as shown in the figure after the first cylinder is shaken well it is been replaced by the second cylinder. When the both cylinders are shaken well now the rubber corks are removed, and the cylinders are washed ensuring all material is returned to the cylinder. The washing is done throughout the cylinders locating no particles are stuck to the glass. By leaving each cylinder to settle, without disturbance for 20 min at the end of the period the height h1 of the upper level is
measured using rule. Now the plunger is slowly lowered inside until the end piece rests on the sediment which is been determined as height h2 as mentioned in the Figure 4.2
28
a) filling of aggregate b)) settlement of sample at the bottom of the cylinder
c) shaking the sample d) measurement of settled sample. Figure 3.2 Fines- Sand equivalent test
Calculation:Sand Equivalent Value (SE)- The average of two test specimens is given as,
SE =
100 ∗ (
ℎ2ℎ1
)
Equation 2SE= 54.61 ~55
Validation of results: After calculating the ratio (h2/h1) *100 for each cylinder to one decimal
place. If the values differ by more than 4 the test procedure shall be repeated. In the test that has been conducted details the value which is equal to 55.03-54.19 = 0.84 which is less than 4.
29
3.3.5 Assessment of fines- Methylene Blue test
This test is used to determine the harmful and non-harmful material of the fine aggregate. European Standard (BS EN 933-9) describes the reference method used for type testing and in cases of dispute for the determination of methylene blue value of 0/2 mm fraction in fine aggregates.
Principle: Increment of a solution of methylene blue are added to a suspension of the test
portion in water. The adsorption of dye solution by the test portion is checked after each addition of solution.
Apparatus: Burette, filter paper, glass rod, balance, stopwatch, test sieve, beaker, flask.
Procedure: This procedure contains three steps for the determination of fineness of the
aggregate, in the beginning the stain is to be prepared, later the suspension is to be set, finally the dye adsorbed is determined.
The sample is prepared by sieving the sample of 200 grams as mentioned in the standards. Place 500 ml of distilled water in the beaker and test portion is added and it is stirred well with the spatula. Then the beaker is placed upon the agitator to a speed of 600 min-1 and by starting the agitator the sample inside the beaker is stirred. Later by placing the filter paper for every 5 min of agitating the sample is dropped on the filter paper.
The stain test consists of taking a drop of suspension in the glass rod and depositing it on the filter paper. The stain is determined when the deposit that expands is generally solid blue colour, surrounded by a colourless wet zone and the test is continued till the wet zone surrounding consists of a light blue ring as represented in figure 3.3.
30
a) sample on the agitator with the dye solution in the beaker
b) the adsorbent of the dye solution at volume of 30 ml. Figure 3. 3 Methylene Blue test
3.4 Mechanical properties of aggregates
It has been absorbed in the above tests that describes the shape, size which relates to the geometrical properties of the aggregates. In the further test it is concerned with the physical and mechanical characterization of the aggregate that corresponds to the Los Angeles test, Standard proctor and CBR test which denotes the mechanical characterization of the aggregate.
3.4.1 Determination of resistance of fragmentation – Los
Angeles
This test is used to indicate aggregate toughness and abrasion characteristics (BS EN 1097 – 2). The Los Angeles test used for type testing in case of dispute for determining the resistance to fragmentation of coarse aggregate and aggregates for railway ballast.
Principle: A sample of aggregates is rolled with steel balls in a rotating drum. After rolling is
31
Apparatus: Test sieves, balance, Los Angeles test machine, hollow drum, ball load, motor,
tray.
Procedure: Initially the test sample must be prepared by taking 15 kgs. of particles that
passing the 14-mm test sieve and retained on the 10-mm test sieve. The grading of the sample has been divided into following test portion by considering 60 or70 % passing 12.5 mm sieve, and remaining sample of 30 or 40 % passing 11.2 mm sieve.
The collected sample is carried to the Los Angeles machine, initially the drum is being cleaned before loading the sample, after that sample is poured inside and drop the 10 balls into it later cover has been placed and machine is being started by setting 500 rotations at a constant speed between 31 and 33 min-1 as shown in the Figure 3.4. Finally, after 500 rotations the sample has been removed out into a tray locating no loss of any material inside the drum. Then the retained sample is sieved using 1.6 mm sieve.
Calculation: Later the calculation is carried out as shown below.
31 r/min with 500 rotations LA = (5000-3000)/50 = 40
a) Setting of the machine b) aggregate inside the machine after 500 rotations. Figure 3.4 Los Angeles Abrasion test
3.4.2 Standard test method for CBR (California Bearing
Ratio method) and Proctor test for soil compaction
32
ASTM 1883 – 07 method gives the determination of California Bearing Ratio of a compacted soil. The main factor of this test is to determine the required thickness of flexible pavements for roads. In other words, strength of a subgrade, subbase and base course materials are expressed in terms of their California Bearing Ratio (CBR) value.
Apparatus: Test sieves; Cylindrical metal mould, a steel rod; A steel straight hedge, spatula,
Filter papers; Base plate, dial gauge, surcharge discs.
Sample preparation: Proctor test and CBR test is carried out on material passing the 20 mm
test sieve. So initially the materials are sieved accordingly and weighed before preparing the sample. As per the standards (LNEC E 197-1996) it states that if the fraction of sample is greater than 25 % retained on 20 mm sieve then the test is not applicable.
Procedure:
Step 1 – Initially sample has placed on a large pan, later water is added beginning from 6 %
to the total weight of the sample. Sample is mixed well using spatula so that water should get mixed up with each material of sample.
Step 2 – Now sample has been placed in the mould considering three layers. For every
individual layer 25 number of blows has been applied using the machine as shown in the left of figure 4.5
Step 3 – Again sample has been removed from the mould and water of addition 2% is added
and the above step has been repeated.
Step 4 – Addition of water is carried out till the value get increased at one point and
gradually start decreasing the value as shown in the table of annex A.
Step 5 – Now to conduct the CBR test, same amount of sample is used with the appropriate
percentage of water obtained in proctor test. Finally, the same procedure is repeated as mentioned in step 2 and 3
Step 6 – Again after placing the sample in the mould a solid baseplate has been used, and
collar is fitted to the other end of the mould.
Step 7 - The mould assembly is being placed in the empty soaking tank, and the filter paper
is placed on top of the sample followed by a plate. Dial gauge is mounted on the top of the extension collar.
33
Step 8 – Soaking tank is filled with water just below the top of the mould extension collar.
Reading has been recorded.
Step 9 – Now after recording the readings, the dial gauge and all the accessories are removed.
Finally, the sample is tested in the soaked condition as shown in the right of figure 3.5
(a) compaction of sample (b) CBR test of soaked sample Figure 3.5 CBR and proctor test
3.5 Physical Properties
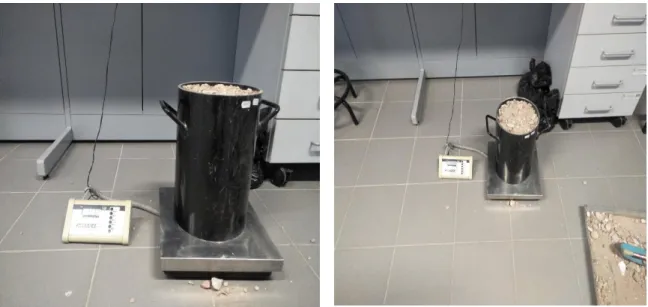
3.5.1 Determination of Loose bulk density and Voids
Test describes a practical way of determining the bulk density and unit weight on undistributed sample. European standard BS EN 1097-2 specifies the test procedure for the determination of the loose bulk density of dry aggregate. The test is applicable to natural and recycled aggregates up to the maximum size of 63 mm.
Principle: The dry mass of aggregates filling a specified container is determined by weighing
and the corresponding loose bulk density is calculated. The percentage of voids is calculated from the loose bulk density and the particle density.
34
Apparatus: Cylindrical container, balance, scoops.
Procedure: The container is placed on the balance and the empty weight is taken as M1.
Then the aggregate is dropped inside the container using the scoop resting it at the height more than 50 mm above the rim of the container.
The sample is filled until the top of the container and excess aggregate is removed using any flat scale or wooden piece and the weight of the container along with the sample is taken as M2 as shown in Figure 3.6. Then the aggregate is dropped out into the tray and the three test
specimens are carried out with the same process and the readings of those are taken as shown in the Figure 3.6.
Figure 3.6 container filled with the aggregate for determining loose density and voids
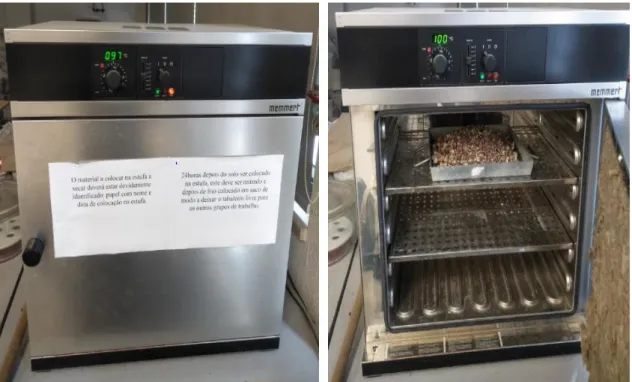
3.5.2 Determination of water content by drying in a
ventilated oven
This test is performed to determine the amount of water present in a soil expressed as a percentage of mass of dry soil. European Standard (BS EN 1097-5) describes the determination of water content of aggregates by drying in a ventilated oven.
Principle: The oven-drying method provides a measure of the total free water present in a
portion of aggregate. The water can be from the surface of the aggregate and from water accessible pores within the aggregate particles. The water content is determined as the
35
difference in mass between the wet and dry mass and is expressed as percentage of the dry mass of the test portion.
Apparatus: Container, heat resistant stirrer, balance, ventilated drying oven, trays.
Procedure: Clean and dry trays to contain the test portion during drying is taken. Mass of the
trays are taken as M2. Sample of all in all aggregates are taken to determine the moist present
in it and the sample is poured into the tray, mass of the sample along with tray is taken as M0.
The mass of sample is determined by subtracting M2 with M0.
The sample is later placed in the ventilated oven at constant temperature as set for around 24 hours as shown in the (Figure 3.7). Later the mass of the dry sample is taken as M3. In this
test three sample of the aggregates are taken and test has been conducted, finally the calculations are carried out.
Figure 3.7 Drying of aggregates in ventilated oven.
3.5.3 Determination of Particle density and water
absorption
BS EN 1097-6 test gives an expression to know the bulk density of particles corresponding to their size fraction as in this test it is considered particles that are passing 31.5 mm test sieve
36
and retained on 4 mm as coarse ones, and particles that are passing 4 mm sieve and retained on 0.063 mm of recycled aggregates are being considered. This test is used for the determination of particle density and water absorption of normal weight and lightweight aggregates.
Principle: Particle density is calculated from the ratio of mass to volume. The mass is
determined by weighing the test portion in a saturated and surface- dried condition and again the oven-dried condition.
Apparatus: Ventilated oven, balance, thermometer, test sieves, trays, dry soft absorbent
cloths, Pycnometer.
Procedure: This test is carried out for two different sample one with the aggregate particle
passing the 31.5 mm test sieve and retained on 4 mm test sieve, one more with aggregate particle passing the 4-mm test sieve and retained on 0.063 mm test sieve. The sieved sample is immersed in the pycnometer and entrapped air bubbles are gently removed in a tipped position. Place the sample in the water for around 24 hours later, measure the temperature of water using thermometer as shown in Figure 4.7. At this movement the Pycnometer is again filled with water till the mark and the temperature of water is again taken, the weight of the filled Pycnometer is taken as M2. the aggregate is removed from the water and dried for few
minutes by pressing the coarse aggregate using dry soft absorbent cloth and for further drying both the samples are placed in the ventilated oven for few more minutes. Then water is poured again in Pycnometer and the weight is taken as M2.
Finally, the saturated and surface dried test portion is taken from the oven and weight of the aggregate is taken as M1. At the last stage all masses of the test portion are taken as M4 and