Universidade de Lisboa
Faculdade de Ciências
Departamento de Biologia Animal
A comparative study of the thermal
tolerance of tadpoles of Iberian
anurans
Helder Santos Duarte
Mestrado em Biologia da Conservação
2011
i
Universidade de Lisboa
Faculdade de Ciências
Departamento de Biologia Animal
A comparative study of the thermal tolerance
of tadpoles of Iberian anurans
Helder Santos Duarte
Mestrado em Biologia da Conservação
2011
Dissertação orientada por
Prof. Dr. José Pedro Sousa do Amaral
e
Prof. Dr. Rui Rebelo
Departamento de Biologia Animal, Faculdade de Ciências, Universidade
de Lisboa
ii ABSTRACT
The study of climate change and its impacts on biodiversity is essential for a correct and responsible assessment of population declines and potential extinction risks. Being the most threatened group of vertebrates, amphibians are being put on the edge mainly by habitat destruction and emerging infectious diseases, and possibly even more so with the added effects of global warming. We suggested that populations of anurans on latitudinal extremes of their Iberian geographic distribution would have differential responses to heat stress, whether by phylogenetic inertia or by physiological adaptation of individuals. We tested for this prediction by measuring the Critical Thermal maxima (CTmax) of 15 anuran species from the Iberian Peninsula. In seven of these species, we studied populations from the northern and southern extremes of their distributions. CTmax of Iberian anurans defined thermally distinct groups that reflect their thermal ecology and breeding phenologies. CTmax ranges show an association to geographic distribution range in the majority of species. Upper thermal tolerances did not exhibit a phylogenetic pattern and revealed to be a conservative character within species. There was no latitudinal trend that distinguished northern from southern populations except for Hyla arborea, showing a limited plasticity or capacity for physiological adaptation. Iberian tadpoles would be in high risk of extinction according to predictions that maximum pond temperatures could surpass the upper thermal limits of all of the analyzed species.
Keywords: Anurans; Iberian Peninsula; CTmax; Climate Change; Phylogenetic inertia; Physiological adaptation.
iii RESUMO
Este projecto teve como objectivo estudar a tolerância fisiológica de larvas de anuros da Península Ibérica ao stress induzido por temperaturas elevadas. Comparando populações dos extremos setentrional e meridional das espécies ibéricas foi possível testar hipóteses de adaptação na capacidade de resposta das mesmas a alterações nos padrões climáticos actuais, e também avaliar a variabilidade associada a essa resposta. A temperatura afecta todas as reacções físico-químicas, processos fisiológicos e interacções ecológicas dos seres vivos. Por esta razão, prevê-se que as variações térmicas associadas ao aquecimento global terão impactos vários na ecologia de espécies e comunidades. Sendo assim, seria esperado que os organismos em maior risco de extinção, devido a uma rápida mudança das condições climáticas, seriam aqueles que apresentam tanto uma capacidade de aclimatização limitada como uma vagilidade reduzida. Consequentemente, teriam também uma capacidade limitada para evitar condições novas e desfavoráveis à sua sobrevivência. Os seres ectotérmicos compreendem a grande maioria da biodiversidade terrestre e estão especialmente vulneráveis ao aquecimento global. Isto é devido ao facto de que a fisiologia, desenvolvimento e comportamentos destes seres vivos dependem fortemente da temperatura ambiental, e se os seus limites térmicos são ultrapassados as suas funções ecológicas serão comprometidas.
Procurámos analisar duas hipóteses que permitem explicar a evolução de parâmetros térmicos fisiológicos. Em primeiro lugar, a inércia filogenética sugere que os caracteres térmicos são evolutivamente conservadores e não apresentam variação entre taxa próximos filogeneticamente. Neste caso, os taxa mais aparentados entre si, partilhando um ambiente comum, apresentariam fisiologias térmicas semelhantes partilhando desta forma uma ecologia parecida. Populações que vivam em ambientes diferentes, em contrapartida, teriam comportamentos de termorregulação diferentes, ou seriam capazes de tolerar temperaturas sub-óptimas para poder satisfazer as suas necessidades fisiológicas, que seguiriam sendo semelhantes entre elas, por partilha de um ancestral comum recente. Por outro lado temos a hipótese da adaptação fisiológica que sugere que as características térmicas de uma espécie são evolutivamente plásticas, sendo capazes de se adaptarem às condições do ambiente local através de pressão selectiva. Esta hipótese propõe que um animal ectotérmico mantém a sua temperatura corporal dentro de limites óptimos, ajustando-os de acordo com o seu
iv
habitat. Logo, espécies aparentadas ocupando habitats diferentes podem ter comportamentos de termorregulação semelhantes pois estariam a funcionar nos seus próprios óptimos térmicos. E da mesma forma, espécies menos aparentadas partilhando ambientes semelhantes convergiriam as suas preferências térmicas com o tempo.
Sendo o grupo de vertebrados mais ameaçado, os anfíbios são o modelo ideal para avaliar os efeitos das alterações climáticas uma vez que, por serem ectotérmicos, são altamente sensíveis a potenciais efeitos de um aumento significativo de temperatura. Decidimos focar-nos na fase larvar destes animais por tratar-se de um estado de desenvolvimento confinado ao ambiente aquático, e com possibilidades limitadas de termorregulação comparado com o estado juvenil ou adulto.
No total estudámos 15 espécies de anuros da Península Ibérica abarcando todos os géneros de anuros desta zona, nomeadamente: Alytes cisternasii, Alytes obstetricans, Alytes dickhilleni, Alytes maurus, Alytes muletensis, Discoglossus galganoi, Bufo bufo, Epidalea calamita, Hyla arborea, Hyla meridionalis, Pelobates cultripes, Pelophylax perezi, Pelodytes punctatus, Rana iberica e Rana temporaria. E, para analisar a variabilidade das tolerâncias térmicas entre populações nos extremos da distribuição geográfica de anuros ibéricos, foram recolhidos indivíduos de habitats setentrionais ‘frios’ e de habitats meridionais ‘quentes’ de sete espécies: Alytes cisternasii, Alytes dickhilleni, Pelobates cultripes, Epidalea calamita, Hyla arborea, Hyla meridionalis e Rana iberica.
A amostragem foi realizada ao longo de toda a extensão da Península Ibérica. A captura de girinos cobriu charcas desde o norte de Espanha (Somiedo, Astúrias) a uma latitude de 43º N, até ao Norte de Marrocos, a uma latitude de 35º N, incluindo também uma espécie norte-africana com uma ecologia térmica tipicamente mediterrânea, como é o caso de Alytes maurus. E tendo uma extensão longitudinal desde as Lagoas da Verdizela a 9º W até à Font des Moritx na ilha de Mallorca, a 2º E, onde se podem encontrar indivíduos de Alytes muletensis. O período de captura decorreu desde Fevereiro de 2007 a Maio de 2008 abarcando desta forma as épocas de reprodução de todas as espécies analisadas.
Para testar as tolerâncias térmicas, ou Críticos Térmicos máximos (CTmax), utilizámos um método dinâmico de subida de temperatura. Os ovos e girinos capturados foram criados em cativeiro até atingirem o estado de Gosner 25, para garantir que todos os indivíduos são testados numa mesma fase de desenvolvimento.
v
Todos os girinos testados foram previamente aclimatados a 10° C durante pelo menos 4 dias e mantidos individualmente em recipientes de plástico, com um fotoperíodo de LD 12:12 e alimentadas ad libitum. O aparelho consistiu de um banho-maria sobre uma placa térmica e agitador magnético criando uma taxa fixa de aquecimento de 1° C.min-1, e uma agitação de 700 rpm para manter a temperatura da água homogénea. O recipiente de teste era de vidro transparente e estava suportado por uma base de plástico que permitia a rotação de um íman dentro de água. Para melhor visualização dos espasmos musculares da boca e do corpo utilizámos um espelho na base do recipiente.
Uma vez que os valores de um dado carácter num estudo comparativo são influenciados por partilharem uma ancestralidade comum, à partida, as espécies não podem ser consideradas como dados independentes. Para determinar se a fisiologia de uma espécie em particular é influenciada pela sua filogenia, fizemos um teste de independência filogenética do CTmax com o programa ‘Phylogenetic Independence 2.0’ sobre uma árvore previamente publicada em que a topologia foi aleatoriamente rodada 10000 vezes para construir a hipótese nula. A tolerância térmica não demonstrou seguir um padrão filogenético, no entanto revelou-se ser um carácter conservador dentro de cada espécie.
Os CTmax de anuros ibéricos definiram grupos termicamente distintos que reflectem as suas ecologias térmicas e fenologias reprodutivas, enquanto que a amplitude dos valores de CTmax de cada espécie revelam uma associação com as distribuições geográficas da maioria das espécies. Espécies com uma distribuição geográfica vasta apresentam nichos ecológicos mais amplos, uma alta capacidade de enfrentar condições climáticas novas, o que implica que têm uma maior plasticidade fisiológica e tolerância ambiental do que taxa com distribuições geográficas restringidas. Outra teoria sugere que o facto de uma espécie apresentar uma fisiologia térmica ampla determina a evolução de uma ampla distribuição geográfica.
Vários estudos demonstraram que as tolerâncias térmicas máximas de diferentes espécies ectotérmicas estão correlacionadas com as temperaturas dos microhabitats aos quais estão expostos ao longo de um gradiente latitudinal, como por exemplo caranguejos, bivalves, lagartos e anfíbios. No entanto, também existe informação sobre espécies ectotérmicas que não seguem gradientes latitudinais ou altitudinais nos seus CTmax. Neste caso a estimação da temperatura operativa a que os animais estão expostos é menos fiável, uma vez que os dados utilizados nestes trabalhos constavam
vi
de estimas anuais de temperaturas do ar, que não variam significativamente com a latitude. Neste estudo pudemos ver que, na Península Ibérica, apesar de termos amostrado populações de latitudes claramente distintas, não houve diferenças significativas nas tolerâncias térmicas entre os extremos geográficos das espécies analisadas, excepto no caso da Hyla arborea. Este facto sugere que não há suficiente capacidade de adaptação fisiológica nestas espécies de anuros.
Um estudo recente que inclui informação de temperaturas máximas de charcas na Península Ibérica dá-nos uma ideia geral dos extremos térmicos a que estão expostas as larvas de anuros. A média das temperaturas máximas da amostra deste estudo é de 28.7 ± 1.2° C, e uma temperatura máxima absoluta de 35.5° C. Se, de acordo com as previsões, se dá uma subida térmica global de 4° C os girinos das espécies ibéricas de anuros poderão ser expostos a temperaturas na ordem dos 39.5° C, e de acordo com os nossos resultados, serão ultrapassados os limites de tolerância térmica das espécies ibéricas que estudámos, estando assim em alto risco de extinção no decorrer deste século.
Palavras-Chave: Anuros; Península Ibérica; CTmax; Alterações climáticas; Inércia filogenética; Adaptação fisiológica.
vii INDEX
Introduction …..……….……….……. 1
Materials and Methods ……….………..………. 3
Results ……….………..……….. 7 Interspecific comparisons ……….…….. 7 Intraspecific comparisons ……….…….. 10 Discussion ………...……… 11 Acknowledgements ………..………..…… 13 References ………..………..…….. 14
1 Introduction
All physical-chemical reactions, physiological processes (Hutchison & Dupré, 1992; Hochochka & Somero, 2002), as well as ecological interactions (Dunson & Travis, 1991) are strongly affected by temperature. For this reason it is predicted that temperature variations linked to global climate change will have far-reaching effects on the ecology of species and communities (Southward et al., 1995; Pearson & Dawson 2003; Case et al., 2005).
It could be predicted that organisms at a higher risk of extinction due to a fast climate change would be those with both a limited capacity for acclimation and reduced vagility. These organisms would consequently have a lesser ability to avoid new unfavourable environmental conditions. Ectotherms comprise the large majority of terrestrial biodiversity and they may be especially vulnerable to global warming (Tracy, 1975, 1976, 1979; Parmesan, 2006). This could be because their physiology, development and behaviour are strictly dependent on environmental temperature, and that their ecological functions are compromised if they surpass their thermal tolerances (Hillman et al., 2009).
In the Iberian Peninsula the increase in maximum temperatures will exceed 4° C and annual run-off water will decrease from 23 to 30% by the end of the 21st century (Alcamo et al, 2007). The decrease in water availability will have a significant impact on amphibian reproductive cycles (Araújo et al., 2006) since their larvae are limited to water environments. Tewksbury et al. (2008) stated that herpetofaunal diversity from temperated environments could suffer less with increasing temperatures than tropical species, yet possibly some species may indeed benefit in terms of thermal physiological optimum. To further understand how rising temperatures are affecting these organisms, we focused on this most sensitive phase of their life cycle, studying the thermal tolerances of Iberian tadpoles.
A recent study in which pond temperatures for Iberian tadpole species were collected, provided a general idea of the maximum temperatures these species are experiencing in their habitats. Iberian ponds had an average maximum temperature of 28.7 ± 1.2° C, and an overall maximum temperature of 35.5° C in a few ponds (Duarte et al., 2011). So, if temperatures rise in the range of 4° C (Alcamo et al., 2007), in the future we could have Iberian ponds reaching maximum temperatures in the range of 32 – 39.5° C (Duarte et al., 2011).
2
By comparing populations of the same species occupying different habitats, we can analyze their ability to adjust to local conditions. Latitudinal and altitudinal gradients in the distribution of species have already been studied (Merriam & Steineger, 1890; Merriam, 1894) and addressed as an explanation for biological diversity due to associated climatic variability. Although simplistic, these studies showed that it is feasible to compare populations of species in different terrestrial habitats, which basically differ in their thermal profiles. Therefore, we would expect that populations of the same species located at different latitudes (Chown & Gaston, 2000) or altitudes (Körner, 2000) would have developed differing physiological abilities.
Two hypotheses explain the evolution of physiological thermal parameters. On the one hand, we have phylogenetic inertia that suggests that thermal characteristics are evolutionarily conservative showing little variation within closely related taxa (Huey, 1982; Rosen, 1991). In this case, closely related taxa sharing a common environment would have similar thermal needs, and share a similar thermal ecology, whereas populations in different environments would have different thermoregulatory mechanisms or the ability to tolerate suboptimal temperatures, but with no change in its ancestral physiological limits. On the other hand, there is the physiological adaptation hypothesis that defines thermal characteristics to be evolutionarily plastic, adapting themselves to the conditions of the local environment through selective pressure (Hertz et al, 1983). This hypothesis suggests that ectotherms keep their body temperatures within an optimal range adjusting it accordingly to its habitat. Therefore, closely related taxa occupying differing habitats may have their own optimal ranges. Furthermore, according to this hypothesis, unrelated taxa sharing similar environments would converge their thermal preferences with time.
The Critical Thermal Maximum (CTmax) is defined as “the thermal point at which locomotor activity becomes disorganized and the animal loses its ability to escape from conditions that will promptly lead to its death” (Cowles and Bogert, 1944). The onset of muscular spasms (OS) is considered to be an accurate and precise measure of thermal tolerance (Lutterschmidt & Hutchison, 1997a,b). By obtaining a list of means of CTmax, or OS, of different species we can assess whether species are at risk of suffering with global warming, which of these species are most sensitive, and also understand the evolution of this physiological parameter in this community. For this study we analyzed the thermal tolerance of tadpoles from 15 species of anurans from the Iberian Peninsula. Within certain species, we collected tadpoles from northern and
3
southern populations along their geographical distribution to test these evolutionary hypotheses.
Materials and Methods
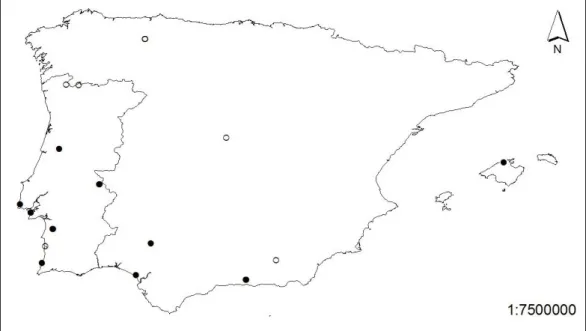
Amphibian larvae and eggs of 15 different species were collected in the sites described on table 1 between February 2007 and May 2008 (Table 1). Collection sites were selected in an attempt to sample individuals from populations on the latitudinal extremes of the Iberian distribution of each species (Figure 1). Seven of the 15 sampled species had a northernmost Cold population and a southernmost Hot population (Table 3). Eggs and tadpoles were reared in captivity until every animal had grown past Gosner stage 25 (Gosner, 1960) to assure all individuals are tested at the same developmental stage.
Figure 1 Representation of sample collection sites. Hot populations are represented as closed circles,
4
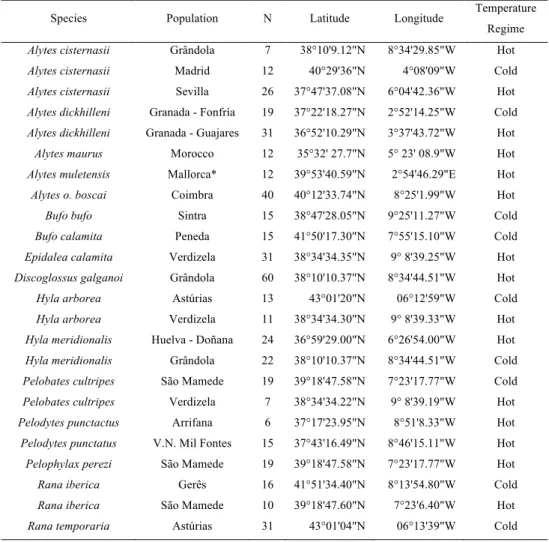
Table 1. List of samples collected, respective locations and code attributed for each species according to
geographic location relative to their general distribution. *Captive reared animals from the Jersey Zoo. Original distribution: Torrent de Mortitx, Mallorca, Spain.
Species Population N Latitude Longitude Temperature Regime
Alytes cisternasii Grândola 7 38°10'9.12"N 8°34'29.85"W Hot
Alytes cisternasii Madrid 12 40°29'36"N 4°08'09"W Cold
Alytes cisternasii Sevilla 26 37°47'37.08"N 6°04'42.36"W Hot
Alytes dickhilleni Granada - Fonfría 19 37°22'18.27"N 2°52'14.25"W Cold
Alytes dickhilleni Granada - Guajares 31 36°52'10.29"N 3°37'43.72"W Hot
Alytes maurus Morocco 12 35°32' 27.7"N 5° 23' 08.9"W Hot
Alytes muletensis Mallorca* 12 39°53'40.59"N 2°54'46.29"E Hot
Alytes o. boscai Coimbra 40 40°12'33.74"N 8°25'1.99"W Hot
Bufo bufo Sintra 15 38°47'28.05"N 9°25'11.27"W Cold
Bufo calamita Peneda 15 41°50'17.30"N 7°55'15.10"W Cold
Epidalea calamita Verdizela 31 38°34'34.35"N 9° 8'39.25"W Hot
Discoglossus galganoi Grândola 60 38°10'10.37"N 8°34'44.51"W Hot
Hyla arborea Astúrias 13 43°01'20"N 06°12'59"W Cold
Hyla arborea Verdizela 11 38°34'34.30"N 9° 8'39.33"W Hot
Hyla meridionalis Huelva - Doñana 24 36°59'29.00"N 6°26'54.00"W Hot
Hyla meridionalis Grândola 22 38°10'10.37"N 8°34'44.51"W Cold
Pelobates cultripes São Mamede 19 39°18'47.58"N 7°23'17.77"W Cold
Pelobates cultripes Verdizela 7 38°34'34.22"N 9° 8'39.19"W Hot
Pelodytes punctactus Arrifana 6 37°17'23.95"N 8°51'8.33"W Hot
Pelodytes punctatus V.N. Mil Fontes 15 37°43'16.49"N 8°46'15.11"W Hot
Pelophylax perezi São Mamede 19 39°18'47.58"N 7°23'17.77"W Hot
Rana iberica Gerês 16 41°51'34.40"N 8°13'54.80"W Cold
Rana iberica São Mamede 10 39°18'47.60"N 7°23'6.40"W Hot
Rana temporaria Astúrias 31 43°01'04"N 06°13'39"W Cold
All tadpoles were maintained in individual containers with a volume of 200 mL of dechlorinated water, identified, and fed ad libitum with commercial koi food pellets. They were acclimatized at 10° C and LD 12:12 photoperiod for at least 4 days. This acclimatization period was chosen as previous research in adult amphibians showed that between 2 and 3 days was the time required to stabilize CTmax after a large change in acclimation temperature (Hutchison, 1961; Brattstrom, 1968).
The apparatus consisted of a water bath created by a hotplate calibrated to generate a heating rate of 1° C.min-1, and together with a magnetic stirrer working at 700 rpm that kept water temperature homogeneous. A clear-glass test container was supported by a plastic stand inside the water bath to allow enough clearance for the rotation of the magnet. A mirror was used under the test container to better observe the tadpole’s mouth and body responses.
5
CTmax was determined using a dynamic method (Hutchison, 1961) where the test subject is exposed to a fixed heating rate, until it exhibits a loss of righting response (LRR) and the onset of muscular spasms (OS) (Paulson & Hutchinson, 1987). We considered OS as the definitive endpoint for the experiment (Lutterschmidt & Hutchinson, 1997a,b). After CTmax was determined, we transferred tadpoles to cold water to allow for their recovery, after which the body mass and Gosner stage were recorded.
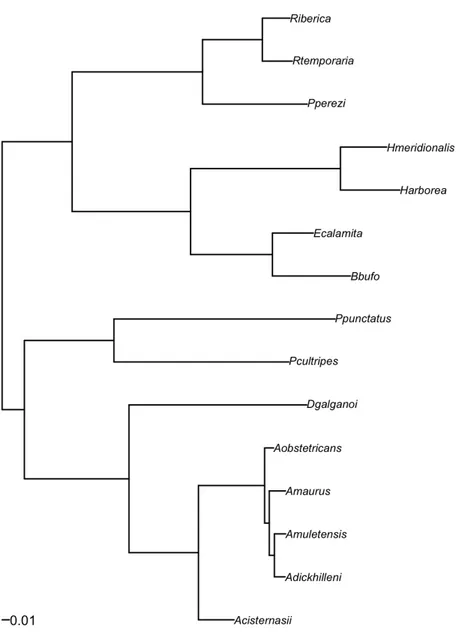
The responses of species may be influenced by shared common ancestry and thus species cannot a priori be considered independent data points (Felsenstein, 1985). To determine whether the physiology of a particular species is influenced by its phylogeny, we tested for phylogenetic independence of CTmax with the software ‘Phylogenetic Independence 2.0’ (Reeve and Abouheif, 2003). Tests For Serial Independence (TFSI) on continuous data were performed using the phylogenetic topology of Duarte et al. 2011(Fig. 1). Topology was randomly rotated 10000 times to build the null hypothesis.
Since there was no normality in CTmax (see results), interspecific comparisons were performed using Kruskal-Wallis tests and a post-hoc Tukey HSD. Intraspecific comparisons were performed using Mann-Whitney tests. The data were calculated using the R statistical software platform (2011).
6
Figure 2 Sub-tree of a previously published phylogenetic tree (Duarte et al. 2011) based on two
mitochondrial genes ND1 and cyt b, and three nuclear protein coding genes Tyrosinase, Rhodpsin and
7 Results
Interspecific Comparisons
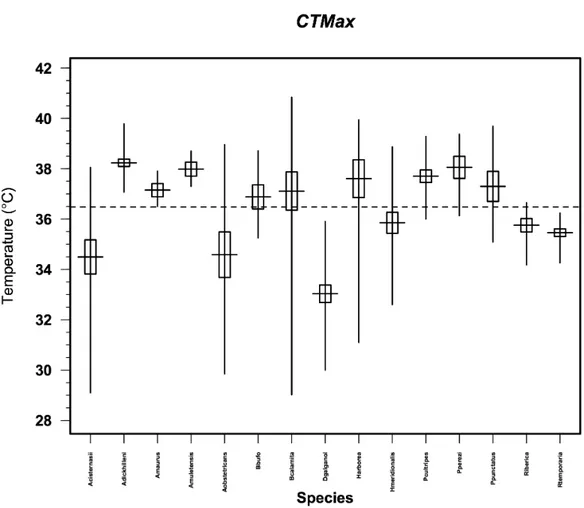
Despite the fact that some species showed an ample range of values for CTmax (e.g. the observed maximum range of 11.82° C for Bufo calamita; Table 2), there were robust results in most of them (Figure 3). Testing for phylogenetic independence in CTmax we failed to reject the null hypothesis of the TFSI test (C - statistics = 0.0931, p = 0.1283).
With an overall mean of means of 36.5° C and a non-normal distribution (Shapiro-Wilk’s W = 0.9479, p < 0.001), we found significant differences among species (Kruskal-Wallis χ² = 258.97, df = 14, p < 0.001). The post-hoc Tukey HSD tests defined three thermally distinct groups (groups whose means did not significantly differ from one another within the group p > 0.05). The lesser tolerant group was composed of Discoglossus galganoi alone. A second low resistant group was defined by Alytes cisternasii, A.obstetricans, Rana iberica, R. temporaria and Hyla meridionalis. And the third group with the most tolerant species was defined by A. dickhilleni, A. muletensis, Hyla arborea, Pelobates cultripes and Pelophylax perezi. A fourth intermediate group of species, that did not differ significantly from other species, and were thus fitted both into the second and third groups alike, is formed by Alytes maurus, Bufo bufo, Epidalea calamita, and Pelodytes punctatus.
8
Figure 3 Mean CTmax of each species. Vertical lines are total range of OS responses, and boxes
9
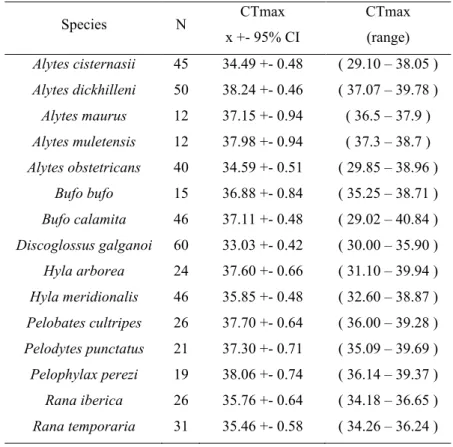
Table 2. Summary of means, 95% Confidence intervals and ranges of
temperatures for CTmax for the fifteeen species in study.
Species N CTmax x +- 95% CI CTmax (range) Alytes cisternasii 45 34.49 +- 0.48 ( 29.10 – 38.05 ) Alytes dickhilleni 50 38.24 +- 0.46 ( 37.07 – 39.78 ) Alytes maurus 12 37.15 +- 0.94 ( 36.5 – 37.9 ) Alytes muletensis 12 37.98 +- 0.94 ( 37.3 – 38.7 ) Alytes obstetricans 40 34.59 +- 0.51 ( 29.85 – 38.96 ) Bufo bufo 15 36.88 +- 0.84 ( 35.25 – 38.71 ) Bufo calamita 46 37.11 +- 0.48 ( 29.02 – 40.84 ) Discoglossus galganoi 60 33.03 +- 0.42 ( 30.00 – 35.90 ) Hyla arborea 24 37.60 +- 0.66 ( 31.10 – 39.94 ) Hyla meridionalis 46 35.85 +- 0.48 ( 32.60 – 38.87 ) Pelobates cultripes 26 37.70 +- 0.64 ( 36.00 – 39.28 ) Pelodytes punctatus 21 37.30 +- 0.71 ( 35.09 – 39.69 ) Pelophylax perezi 19 38.06 +- 0.74 ( 36.14 – 39.37 ) Rana iberica 26 35.76 +- 0.64 ( 34.18 – 36.65 ) Rana temporaria 31 35.46 +- 0.58 ( 34.26 – 36.24 )
10 Intraspecific Comparisons
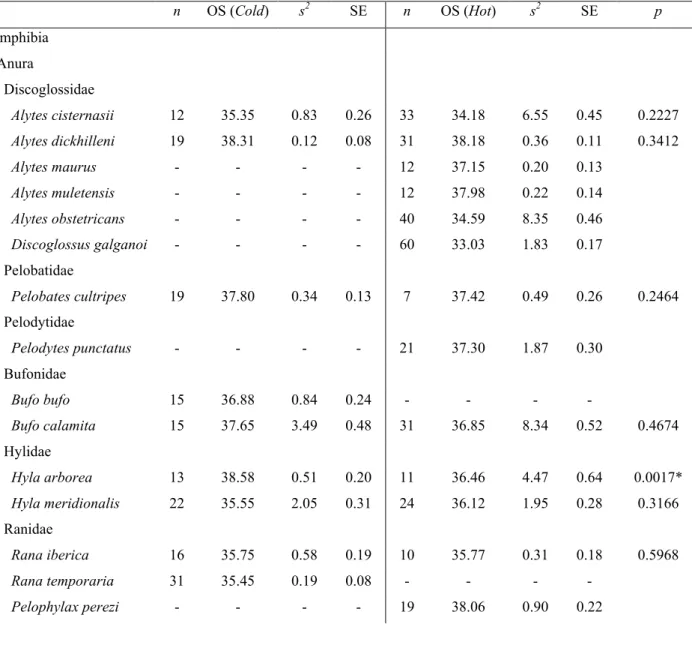
Only one of the species for which we had both Hot and Cold populations showed significantly different thermal tolerances between them. This species, Hyla arborea showed significant differences between its geographic extremes with a higher value of CTmax for the Cold population, with a difference of almost 2° C compared to the Hot population.
Table 3 Sample size, means, variances, standard errors and p values of two sample Mann-Whitney tests for mean comparisons
between Hot and Cold populations for each species. * represents significance < 0.05.
n OS (Cold) s2 SE n OS (Hot) s2 SE p Amphibia Anura Discoglossidae Alytes cisternasii 12 35.35 0.83 0.26 33 34.18 6.55 0.45 0.2227 Alytes dickhilleni 19 38.31 0.12 0.08 31 38.18 0.36 0.11 0.3412 Alytes maurus - - - - 12 37.15 0.20 0.13 Alytes muletensis - - - - 12 37.98 0.22 0.14 Alytes obstetricans - - - - 40 34.59 8.35 0.46 Discoglossus galganoi - - - - 60 33.03 1.83 0.17 Pelobatidae Pelobates cultripes 19 37.80 0.34 0.13 7 37.42 0.49 0.26 0.2464 Pelodytidae Pelodytes punctatus - - - - 21 37.30 1.87 0.30 Bufonidae Bufo bufo 15 36.88 0.84 0.24 - - - - Bufo calamita 15 37.65 3.49 0.48 31 36.85 8.34 0.52 0.4674 Hylidae Hyla arborea 13 38.58 0.51 0.20 11 36.46 4.47 0.64 0.0017* Hyla meridionalis 22 35.55 2.05 0.31 24 36.12 1.95 0.28 0.3166 Ranidae Rana iberica 16 35.75 0.58 0.19 10 35.77 0.31 0.18 0.5968 Rana temporaria 31 35.45 0.19 0.08 - - - - Pelophylax perezi - - - - 19 38.06 0.90 0.22
11 Discussion
Interspecific comparisons of physiological tolerance limits clearly defined three groups in these Iberian species. Discoglossus galganoi was the less tolerant species of our sample, being significantly distinct (p < 0.05) from every species with the lowest CTmax mean value of 33.03° C. The second group with low tolerance includes three of the species with wider ranges of CTmax responses (Alytes obstetricans, A. cisternasii and Hyla meridionalis) and two cold specialized species of ranids (Rana iberica and R. temporaria). These are also the most geographically widespread, namely the discoglossids.
On the one hand, species with a vast geographic distribution present wider ecological niches than taxa with more restricted distributions (Brown, 1984; Brown and McLachlan, 1994; Gaston, 1994, Gaston et al. 1997; Maurer, 1999). Consequently we expected they would have a wider breadth of physiological capacity to face different climatic conditions than the latter. This implies they have a bigger physiological plasticity and environmental tolerance (Stanley & Parsons, 1984; Barnby, 1987; Gaston & Spicer 2001; Cleavitt, 2002; Calosi et al. 2007). On the other hand, the physiology of a species may actually be affecting its relative range of geographical distribution (Stevens, 1989). Either one of these two hypotheses could explain the reason why the discoglossids have such wide ranges for their thermal tolerances, in spite of having lower mean values. We would expect H. meridionalis to have a higher thermal tolerance being an Iberian anuran with a southern distribution, yet it seems to show the same pattern as the discoglossids in its group, with a relatively low thermal tolerance and a wide range of CTmax.
Rana iberica and R. temporaria have an intermediate tolerance to high temperatures and could possibly have a higher risk of suffering from peaks of temperature in coming years. However, these two northern species usually inhabit high altitudes and cold creeks where high thermal tolerance would not be selected. Similarly, microhabitat temperatures might be so low, that we would not expect them to reach the CTmax of these animals. However, there are records of maximum water temperatures of 29.1° C for populations of R. iberica (Duarte et al., 2011), which could go up to 33° C in the future (Alcamo et al., 2007), thus getting relatively close to their thermal limits.
12
The remaining species do not vary much among one another in CTmax, suggesting there is a relatively similar upper limit for the Iberian anuran community. However, it is interesting to point out the diversity in tolerance ranges where Epidalea calamita and Hyla arborea would be the winners. Their geographic distributions are two of the vastest examples of what comprises anuran diversity in the Iberian Peninsula, expanding all over central Europe. By comparison, Bufo bufo shows a very small CTmax range considering its wide geographic distribution, which goes as far as central Asia. In fact, recent studies suggest that Iberian populations of B. bufo may constitute a different species altogether (Recuero et al., 2011).
In ranids, there is a clear difference in thermal tolerance between Pelophylax perezi and its closest relatives in the genus Rana. Pelophylax perezi occupies a more varied set of habitats than Rana iberica or R.temporaria, from temporary ponds or rivers to permanent ponds. This ecological difference exposes this frog to more diverse thermal niches and higher temperatures, for it is also a late spring and summer breeder. R. temporaria and R. iberica reproduce in permanent ponds or rivers, from winter to spring, at higher altitudes where tadpoles would not be exposed to temperatures as high as the ones of P.perezi.
Several studies have shown that upper thermal tolerances of distinct ectothermic species correlate with microhabitat temperatures to which they are exposed along latitudinal clines (crabs: Stillman & Somero, 2000; bivalves: Compton et al., 2007; lizards: Sinervo et al., 2010; amphibians: Duarte et al., 2011). However, other ectotherms did not exhibit latitudinal trends in CTmax (Addo-Bediako et al., 2000; Huey et al., 2009; Sunday et al., 2011). This discrepancy is possibly due to the thermal data used in the analyses; they corresponded to maximum air temperatures per year, which do not vary much with latitude (Addo-Bediako et al., 2000; Ghalambor et al., 2006). In this study we showed that, in the Iberian Peninsula, in spite of clear latitudinal differences in temperature, there is no significant difference of upper thermal tolerances between northern and southern populations of the studied anurans. This suggests there is an insufficient ability of physiological adaptation in all species except in the case of Hyla arborea.
The CTmax in these species is phylogenetically independent, which does not support our phylogenetic inertia hypothesis for the conservation of thermal characters among closely related taxa. In spite of the fact that some species have wide ranges of thermal responses, there is no significant variation between extreme populations within one
13
species (except for Hyla arborea). Therefore, it seems there has been little support for physiological adaptation, and it is remarkable to see there is a clear conservation of CTmax in each species.
The potential risks and effects of global warming can be partly diminished by compensatory mechanisms such as acclimation (Floyd, 1983), thermoregulatory behaviour (Hutchison & Dupré, 1992), shifts in breeding phenology (Beebee, 1995; Bradshaw & Holzapfel, 2006), or evolutionarily adaptive responses (Skelly et al., 2007). Invertebrate ectotherms show a limited capacity to change CTmax (Cavicchi et al., 1995; Stillman, 2003; Kellermann et al., 2009). In porcellanid crabs, Stillman (2003) predicted that species with greater thermal limits would be most vulnerable to increased warming since they had the most limited acclimatory capacity and already live close to their CTmax. In contrast, in the genus of aquatic beetles Deronectes, species with the lowest CTmax are most vulnerable to increasing temperatures since upper thermal tolerance predicts acclimatory capacity: species with the least ability to cope with high temperatures also have the least ability to acclimate to them. For amphibians, it seems that species with restricted geographic ranges have little acclimatory capacity in adults, both along latitudinal and altitudinal gradients (Brattstrom, 1968). Amphibian larvae do not exhibit a relationship between acclimatory capacity and geographical range size. Indeed, there seems to be no differential acclimatory capacity among species, or communities, which could be an ancestral character maintained in this life stage (H. Duarte, M. Tejedo, M. Katzenberger, F. Marangoni, unpublished results). In what concerns adaptive evolution, it seems that if environmental conditions change too quickly evolutionary responses might not be sufficient to prevent the extinction of populations, specially when genetic variability is low (Hoffmann, 2011). Overall, it seems the ability of amphibians to adjust their physiology to a changing environment are apparently limited, but the interaction between plastic and evolutionary responses could mitigate the effects of rapid climate change.
Finally by reviewing the information of Iberian ponds, we predict that there might be an increase of temperature leading to maximum pond temperatures in the range of 32 to 39.5° C. The highest limits of the warmest ponds could surpass the CTMax of all the Iberian species we tested, rendering them unable to perform, or even incapable of surviving rising temperatures. It is clear that most species will be in peril of exposure
14
to peak temperatures in their environments and for this reason, future studies should research alternative mitigating mechanisms to climate change on amphibians.
Acknowledgements
This project was financed by the project “Adaptaciones de anuros ante cambios climáticos: estudio comparativo de poblaciones en extremos térmicos.” - MEC (Plan Nacional I+D+I), CGL 2005-00092/BOS of the Museo Nacional de Ciencias Naturales of Madrid. I want to thank Rafael Márquez (Madrid), Diego Llusia (Madrid), Juan Francisco Beltrán (Granada), Miguel Tejedo (Seville) and David Donaire (Morocco) for logistic support with spanish populations, to Hugo Tavares for help with the map in figure 1, and to all the people who voluntarily helped with field work and maintenance of animals in the laboratory, especially to Catarina Moreira.
15 References
Addo-Bediako, A., Chown, S.L., & Gaston, K.J. 2000. Thermal tolerance, climatic variability and latitude. Proceedings of the Royal Society B, 267: 739-745.
Alcamo, J., Floerke, M., & Maerker, M. 2007. Future long-term changes in global water resources driven by socio-economic and climatic changes. Hydrological Sciences, 52: 247-275 in Intergovernmental Panel for Climate Change 2007 Assessment Report, Chapter 12: Europe.
Araújo, M.B., Thuiller, W., & Pearson, R.G. 2006. Climate warming and the decline of amphibians and reptiles in Europe. Journal of Biogeography, 33: 1712-1728.
Barnby, M.A. 1987. Osmotic and ionic regulation of two brine fly species (Diptera: Ephydridae) from a saline hot spring. Physiological Zoology, 60: 327-338.
Beebee, T.J.C. 1995. Amphibian breeding and climate. Nature, 374: 219-220.
Bradshaw, W.E., & Holzapfel, C.M. 2006. Evolutionary response to rapid climate change. Science, 312: 1477-1478.
Brattstrom, B.H. 1968. Thermal acclimation in anuran amphibians as a function of latitude and altitude. Comparative Biochemistry and Physiology, 24: 93-111.
Brown, J.H. 1984. On the relationship between abundance and distribution of species. The American Naturalist, 124: 255-279.
Brown, M.T., & McLahlan, A. 1994. Ecology of sandy shores. Elsevier, Amsterdam.
Calosi, P., Morritt, D., Chelazzi, G., & Ugolini, A. 2007. Physiological capacity and environmental tolerance in two sandhopper species with contrasting geographical ranges: Talitrus saltator and Talorchestia ugolinii. Marine Biology, 151: 1647-1655.
16
species’ borders: ecological and evolutionary perspectives. Oikos, 108: 28-‐46.
Cavicchi, S., Guerra, D., La Torre, V., & Huey, R.B. 1995. Chromosomal analysis of heatshock tolerance in Drosophila melanogaster evolving at different temperatures in the laboratory. Evolution, 49: 676-684.
Chown, S.L., & Gaston, K.J. 2000. Areas cradles and museums: the latitudinal gradient in species richness. Trends in Ecology and Evolution, 15: 311-315.
Cleavitt, N.L. 2002. Stress tolerance of rare and common moss species in relation to their occupied environments and asexual dispersal potential. Journal of Ecology, 90: 785-795.
Compton, T.J., Rijkenberg, M.J.A., Drent, J., & Piersma, T. 2007. Thermal tolerance ranges and climate variability: a comparison between bivalves from differing climates. Journal of Experimental Marine Biology and Ecology, 352: 200-211.
Cowles, R.B., & Bogert, C.M. 1944. A preliminary study of the thermal requirements of desert reptiles. Bulletin of the American Museum of Natural History, 83: 265-296. Duarte, H., Tejedo, M., Katzenberger, M., Marangoni, F., Baldo, D., Beltrán, J.F., Martí, D.A., Richter-Boix, A., & Gonzalez-Voyer, A. 2011. Can amphibians take the heat? Vulnerability to climate warming in subtropical and temperate larval amphibian communities. Global Change Biology, in press. doi: 10.1111/j.1365-2486.2011.02518.x
Dunson, W.A., & Travis, J. 1991. The American Naturalist, 138: 1067-1091.
Felsenstein, J. 1985. Phylogenies and the comparative method. The American Naturalist, 125: 1-13.
17
Floyd, R.B. 1983. Ontogenetic change in the temperature tolerance of larval Bufo marinus (Anura: Bufonidae). Comparative Biochemistry and Physiology, 75A: 267-271.
Gaston, K.J. 1994. Rarity. Chapman & Hall, London.
Gaston, K.J., Blackburn, T.M., & Lawton, J.H. 1997. Inter-specific abundance-range size relationships: an appraisal of mechanism. Journal of Animal Ecology, 66: 579-601.
Gaston, K.J., & Spicer, J.I. 2001. The relationship between range size and niche breadth: a test using five species of Gammarus (Amphipoda). Global Ecology and Biogeography, 10: 179-188.
Ghalambor, C.K., Huey, R.B., Martin, P.R., Tewksbury, J.J., & Wang, G. 2006. Are mountain passes higher in the tropics? Janzen’s hypothesis revisited. Integrative and Comparative Biology, 46: 5-17.
Gosner, K.L. 1960. A simplified table for staging anuran embryos and larvae with notes on identification. Herpetologica, 16: 183-190.
Hertz, P.E., Huey, R.B., & Nevo, E. 1983. Homage to Santa Anita: thermal sensitivity of sprint speed in agamid lizards. Evolution, 37: 1075-1084.
Hillman, S.S., Withers, P.C., Drewes, R.C., & Hillyard, S.D. 2009. Ecological and environmental physiology of amphibians. Oxford University Press, United Kingdom.
Hochochka, P.W., & Somero, G.N. 2002. Biochemical Adaptation. Oxford University Press, Oxford.
Hoffmann, A.A., & Sgrò, C.M. 2011. Climate change and evolutionary adaptation. Nature, 470: 479-485. doi: 10.1038/nature09670
18
Huey, R.B. 1982. Temperature, physiology and the ecology of reptiles. In: Perspectives of biophysical ecology. C. Gans & F.H. Pough (Ed.), Academic Press, New York City, New York, U.S.A. pp. 25-91.
Huey, R.B., Deutsch, C.A., Tewksbury, J.J., Vitt, L.J., Hertz, P.E., Álvarez Pérez, H.J., Garland, T.Jr. 2009. Why tropical forest lizards are vulnerable to climate warming. Proceedings of the Royal Society B, 276: 1939-1948.
Hutchison, V.H. 1961. Critical thermal maxima in salamanders. Physiological Zoology, 34: 92-125.
Hutchison, V.H., & Dupré, R.K. 1992. Thermoregulation. In: Environmental
Physiology of the Amphibia. M.E. Feder & W. Burgren (Ed.), University of Chicago
Press, Chicago, Illinois, U.S.A. pp. 206-249.
Kellermann, V., van Heerwaarden, B., Sgrò C., & Hoffmann, A.A. 2009. Fundamental evolutionary limits in ecological traits drive Drosophila species distributions. Science, 325: 1244-1246.
Körner, C. 2000. Why are there global gradients in species richness? Mountains might hold the answer. Trends in Ecology and Evolution, 15: 513-514.
Lutterschmidt, W.I., & Hutchison, V.H. 1997a. The critical thermal maximum: data to support the onset of spasms as the definitive end point. Canadian Journal of Zoology, 75: 1553-1560.
Lutterschmidt, W.I., & Hutchison, V.H. 1997b. The critical thermal maximum: history and critique. Canadian Journal of Zoology, 75: 1561-1574.
Maurer, B.A. 1999. Untangling ecological complexity. University of Chicago Press, Chicago.
Merriam, C.H. 1894. Laws of temperature control of geographic distribution of terrestrial mammals and plants. National Geographic Magazine 6: 229-238.
19
Merriam, C.H., & Steineger, L. 1890. Results of a biological survey of the San Francisco mountain region and the desert of the Little Colorado, Arizona. North American Fauna Report 3. U.S. Department of Agriculture, Division of Ornithology and Mammalia, Washington, D.C., 136 pp.
Parmesan, C. 2006. Ecological and evolutionary responses to recent climate change. Annual Review of Ecology and Systematics, 37: 637-669.
Paulson, B.K., & Hutchison, V.H. 1987. Origin of the stimulus for muscular spasms at the critical thermal maximum in anurans. Copeia, 1987: 810-813.
Pearson, R.G., & Dawson, T.P. 2003. Predicting the impacts of climate change on the distribution of species: are bioclimate envelope models useful? Global Ecology and Biogeography, 12: 361-371.
R Development Core Team (2011). R: A language and environment for statistical computing. R Foundation for Statistical Computing, Vienna, Austria. ISBN 3-900051-07-0, URL http://www.R-project.org/.
Recuero, E., Canestrelli, D., Vörös, J., Szabo, K. , Poyarkov, N.A., Arntzen, J.W., Crnobrnja-Isailovic, J., Kidov, A.A., Coga ̆lniceanu, D., Caputo, F.P., Nascetti, Martínez-Solano,G. I. 2011. Multilocus species tree analyses resolve the radiation of the widespread Bufo bufo species group (Anura, Bufonidae). Molecular Phylogenetics and Evolution. doi:10.1016/j.ympev.2011.09.008
Reeve, J., & Abouheif, E. 2003. Phylogenetic Independence, Version 2.0. Department of Biology, McGill University (distributed free by the authors on request).
Rosen, P.C. 1991. Comparative field study of thermal preferenda in garter snakes (Thamnophis). Journal of Herpetology, 25: 301-312.
Sinervo, B., Méndez de la Cruz, F., & Miles, D.B. et al. 2010. Erosion of lizard diversity by climate change and altered thermal niches. Science, 328: 894-899.
20
Skelly, D.K., Joseph, L.N., Possingham, H.P., Kealoha Freidenburg, L., Farrugia, T.J., Kinnison, M.T., & Hendry, A.P. 2007. Evolutionary responses to climate change. Conservation Biology, 21: 1353-1355.
Southward, A.J., Hawkins, S.J., & Burrows, M.T. 1995. Seventy years' observations of changes in distribution and abundance of zooplankton and intertidal organisms in the western English Channel in relation to rising sea. Journal of Thermal Biology, 20:
127-155.
Stanley, S., & Parsons, P.A. 1984. The response of the cosmopolitan species Drosophila melanogaster, to ecological gradients. Proceedings of the Ecological Society of Australia, 11: 121-130.
Stevens, G. C. 1989. The latitudinal gradient in geographical range: how so many species coexist in the tropics. American Naturalist. 133: 240-256.
Stillman, J.H. 2003. Acclimation capacity underlies susceptibility to climate change. Science, 301: 65.
Stillman, J.H., & Somero, G.N. 2000. A comparative analysis of the upper thermal tolerance limits of eastern Pacific porcelain crabs, genus Petrolisthes: influences of latitude, vertical zonation, acclimation and phylogeny. Physiological and Biochemical Zoology, 73: 200-208.
Sunday, J.M., Bates, A.E., & Dulvy, N.K. 2011. Global analysis of thermal tolerance and latitude in ectotherms. Proceedings of the Royal Society B, 278: 1823-1830.
Tracy, C.R. 1975. Water and energy relations of terrestrial amphibians: insights from mechanistic modeling. In: Perspectives of Biophysical Ecology. D.M. Gates & R.B. Schmerl (Ed.), Springer-Verlag, New York. pp. 325-346.
Tracy, C.R. 1976. A model of the dynamic exchanges of water and energy between a terrestrial amphibian and its environment. Ecological Monographs, 46: 293-326.
21
Tracy, C.R. 1979. Further thoughts on anuran thermoregulation: discussion. In: The behavioral significance of color. E.H. Burtt Jr. (Ed.), Garland Press, New York. pp. 63-67.
Tewksbury, J.J., Huey, R.B., & Deutsch, C.A. 2008. Putting the heat on tropical animals. Science, 320: 1296-1297.