Nuno Miguel Carvalho Oliveira
Web 3D Service
An Open Source Implementation
Disserta¸c˜ao de Mestrado
Mestrado em Engenharia Inform´atica
Trabalho efetuado sob a orienta¸c˜ao do Professor Jorge Gustavo Rocha
Web 3D Service
An Open Source Implementation
Dissertation
Nuno Miguel Carvalho Oliveira
(PG18391) Universidade do Minho
Acknowledgements
I would like to express my gratitude to my advisor, Prof Jorge Rocha, for his excellent guidance, dedication and to have introduced me the GIS field.
Besides my advisor, I would like to thank Paulo Machado for always give his best sug-gestions and provide the best uses cases for W3DS.
I would also like to thank my family. They were always supporting and encouraging me.
Finally, I would like to thank GeoServer team for their dedication to open source and their support.
Abstract
Geographic Information Systems (GIS) represents some of the most interesting challenges for software engineering of our time. The data volume, the complexity and the critical use cases demands expertise in different computer science domains, besides the knowledge of some geography principles.
The development of standards related to geographic information representation and its manipulation, either de facto or de jure standards is crucial to the development of large scale GIS applications.
By default georeferenced data have been represented in a two dimensional plane for simplicity. Nowadays the evolution of graphics hardware and the emergence of technolo-gies like WebGL give us the necessary support to make 3D GIS possible. But newer and more sophisticated GPUs are not enough to support mature 3D applications. Standards related to 3D representation and manipulation are necessary.
In this work we analyze the Open Geospatial Consortium Web 3D Service draft spec-ification and provide an open source implementation for it.
Contents
1 Introduction 8
1.1 Motivation . . . 9
1.2 Goals . . . 11
1.3 Dissertation Structure . . . 12
2 State Of The Art 13 2.1 3D GIS . . . 14
2.1.1 Web 3D Evolution . . . 16
2.1.2 Web 3D GIS Clients . . . 17
2.2 Web Services Architectures . . . 19
2.2.1 OGC Web Services . . . 20
2.2.2 Map Servers . . . 22 3 Web 3D Service 24 3.1 GetCapabilities . . . 25 3.2 GetScene . . . 27 3.3 GetFeatureInfo . . . 31 3.4 GetTile . . . 32 3.5 Styling . . . 34
4 Architecture and Implementation 36 4.1 Base Framework . . . 37
4.2 Java Technologies . . . 38 4.2.1 Maven . . . 39 4.2.2 Spring Framework . . . 46 4.3 Architecture . . . 51 4.4 Implementation . . . 54 4.4.1 Service . . . 54 4.4.2 Types . . . 56 4.4.3 Styles . . . 57 4.4.4 Responses . . . 59 4.4.5 Web . . . 60
5 Results and Evaluation 62 5.1 Use Case . . . 62 5.2 Dataset Preparation . . . 64 5.2.1 Terrain Preparation . . . 64 5.2.2 Preparation of 3D Features . . . 67 5.3 GeoServer Configuration . . . 68 5.4 GetCapabilities Request . . . 70 5.5 GetTile Request . . . 72 5.6 GetScene Request . . . 73 5.6.1 X3D . . . 73 5.6.2 KML . . . 77 6 Conclusion 80 6.1 Publications . . . 81 6.2 Future work . . . 81
List of Figures
2.1 3D Computer Aided Design (CAD) models that represent the 3D entities and the Digital Terrain Model (DTM), as proposed by Cambray in 1993
(Source [6] ). . . 15
2.2 Types of clients as described on Web 3D Service (W3DS) specification (Source [31] ). . . 19
3.1 Example of 3D styles (Source [12] ). . . 35
4.1 Maven clean and default life cycles and its build phases. . . 44
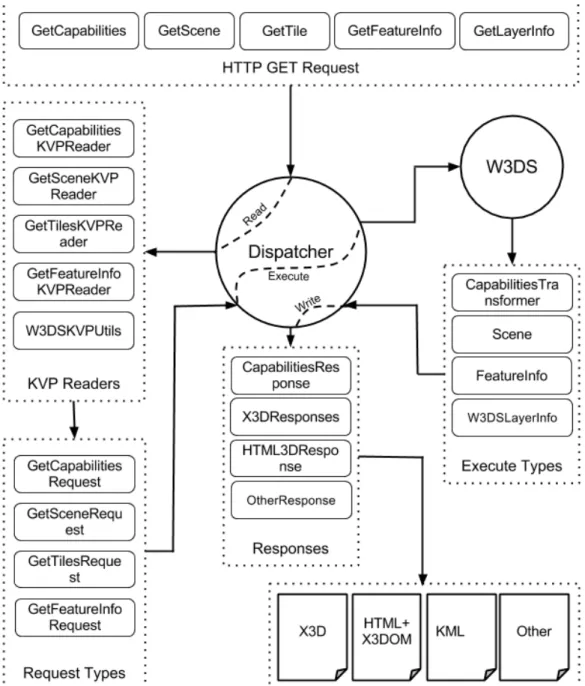
4.2 Simplified description of the Dispatcher and the W3DS components. . . . 53
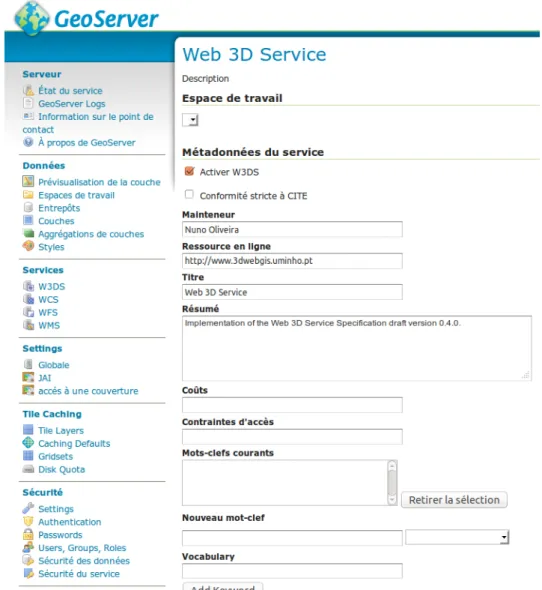
4.3 Print screen of W3DS service configuration page. . . 60
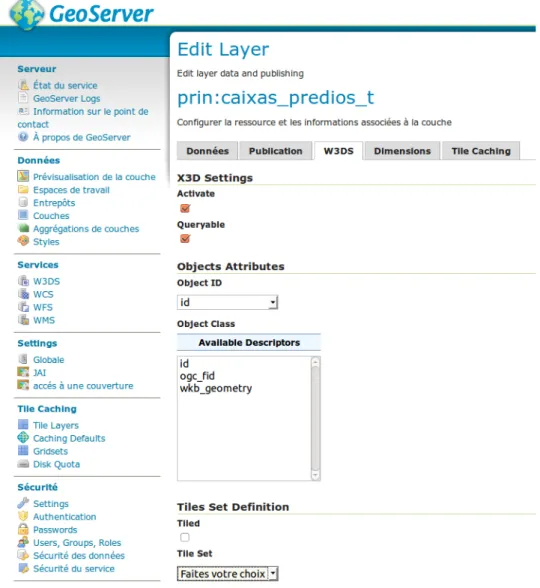
4.4 Print screen of W3DS layer configuration page. . . 61
5.1 Architecture of the use case. . . 63
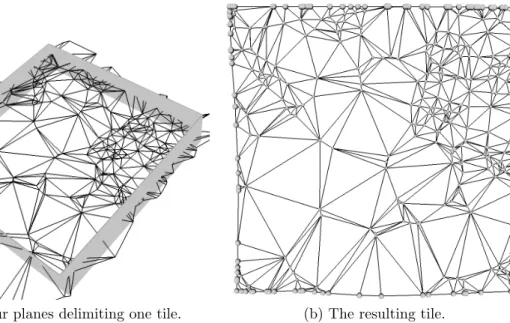
5.2 Cutting tiles. . . 65
5.3 Perfect composition of several tiles, at different resolutions. . . 67
6.1 X3D models renders by X3DOM . . . 82
List of Tables
3.1 W3DS operations. . . 253.2 W3DS GetScene operation parameters. . . 28
3.3 GetFeatureInfo operation parameters. . . 32
3.4 GetTile operation parameters. . . 33
Listings
3.1 KVP encoded GetCapabilities for GET request. . . 253.2 Example of a TileSet element. . . 27
3.3 KVP encoded GetScene for GET request. . . 30
3.4 KVP encoded GetFeatureInfo for GET request. . . 32
3.5 XML encoded GetTile for POST request. . . 34
4.1 Multi-module pom that aggregate some data base drivers. . . 41
4.2 Simple pom example. . . 42
4.3 Partial snapshot of Hibernate dependency tree produced by mvn dependency:tree command. . . 46
4.4 Spring bean XML definition. . . 49
4.6 Spring beans related to the W3DS types component. . . 57
4.7 Example of the inclusion of a 3D model using extended SLD. . . 58
4.8 W3DS response formats registered as Spring beans. . . 59
4.9 W3DS Apache Wicket components registered as Spring beans. . . 61
5.1 W3DS service meta-data. . . 70
5.2 GetCapabilities operation meta-data. . . 70
List of Acronyms
GIS Geographic Information Systems GPS Global Position System
VRML Virtual Reality Modeling Language OGC Open Geospatial Consortium
KML Keyhole Markup Language GML Geography Markup Language WMS Web Map Service
WFS Web Feature Service WCS Web Coverage Service WPS Web Processing Service SLD Styled Layer Descriptor
XML Extensible Markup Language W3DS Web 3D Service
X3D Extensible 3D
DTM Digital Terrain Model LOD Level Of Detail
SQL Structured Query Language WPVS Web Perspective View Service SRTM Shuttle Radar Topography Mission JTS Java Topology Suite
POM Project Object Model OWS Open Web Service NRW North Rhine-Westphalia SDI Spatial Data Infrastructure OWS OGC Web Service
CRS Coordinate Reference System
EPSG European Petroleum Survey Group KVP Keyword Value Pair
MIME Multipurpose Internet Mail Extensions JAK Java Api For KML
ORM OGC Reference Model CGI Common Gateway Interface WTS Web Terrain Service
GDAL Geospatial Data Abstraction Library
Chapter 1
Introduction
Is difficult to define a precise bird date to Geographic Information Systems (GIS). In the late 1960s the world saw the development of the Canadian Geographic Information System, which is one of the earliest GIS developed. This was a direct consequence of the computer hardware development. Since, the development of more powerful GIS and the evolution of computer science have always work side by side.
At the beginning, applications so complex as GIS was only supported by computers which have the size of a truck. Typically, GIS applications were used by big companies with very specific use cases or by governments. The cost and complexity of maintaining such systems was so high, that they only were used when the answer to the question Where is what ?, was not practical but fundamental. Nowadays we have GIS applications an hundred times more powerful which run on common devices, that can be carried on or pocket. This evolution didn’t only affect how practical they became but radically changes the way we are using it.
One of the most important aspect of every GIS is who we represents the data, or in other words, which kind of data he can handle. The fact is, that an evolution on the way we represent the data is also the sign of a big change on the potentiality of GIS systems. The first big jump was given from hand drawn maps to digital values stored on disk. In the 1970s, this leads to the automated map drafting, were digital stored
values are converted in sets of x y coordinates and draw by plotters. The next step have been the representation of geographical data in a vector format. Were map features are represented as sets of points, lines or polygons. At the same time, the raster data model also start to be used. This one, represents the data as a grid over a projected area and store the values from each cell.
In the current days, vectors and raster models are still the most used way to storing GIS data. Which data structure to use, is determined by the nature of the data and the kind of processing we want to perform. This leads to one duality in map visualization. In the current days when we look at map in most of the cases what we see is a mixture of vector and raster data.
With a new way to represent the data, the quantity of available GIS information start to grow. No matter which kind of model we use to represent our data, it needs to be stored and accessed. In meantime GIS market has become attractive for software companies, that start building a big among of systems who needed to be feed with GIS data. The increasing demands from customers, companies and organizations for interoperability force them addressing the needs of standards.
1.1
Motivation
Complex GIS software likes the ones used in city management are the result of the in-teraction of several organizations. Such interoperability is guaranteed by the respect of standards [17]. Most of them developed by Open Geospatial Consortium (OGC), an international consortium who develop and promotes the use of open standards in geo-graphical information. Along the years OGC has produced a large number of standards that falls on two big categories: formats and services.
Some of OGC most know and used formats, are Keyhole Markup Language (KML) [13] and Geography Markup Language (GML) [11]. Both of them can be used two express different kind of vectorial data and is meta-data, they also support 3D information. The
Web Map Service (WMS) [10] and Web Feature Service (WFS) [15] are certainly the most OGC used services.
The WMS service serve georeferenced images produced by the server who uses GIS data. The produced images are a mixture of vector and raster layers, which can represent any kind of information. Frequently WMS is associated in another OGC standard, the Styled Layer Descriptor (SLD) [12] who’s principal function is to describe a layer for the rendering process of a WMS. SLDs gives a way to customize the final appearance of the produced map.
Where WMS shows a representation of the GIS data hold by the server WFS give us the way to access and edit the vectorial data. WFS can use a variety of formats to encoding the data, however the most used are the Extensible Markup Language (XML) based ones, like GML. Due to the increasing number of web based GIS the GeoJSON format, which is more JavaScript friendly, have been widely adopted by GIS community. However, GeoJSON is not an OGC format.
Most of the actual GIS represents the information in two dimensions. This abstraction of the real world, forces the user to mentally translate what we see on the map before using it. In some uses cases, for example meteorology, geology and architecture, we cannot reflect, analyze or even display the relevant information precisely. With a 3D visualization some of that process become simplified and intuitive.
City administration have become one of the top use cases for 3D GIS ([21], [37], [25] and [24]), some of their operations needs precise and comprehensive knowledge about the all urban space. For example, frequently we need to simulate emergency situations, in 2D visualization this is made analytically and the results are traduced to a map and finally interpreted. In 3D we can in real-time see our simulations and directly see the results whit an extra accuracy. In other situations, like infrastructures management, we need more interaction whit the features that the one provided by the 2D mapping.
The idea of 3D mapping is not new, in 1997 [38] presents a web 3D GIS that use Virtual Reality Modeling Language (VRML) [29] to represent the 3D data. But, like other 3D
GIS, they have facing a major problem: the cost of rendering complex georeferenced 3D scenes. Nowadays, the constant evolution of graphical hardware, have provided common devices whit an enormous capacity of 3D rendering. Unfortunately, the techniques and environments needed to use that capabilities are not very friendly whit the new generation of GIS, who in the meantime have mostly become web applications.
Luckily the emergence of technologies such as WebGL [23], have definitely open the doors of 3D capabilities to modern GIS. In consequence, a big number of GIS using 3D visualization have appeared in the last years. However, with no standards to guaranty interoperability and maintainability, most of the examples we found can only see as show-off applications that can’t be deployed in real scenarios. In order to fight this chaotic situation we need standards that fully supports the needs of 3D GIS.
The OGC Web 3D Service (W3DS) specification draft is the most advanced candidate standard related with 3D GIS [31]. W3DS is a portrayal service where 3D GIS data is delivered encoded in a format that can be interpreted by a 3D client. W3DS is similar to WMS, cause both provide a view over the data. However, the result of WMS request (e.i. an image) can be seen everywhere, but the result of W3DS requires a client with extra capabilities. The W3DS referenced format specification to encode the result of a request is Extensible 3D (X3D) [5]. Georeferenced three-dimensional scenes encoded in X3D can be directly included in HTML5 pages and natively view in every browser which supports WebGL. At this moment, no W3DS open-source implementation is available.
1.2
Goals
The main goal of this work is to make an open-source implementation of a W3DS. Such implementation will follow the most recent W3DS specification , version 0.4.1.
To accomplish such goal, an open source map server will be used to take advantage of all logic already developed.
1.3
Dissertation Structure
The first chapter starts with an overview of GIS systems and its technological evolution, representing the main motivations to develop this work. 3D, OGC formats and services related concepts are also introduced. The interoperability importance is highlighted and serves as motivation for the goal of this work.
The second chapter presents the state of the art, approaching two major topics: 3D GIS and OGC web services architecture description. It will be explored the 3D Geo-graphic Information Systems (GIS) field presenting some of the most interesting works in that area. A brief overview about 3D web technologies and 3D GIS web clients will also be presented. It will be discussed the OGC web services architecture description where presenting the three majors open source map servers: MapServer, Deegree and GeoServer.
On the third chapter the W3DS standard is discussed. It starts by an overview of the 3D visualization pipeline. The four operations of the service: GetCapabilities, GetScene, GetFeatureInfo and GetTile will be described.
The fourth chapter is dedicated to our open source implementation and architecture of the W3DS. It introduces our base framework, i.e. GeoServer, and related technologies. Special attention is given to Maven and Spring Framework since they are responsible for the flexibility and extensibility of GeoServer. We also present the main components of our implementation and its integration in the GeoServer architecture.
On the fifth chapter we present the W3DS service in action, based on the management of telecommunications infrastructures. The data preparation is also described. Special focus is given to 3D tiled terrains.
Some concluding remarks are presented in the last chapter. Future work is discussed that results from the feedback received by users.
Chapter 2
State Of The Art
The Open Geospatial Consortium (OGC) Web 3D Service (W3DS) standard is the central component of this work. It stands on two major fields, the 3D Geographic Information Systems (GIS) for obvious reasons and because it is a OGC service it is connected to the web service architecture view of OGC. The full stack required by a 3D GIS application includes concepts from both of those fields.
Geographic Information Systems (GIS) community have been talking about 3D GIS from several years. A lot of prototypes have been made but they failed in dressing a stan-dard pipeline for 3D GIS applications. The lack of stanstan-dards to provide interoperability between the stages of the pipeline have limited the prototypes to the use case for what they have be made.
Most of the modern GIS have migrated to the web. A recent 3D GIS application will need to provide a web based 3D visualization. In the 90’s several 3D web based applications failed not because the lack of an appropriate 3D web standard but due to technologies issues. Nowadays recent technologies like WebGL definitively open the doors for 3D web applications.
In the enterprise view of OGC interoperability is essential. Web services are key elements in that interoperability model. OGC promote several open standards that define web services, like the Web Map Service (WMS) or the Web Feature Service (WFS). Most
of that services are implemented by several proprietary and open source map servers. Open source and open standards are two different concepts that are frequently con-fused. The main goal of an open standard is to guarantee interoperability between dif-ferent systems regardless how they are implemented. Open source is about free software that are available under a license that give to users a total control over the software including is source code.
Most of the reference implementations for open standards are made by open source projects. Open source map servers like GeoServer or Deegree are the reference imple-mentation for several OGC standards. Is wise to implement the W3DS on top of one of this servers.
In the first section of this chapter we will explore the 3D GIS field. We will present some of the most interesting works in that area. A brief overview about 3D web technolo-gies and 3D GIS web clients will also be presented. The second part of this state of the art will inside on the OGC web services architecture description where we will present three major open source map servers: MapServer, Deegree and GeoServer.
2.1
3D GIS
When we take a closer look at the evolution of 3D GIS, what is interesting is that they are not a new concept. In 1993 [6] presents a 3D GIS that use Computer Aided Design (CAD) models to represent the 3D entities and the Digital Terrain Model (DTM) (Figure 2.1). The models have three different kinds of approximation, the first two are used to index and accelerate the rendering process and the last one is a detailed representation of the 3D model.
In 1997 [38] presents one of the first 3D Web GIS. The HTML pages were produced dynamically and the 3D data was directly retrieved from the database using Structured Query Language (SQL). The produced 3D scenes are encoded in Virtual Reality Modeling Language (VRML) which can be interpreted by the browser VRML plug-in. The reference
[7] gathers some interesting publications about 3D GIS, that can be seen as the state of the art of 90s.
Most of the recent works inside on city administration, which have become one of the top use cases for 3D GIS ([21], [37], [25] and [24]). The problem is that most of that 3D GIS projects are very specific for the use case for which they were developed. Although they still interesting projects, most of them fail in dressing a stack of standards and technologies for developing 3D GIS applications.
Pilot 3D was one of the first projects where the authors worry about interoperable 3D visualization of GIS data [2]. Pilot 3D result from the initiative Geodata Infrastructure North Rhine-Westphalia (GDI-NRW). Another result from the GDI-NRW was the first draft of W3DS. The reference [3] presents a 3D Spatial Data Infrastructure (SDI) for the city of Heidelberg where W3DS is a central piece. This work was the first and still one of the most complete attempts in defining a 3D SDI based on open standards.
Nowadays, OSM-3D is one of the most ambitious and interesting project related to 3D GIS. Is main objective is to provide a 3D view of OpenStreetMap data integrated with the elevation data provided by the Shuttle Radar Topography Mission (SRTM). Is implementation is made on top of OGC standards, including W3DS for 3D visualization. The reference [19] makes an overview about the current state of OSM-3D in Germany and provides a good discussion about the generation of 3D building models.
Figure 2.1: 3D CAD models that represent the 3D entities and the DTM, as proposed by Cambray in 1993 (Source [6] ).
2.1.1
Web 3D Evolution
VRML was the first web based 3D format, released in 1995 and ISO certified in 1997. The main goal of VRML was to give a way to represent 3D virtual worlds that can be integrated on web pages. A VRML scene is composed by geometric primitives like points, segments and polygons. The scene may also include multimedia content like hyperlinks, images, sounds and videos. The aspect can be customized using lights effects and defining materials properties. VRML scenes can be explored in desktop software or in web browsers, using some compatible plug-in. The reference [29] make a good overview about the format.
In 2001, the Web3D Consortium, who have become the main supporter of VRML, releases Extensible 3D (X3D) a Extensible Markup Language (XML) encoding version of VRML ([5]). The XML based encoding of X3D make him more suitable to be natively integrated in HTML pages. X3D also add new features like the support of shaders, better events handling, new geometric primitives and others short cuts for 3D rendering. X3D brings up the concept of working groups, their job is to extends X3D to custom support of certain areas, like medicine, GIS and CAD. The GIS working group have provided X3D with the capability to natively support the needs of GIS applications. The main features are the full support of georeferenced coordinates and custom events for geographical scenes.
Even if at this time, VRML and X3D stay the most used web based 3D formats, their use decreases significantly when compared to ten years ago. When VRML was released everyone have tried to make use of it, quickly we have seen the appearance of 3D web content everywhere. Some companies have invest large quantities of money to move their websites to 3D. The same thing happened to GIS applications, we have assist to a massif jump from 2D to 3D, companies and governments have even start buying 3D georeferenced data. The problem was that technology don’t follow that movement. Computers with the capability of rendering complex 3D scenes at acceptable frames rates were not common and those that existed were too expensive. With the poor quality offered by 3D web and
passed the new sensation of a third dimension, people start looking again to a 2D web. Around 2009 appears WebGL and the doors to a 3D web are definitively open ([28]). WebGL specification is based on OpenGL ES 2. Even if it is only a draft, it already have been implemented by the majors web browsers and plugins have been provided for those that don’t support natively WebGL ([23]). WebGL gives us the possibility to use 3D hardware acceleration from the JavaScript of web pages, like OpenGL does for desktop 3D applications. It’s integration with HTML5 give the possibility to directly embed on web pages complex interactive 3D scenes.
Recently a new web based 3D format is being adopted: XML3D. This is the only major web 3D format that is not supported by Web3D Consortium, however is a candidate to become a WC3 standard. Unlike the others formats, the main goal of XML3D is to be an extension to HTML5 specification ([33]). The authors claim that even if using X3D or VRML we can integrate 3D content to a web page, the separation of the two concepts is to well defined. On his side XML3D definition is based on others successful standards of W3C like HTML, DOM and CSS. All the interactions with the 3D scenes are made using the web standard way, i.e. using DOM events and JavaScript. XML3D is independent of the 3D rendering API used, in [34] the authors use a modified version of Chromium Browser that use OpenGL, however the top rendering technology for XML3D is WebGL.
2.1.2
Web 3D GIS Clients
The result of a GetScene request from a W3DS is a 3D scene encoded in a specific format that need to be interpreted and rendered by a graphical engine. Such requirement requires clients with extra capabilities. The W3DS specification [31] identifies three types of clients and classify them according to they complexity degree: thick, medium and thin. In Figure 2.2 we can see the balancing scheme between the client and server for every type of client.
The pipeline for 3D GIS data visualization is composed of four major steps: data access, scene preparation, rendering and visualization. For every type of client the that
data is accessed on server and visualized on the client side. A thin server like WFS require a very powerful client capable a generate 3D content from 2D data. On the opposite side a thick server like Web Perspective View Service (WPVS) [20] would be responsible to render the 3D scene from a certain perspective and send only that frame to the client. On the middle we have W3DS were the server side produce the 3D scene and the client is responsible for rendering and visualization.
The most well know and used 3D client is certainly Google Earth which is capable of handling 3D scenes encoded in Keyhole Markup Language (KML) and works on most of the platforms (windows, linux, android and a web plugin is also available). Google Earth belongs also to a particular subset of clients: 3D globes, who have become the most common and intuitive way to visualize and interact whit 3D GIS data.
In most of the cases, a georeferenced 3D scene to appear in a familiar spatial context requires at least two other components: a sky and a DTM. That integration is not always trivial, mostly the positioning on the DTM, 3D globes give that for free. The references [35],[18] and [32] gives a good overview about the fundamentals and challenges behind 3D globes.
Lately several globes have emerged from different sources, however most of them only serve as proof of concept without capabilities to support real use cases. One of the most promising ones is OpenWebGlobe, which already showed the capabilities to support real applications needs and implement some high level features like point cloud streaming support ([22]).
For some use cases using a 3D globe to represent georeferenced 3D scenes is not suitable, in that situations we need libraries that provide mechanisms to facilitate the makeover of custom clients, like OpenLayers does for 2D web mapping. If we follow the advice of W3DS specification and encode our scenes in X3D the X3DOM library will be indispensable [4].
X3DOM appears around 2009 and is development is mainly supported by Fraunhofer IGD, is main objective is to provide an integration between HTML5 and X3D. WebGL or
Flash can be used as back-end rendering API, however Flash is only used when WebGL is not available. X3DOM helps the development of custom clients providing a intuitive way to integrate 3D scenes to web pages and interact with them.
From non web based clients the library OsgEarth, build on top of Open Scene Graph, provides a good set of functionalities. OpenLayers3 is currently being developed and if it reach is objectives it will certainly become on of the most useful library for build 3D web GIS clients.
Figure 2.2: Types of clients as described on W3DS specification (Source [31] ).
2.2
Web Services Architectures
The OGC Reference Model (ORM) [17] introduce some OGC standards and discuss why they are fundamental to modern GIS applications. It also provides an overview about the different types of architectures that can be build on the top of that standards. Most of that architectures are web based and are closely related with others open standards promoted by open organizations like the World Wide Web Consortium (W3C).
successful GIS applications is interoperability. The non-interoperability leads to complex GIS applications with limited resources and an high cost of development. Interoperability guarantee the share of data and computation resources between different organizations. ORM references the [8] and [9] whites papers that provide a interesting discussion about interoperability.
The WMS and the WFS are good examples of interoperability achieved through open standards based on web architectures. Since the development of WMS and WFS a consid-erable amount of other web based services have been developed by OGC. Implementations of OGC web services tend to be grouped in map servers. It is a wise approach, since com-mon aspects of the implementation are only implemented once. We also benefit in having a common architecture for a group of services.
2.2.1
OGC Web Services
OGC interoperability is mainly based on service oriented architectures. OGC services have a well defined interface that is described by a standard. A service will receive requests and use its parameters to execute operations. In most of the cases a result or an exception message will be returned. Services can be chained, i.e. a service can invoke others services and is execution can be distributed. With this approach we reach an high decoupling between the client and the server side implementation. The reference [17] provide a good overview about OGC service architectures.
Most OGC services act as high level APIs to access data sets in a variety of ways, like WMS or W3DS service for example. Other services, like the Web Processing Service (WPS), are used to make powerful computations over large data sets. In the document [16] OGC introduces the OGC Web Service (OWS), which is a service interface that define some properties and guidelines that should be implemented by others OGC services. OWS interface standard focus on three major common aspects:
• Operations and request contents, i.e. common operations that should be imple-mented by all OGC services.
• Parameters and data structures included in operation requests and responses that are common to all operations.
• Extensible Markup Language (XML) and Keyword Value Pair (KVP) encoding of operation requests and responses.
Currently only a common operation is defined, the GetCapabilities operation. This operation is mandatory in every service that implement the OWS interface. The main goal of this operation is to provide information about the service and the available content. Service information include the available operations description and metadata about the service. The available content will change from a service to another. For example, the available content returned by a GetCapabilities operation from a WMS will contain information about the existing layers and the available styles.
Three mandatory parameters common to all services that implement OWS interface are defined: service, version and request. The service parameter identifies the service which the request is destined. Note that frequently the URL path already reference the service, but the service parameter should always be used to identify the service regardless to the URL. The version parameter identifies the version of the service that should be used. Generally map servers are very permissible with this parameter, if the provided versions is invalid or not available the most recent version existing on the server will be used. The request parameter identifies the service operation that should be executed, regardless to others parameters or anything else.
Other optional parameters that frequently appear are also described. One of them is the crs which represents a coordinate reference system in the European Petroleum Sur-vey Group (EPSG) form, for example EPSG:4326. Another frequent parameter is the bbox which represents a referenced bounding box and match this format minX,minY,maxX,maxY. Sometimes a parameter is associated to a list of items, for example the WMS style parame-ter. Lists are represented as sequence of items separated be a coma, like style1,style2,... for example.
The HTTP protocol supports two request methods: POST and GET. A service that implement the OWS interface must at least provide one of this methods, both can also be provided. GET requests should be encoded in KVP. A GET request URL is composed of the URL path followed by a question mark ? and ended with a list of server-specific parameters of the form name=value&. In a POST request the parameters are transmitted in the body of the message that can be encoded as XML document formatted as specified by one or more XML schemas.
2.2.2
Map Servers
A map server is a web architecture based software that normally implement several OGC services. This are the common aspects of every map server. However, as they evolve as a software project they tend to favor some technologies and some standards in favour of others. These differences with the time become stronger and produce a set of map servers that provide the same core functionalities but in a different way.
This differences affects both user and developers in different ways. For most of the users the main differences will be related with software usability. For example, some map servers provide a graphical user interface and others not. Developers are concerned with the core architecture and the technology stack. Working in a project written in C++ or in a project written in Java involves a lot of differences.
MapServer, Deegree and GeoServer are three major map servers. Their success is mainly due to the enormous quantity of standards they support, their extensible archi-tectures and the diversity of the community behind them, which involve some of the major players in the GIS field. However, conceptually their are very different. They take different approaches on several fundamentals aspects of their architectures. Although, the OGC standards on which they relies guarantee the interoperability between them.
MapServer is an open source set of tools that can be used to produce several types of spatial applications. It was originally developed by the university of Minnesota for the ForNet project in cooperation with NASA and Minnesota Department of Natural
Resources (MNDNR). The core of MapServer is write in C but it provides bindings for other languages like Java, .NET, Python, Ruby, PHP and Perl.
In is most reduced form MapServer can be seen as a rendering engine for maps. It can be installed as Common Gateway Interface (CGI) script that will interpret the request parameters and produce a map based on a MapFile. For most advanced use cases it can be used to make available OGC services like WMS or WFS. MapServer can be extended in a variety of ways and also be used as an API by other programming languages.
Deegree is an open source project written in Java developed by lat/lon. It implements a great number of OGC standards and is the reference implementation for some of them. It also implements some of the new 3D OGC candidates services like the WPVS. Deegree provides the components necessary to build a Spatial Data Infrastructure (SDI) in a modular way.
Deegree is composed of five major products. The Deegree web services which contains the implementations of the OGC services. The iGeoPortal which is the web based portal framework of Deegree project. The iGeoSecurity that contains security related compo-nents. The iGeo3D product who is related with the storage and visualization of 3D geodata. The iGeo3D product doesn’t includes W3DS. The iGeoDesktop that represent the SDI desktop GIS of Deegree.
GeoServer is an open source geospatial driven server written in Java. The heart of GeoServer is interoperability. It reads data from the major spatial data sources and publishes it using OGC services. GeoServer is the reference for the OGC WFS and WCS services. It also a high performance certified compliant WMS implementation.
GeoServer is built on the top of recent Java technologies like Maven and Spring Framework. It includes in is software stack other import geospatial libraries like Java Topology Suite (JTS) and GeoTools. GeoServer have a modular architecture that can be easily extended. It is supported by a powerful community and have clear policies related to the development process.
Chapter 3
Web 3D Service
The Web 3D Service (W3DS) is a portrayal service proposal for three-dimensional spatial data. The first proposal was presented back in 2005 by Kolbe and Quadt [30]. Since then, some improvements were integrated. In 2009, version 0.4.0 was accepted as public discussion paper by the Open Geospatial Consortium (OGC). Afterwards, a version 0.4.1 was rewritten. This is the last version available, and it dates from 2011 [31].
The W3DS service delivers scenes, which are composed by display elements repre-senting real world features. It does not provide the raw spatial data with attributes, like the Web Feature Service (WFS) service does. It only provides a view over the data, accordingly, for example, to the level of detail.
Unlike the Web Map Service (WMS), it does not provide rendered images. It filters the data to be delivered according to several parameters, like a bounding box, but the result will be a graph of nodes with properties attached to each node, like shapes, materials and geometric transformations.
This graph of display elements must be handled by the client. W3DS clients must im-plement the necessary logic to take advantage of the W3DS operations. Typically, clients will continuously request scenes from the service, trying to minimize the data delivered to the client, while providing the best user experience. All four proposed operations, tagged as mandatory or optional are listed in Table 3.1.
Operation Use GetCapabilities Mandatory GetScene Mandatory GetFeatureInfo Optional GetTile Optional Table 3.1: W3DS operations.
Like other OGC services, information about the service, the supported operations, available layers and their properties, can be retrieved using the GetCapabilities operation. The GetFeatureInfo operation returns information about the features and their attributes. In the previous versions of the standard a GetLayerInfo operation was also available, it possible to obtain information about the layer.
Two operations are provided to return 3D data: GetScene and GetTile. These two operations differ essentially in how the features are selected. GetScene allows the defini-tion of an arbitrary rectangular box to spatially filter the features to compose the scene returned to the client. GetTile returns a scene on-the-fly formed by features within a specific delimited cell, within a well-defined grid.
3.1
GetCapabilities
Like all OGC services that implement the OGC Web Service (OWS) interface, W3DS im-plements the mandatory GetCapabilities operation. As defined in the OWS standard this operation will return information about the abilities of the server. W3DS specification also says that this operation should preferentially be invoked by HTTP GET requests and the result should be Extensible Markup Language (XML) base encoded. The Get-Capabilities operation can be requested using only the OWS mandatory parameters, i.e. the service, request and version parameters. In Listing 3.1 is represented a KVP encoded GetCapabilities for a GET request.
Listing 3.1: KVP encoded GetCapabilities for GET request.
1 http://3dwebgis.di.uminho.pt/geoserver3D/w3ds? 2 SERVICE=w3ds&REQUEST=getCapabilities&VERSION=0.4.1
The result of the W3DS GetCapabilities request includes the standard content, i.e. meta information about the server and a description about is content. Although, the content description also contain some optional elements specific to W3DS. At the top level of content description we have the optional layers and background elements. The layers description, beyond the standard content, also contains the queryable and tiled optional properties. It also contains two extra optional elements: the LodSet and the TileSet elements.
The background element provide meta data that describe a background available for a GetScene request. Backgrounds are useful when we use a simple client that just renders the scene produced by the server without adding any extra content. Extensible 3D (X3D) have a default element to add a background to X3D scenes. A background can be an image, a simple color or a degrad´e for example. The background element is ignored by more advanced clients, like Google Earth for example.
The layer description queryable property is used to indicate if the layer supports the GetFeatureInfo operation. Sometimes is useful to deactivate the GetFeatureInfo operation for layers that have a lot of noise information, like Digital Terrain Model (DTM) layers, or for layers that contain sensitive information. The tiled property identifies the layers that support the GetTile operation. A layer that support the GetTile operation must be tiled and its description must contain a TileSet element.
The LodSet element describe the Level Of Detail (LOD) available for a layer. A layer with a LodSet provide several representations for the objects it contains. A layer that contains 3D buildings is a typical candidate for a LodSet. A building can at least have three different representations. The first will be a simple representation of the building using only 3D primitive geometries like box or pyramids. The second representation will include some simplified textures and features of the building. The third representation
provides a very detailed representation of the building. Sometimes a four level that provide the indoor of the building is also provided.
Some layers are suitable to be provided as a set of adjacent rectangular tiles. DTM layers are the typical candidates to be tiled. Using the GetTile operation we can efficiently access a tile using is level, row and column. To know which tiles to request a client need information about the available levels and the base grid. This information is provided by the TileSet element. In Listing 3.2 is represented a TileSet.
The LowerCorner element gives us the minimum X axis and Y axis coordinates of the base grid. The TileSizes are related by powers of two and provide information about the existing number of levels and the size of the tiles of each level. The NumBaseCols and NumBaseRows elements give us respectively the number of columns and the numbers of rows of the base grid. A TileSet can be seen as a pyramid of images or a quadtree structure, it provide an efficient way to store and access spatial data.
Listing 3.2: Example of a TileSet element.
1 <TileSet>
2 <Identifier>dem_tileset</ows:Identifier> 3 <CRS>EPSG:4326</CRS> 4 <TileSizes>180 90 45 22.5 11.25 5.625 2.8125 1.40625 0.703125 0.3515625 0.17578125</TileSizes> 5 <NumHeightLevels>1 1 1 1 1 1 1 1 1 1 1</NumHeightLevels> 6 <LowerCorner>-180.0 -90.0</LowerCorner> 7 <NumBaseCols>2</NumBaseCols> 8 <NumBaseRows>1</NumBaseRows> 9 </TileSet>
3.2
GetScene
The mandatory GetScene operation is the principal operation of W3DS. Is goal is to compose a 3D scene from the available GIS data. A 3D scene can be composed of a
variety of elements, from natural world to man made structures. A 3D scene can also contain elements that will be used in the rendering process, like a background or a light source. Scenes produced by GetScene operation to be visualize require a client capable of renders 3D content. Several scenes can be merged by the client in order to provide the best user experience.
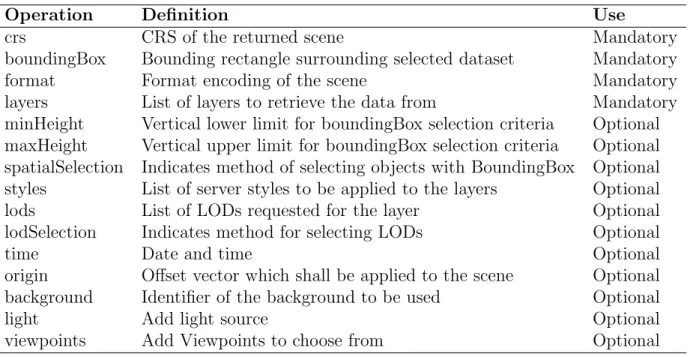
In Table 3.2 are listed all the available parameters that can be used in a GetScene request. Four mandatory parameters and eleven optional parameters are available. Note that the mandatory parameters inherited from OWS interface have been omitted.
Operation Definition Use
crs CRS of the returned scene Mandatory
boundingBox Bounding rectangle surrounding selected dataset Mandatory
format Format encoding of the scene Mandatory
layers List of layers to retrieve the data from Mandatory minHeight Vertical lower limit for boundingBox selection criteria Optional maxHeight Vertical upper limit for boundingBox selection criteria Optional spatialSelection Indicates method of selecting objects with BoundingBox Optional styles List of server styles to be applied to the layers Optional
lods List of LODs requested for the layer Optional
lodSelection Indicates method for selecting LODs Optional
time Date and time Optional
origin Offset vector which shall be applied to the scene Optional background Identifier of the background to be used Optional
light Add light source Optional
viewpoints Add Viewpoints to choose from Optional
Table 3.2: W3DS GetScene operation parameters.
The crs parameter let us define the coordinate system that should be used for a specific request. The used crs must appear as available in the result of the GetCapabilities operation. If any of the requested layers is project in a different coordinate system the service is responsible to transform it to requested one. If the layer can’t be transformed an exception should be returned.
We define the spatial sub set of data that should be used using the boundingBox parameter. The boundingBox can have two dimensions, i.e. be a rectangular space along the X and Y axis or having 3D dimensions using the Z axis to define lower and upper
vertical limits. If the bounding box is invalid an exception should be returned. Note that if the boding box is outside the valid range of the coordinate reference system its still valid but an empty scene must be returned.
A scene can be encoded in any format available on the server. The reference format to encode the produced scenes is X3D. As already referenced, a scene can contain elements that are used in the rendering process. X3D supports all elements defined in the specifi-cation, from backgrounds to models with different LODs. Al tough, other formats may not support that elements, for example KML will not support extra light sources. The server should silently ignore that elements if the requested format don’t support them.
The layers parameter let us define the layers that should be included in our scene. The parameter contains a list of identifiers separated by a comma. The order in which the layers appear should not affect the final visual aspect of the scene. Each requested layer must appear in the GetCapabilities response as a valid layer. Tiled layers can also be used in GetScene requests. The specification don’t specifies the result if a layer is invalid.
Most of Geographic Information Systems (GIS) libraries are not prepared to deal with 3D bounding box. The minHeight and maxHeight parameters are an alternative to add a lower and a upper vertical limit without using a 3D dimensional bounding box. The spatialSelection parameter is also related with the bounding box parameter. It give us control about how the intersections between the bounding box and 3D elements are handled.
Three values are possible to the spatialSelection parameter: overlaps, contains_center and cut. The default value is overlaps, if the bounding box intersects any geometry of the model this one should be considered. In the contains_center method the model is added to scene only if the bounding box contains is center. The center of the model should be computed using is convex hull. The cut spatial selection method defines that only features that are completely contained by the bounding box should be returned. Features that intersects the bounding box should be splitted.
The styles and lods parameters are lists which the length must be equal to the length of the list in the layers parameter. Each element must correspond to a layer. An empty space can be used, meaning that the default value of the correspondent layer should be used. The styles parameter let us define the style that should be applied to a layer. If a style is invalid the default one should be used in substitution. The lods parameter let us define for each layer which LOD should be used.
The lodSelection parameter tells the server how it should interpret LOD values. Three values are available: equals, equals_or_smaller and combined. The default value is equals, with this method a model is included only if it have a LOD that correspond to the requested one. The equals_or_smaller defines that if requested LOD is not available for a model the next lower LOD should be used. Although, if no lower LOD is available the feature should be omitted from the scene. The combined lets the server includes several LODs for the same model. In this case the client is responsible to select the correct model LOD tor tenderize based on the viewpoint.
The five last optional parameters, i.e. time, origin, background, light and viewpoints are associated with the rendering process. They are very tied to the X3D format. In practice, most of the optional parameters are omitted. Typical GetScene requests are similar to the one showed in Listing 3.3.
Listing 3.3: KVP encoded GetScene for GET request.
1 http://3dwebgis.di.uminho.pt/geoserver3D/w3ds? 2 VERSION=0.4.1& 3 SERVICE=w3ds& 4 REQUEST=GetScene& 5 CRS=EPSG:4326& 6 FORMAT=model/x3d& 7 LAYERS=buildings_3d,dem_3d& 8 BOUNDINGBOX=-8.301200,41.437741,-8.294825,41.444161& 9 STYLES=buildings_by_type,dem_texture_igp
3.3
GetFeatureInfo
A basic use case for any GIS is the possibility to click on a feature of the map and obtain some information about it. W3DS provide the optional GetFeatureInfo operation for that use case. Without being a operation so complex as GetScene operation for example, is implementation involve some interesting challenges.
The main challenge is to return information about the correct feature. Lets say we are exploring a 3D scene composed of three kind of layers: DTM, buildings and street furniture. We want obtain some information about a street lamp. Depending on the distance between our viewpoint and the lamp we will more or less precisely click on the lamp. If the lamp is near a building and have other furniture like trees around it can be difficult to precisely select the correct feature.
In Table 3.3 are listed all the available parameters that can be used in a GetFeature-Info request. OWS interface inherited parameters have been omitted. Four mandatory parameters and one optional parameter are available.
The crs parameter is used to define in which coordinate system the coordinate param-eter should be interpreted. The specification don’t precise if coordinates that eventually appear in the result should be transformed. Although, if possible it will be a good practice to guarantee that all the returned coordinates will be project on the requested coordinate system.
The layers parameter have the same function that it have in the GetScene operation. The only particularity is that a layer to be considered by GetFeatureInfo operation must be tagged as queryable in the result of GetCapabilities operation.
The format parameter let us define the format in which the result should be encoded. The most common are XML based ones or JSON.
The coordinate parameter represents a coordinate on the request coordinate reference system. The coordinate can have a Z value, by default Z value is considered to be zero. Is based on this parameter that the server will try to select the correct feature from where
information should be returned. If not feature can be found a the given position a empty result should be returned.
The natural way of implementing the feature selection algorithm is to define an offset and return all the features that lies on the produced area. In W3DS GetFeatureInfo we will use a sphere centered in the coordinate parameter and consider as candidate features all the ones that lies inside that sphere. The featurecount parameter give us a way of limiting the number of features from where return information. By default only one feature should be used.
Operation Definition Use
crs Coordinate Reference System Mandatory
layers List of layers to retrieve the data from Mandatory
format Response encoding format Mandatory
coordinate Position to search for features Mandatory
featurecount Maximum number o features that should be considered Optional Table 3.3: GetFeatureInfo operation parameters.
Typical GetFeatureInfo requests are similar to the one showed in Listing 3.4. Listing 3.4: KVP encoded GetFeatureInfo for GET request.
1 http://3dwebgis.di.uminho.pt/geoserver3D/w3ds? 2 VERSION=0.4.1& 3 SERVICE=w3ds& 4 REQUEST=GetFeatureInfo& 5 CRS=EPSG:4326& 6 FORMAT=application/json& 7 LAYERS=buildings_3d& 8 COORDINATE=-8.301200,41.437741,220& 9 FEATURECOUNT=10
3.4
GetTile
The usual way to select a sub set of spatial data is by defining a rectangular bounding box which is used as spatial selection filter. This method provides a great flexibility and
can be used to select data from several layers, however to some kind of layers it can be very expensive to compute that selection. In some use cases is preferred to have pre computed sub sets of the data. We refer to that sub sets of data as tiles. In the context of W3DS, typical candidates layers to be tiled are terrains and 2.5D layers.
A tiled space can be seen as a georeferenced grid where each cell will correspond to a tile. A tile is characterized by its row number, column number and level. Tile level value is related to the LOD concept. The tiles size between levels should always be related by powers of two, i.e. a tile of level zero will correspond to four tiles of level one and so on. All levels share the same origin and tiles of several levels should seamlessly fit together in a heights-resolution scene.
W3DS provide the optional GetTile operation to access tiled layers. The GetTile parameters are listed in Table 3.4. Parameters inherited from OWS interface have been omitted. Are available six mandatory parameters and two optional parameters.
Operation Definition Use
crs Coordinate Reference System Mandatory
layer Identifier of the layer Mandatory
format Tile encoding format Mandatory
level Level of requested tile Mandatory
x Row index of requested tile Mandatory
y Column index of requested tile Mandatory z Height level index of requested tile Optional style Identifies of server style to be applied Optional Table 3.4: GetTile operation parameters.
As usual a crs parameter is provided. If the tile available on the server is not projected on the requested coordinate reference system the server is responsible to transform it to the requested one. If the tile can’t be transformed to the requested coordinate reference system an exception should returned.
GetTile operation can only use a layer per request. The used layer must be marked as tiled and have an associated TileSet, otherwise an exception should be returned. The optional style parameter let us specify a style that should be applied to the returned tile. The format parameter have the same function as the same parameter in GetScene
operation.
We identify the tile that we want using the x, y and level parameters. A tileset can define a vertical stratification for certain tiles. The optional z parameter let us select a specific vertical tile. By default all vertical tiles are selected. The specification don’t defines the response to return if a requested tile is not available.
The Listing 3.5 show an example of a POST GetTile request with the most common parameters.
Listing 3.5: XML encoded GetTile for POST request.
1 <GetTile service="W3DS" version="0.4.1" request="GetTile"> 2 <CRS>EPSG:27492</CRS>
3 <Format>model/x3d</Format> 4 <Layer>dtm</Layer>
5 <Level>1</Level> 6 <X>5</X>
7 <Y>7</Y>
8 <Style>igp_texture</Style> 9 </GetTile>
3.5
Styling
Any service who’s objective is to provide a view over GIS data needs to give some mech-anism to configure the final visual aspect of the produced view. The normal way of doing this is to provide a style parameter who references the style we want to apply to our view. WMS GetMap operation and W3DS GetTile and GetScene operations provide such mechanism.
Once we know the style to apply to our view we need to find and interpret the requested style and provide a view according to his definitions. The power of styling cannot be underestimated, different styles can tell us different thinks using exactly the same data. This is why is important to guarantee interoperability between map servers
and their implementation of styling.
WMS is typically associated with the Styled Layer Descriptor (SLD) standard [12] who defines styling capabilities for 2D maps. Around 2009 was submitted to OGC, by the team behind W3DS draft standard, a candidate draft for a styled layer descriptor profile for 3D portrayal services standards [14]. If the currently 3D services OGC candidates, i.e. W3DS and WVS become OGC standards the document [14] should be merged with the SLD standard.
Styling 3D capabilities have not yet be extensively explored by the community. The main possibilities given by 3D styling are related with the rendering process and the inclusion of 3D extra models. We can for example change the lighting model or some rendering algorithms. Billboard elements like trees can be added at runtime to the scene using styles reducing server side complexity.
In Figure 3.1 we can see a styling example. The server style change the rendering algorithm of the terrain relating the elevation with different colors. The trees models are changed to more detailed ones and the aspects of the buildings are also changed.
(a) Default styles. (b) Server styles.
Chapter 4
Architecture and Implementation
One of the main steps in a software project is the definition of is architecture. The implementation of the Web 3D Service (W3DS) is straight forward in terms of its func-tionalities, since all the operations and protocols are well defined in the specification. The main challenge will be the integration of our implementation in the architecture of an existing open source map server.
There are several Open Geospatial Consortium (OGC) compliant and reference open source implementations of several web map services, like GeoServer, MapServer or Dee-gree. It is wise to use such implementations to develop the W3DS component, taking advantage of existing code to manage the request pool, parsing the operations and other common tasks.
We choose to develop the W3DS component on top of GeoServer. It has detailed technical documentation, has clear policies regarding new contributions and uses recent development tools. It is written in Java and uses sophisticated technologies making it easier in terms of flexibility, extensibility and maintainability. These three design goals are particularly important in projects like GeoServer, since it implements several different web services and it is used by a large community.
In the first part of this chapter we will present our base framework. In the second chapter we will provide and overview about the main Java technologies used in our
implementation. In the last part we will describe our implementation and is integration in GeoServer architecture.
4.1
Base Framework
GeoServer is a mature open source map server build in Java. Is being used by several organizations in production environments for years. One of is main design goal is in-teroperability. He reads data for major spatial data sources and publish it using open standards. GeoServer is supported by a multidisciplinary community composed of indi-viduals and organizations from around the world.
GeoServer is the reference implementation of Web Feature Service (WFS) and Web Coverage Service (WCS) and its Web Map Service (WMS) implementation is OGC certified. Several other OGC standards are also supported like Geography Markup Language (GML), Keyhole Markup Language (KML), Styled Layer Descriptor (SLD) or Web Processing Service (WPS). Some vendor-specific extensions are provided for the implemented standards. Although not portable this extensions turns GeoServer more powerful.
Another aspect of GeoServer highly appreciated by users is the graphical web interface. That interface allow users to easily in a intuitive way manage their GeoServer instance. They can configure several aspects of the server from the log level through the layers and data-sources. It also give us the possibility to interact with the server using demo requests or even preview user published layers.
Being a community-driven and a very extensible project, GeoServer receives several open-source contributions from the community. That contributions can extend GeoServer in a variety of ways and can become problematic to maintain if not correctly managed. Based on this, in order to contribute to GeoServer we need to follow some contributing rules available on GeoServer wiki.
There are several ways to generate a valid patch, GeoServer documentation refer three: GitHub pull request, Git diff and Unix diff. W3DS module was proposed as a GitHub pull request. A GeoServer module can be classified as: core, extension or community.
Core modules are the ones distributed in the main distribution. Grossly classified they fall on two categories: architectural and functional. Architectural modules provides the base objects required by any other GeoServer module to work. The platform module is a good example of an architectural module. Functional modules provides functionalities that will be used by common users. WFS, WCS and WMS can be considered functional modules.
Extensions modules are provided as separated artifacts from the main distribution. They typically implement stable functionalities that are useful for some users but not for all. To activate an extension we only need to add is artifact to the class-path of the main distribution. An extension module must respect some requirements, like having a maintainer, a defined road-map or a significant code tests coverage. An extension module can be retrograded to a community module if its fail some of that requirements or become problematic for any other reason.
The requirements for a community module are really low, we only need the approval of one Project Steering Committee (PSC) member. Core modules and extensions started as community modules. When a community module become stable enough it maybe promoted to an extension or core module. Community modules group all the unstable or experimental modules that are not part of the release process. At the moment W3DS is a community module.
4.2
Java Technologies
The choose of GeoServer as our map server dive us in the Java world. Along the years Java has made is entry in most of the fields of software engineer and still influencing it. Java technologies have reached an high degree of maturity and successful projects are
using them from years.
Java Enterprise Edition (Java EE) is a specification that provide an environment to run professional Java applications. Java EE applications are made of several components that run on an applicational server. GlassFish is the reference implementation for Java EE specifications, however it exists other well know and widely used implementations like JBoss, WebLogic, WebSphere and more recently TomEE.
GeoServer is made to run on Java EE environment, although only a small subset of Java EE components are used. The Java EE components needed by GeoServer are available in some light applicational servers like Tomcat or Jetty. Most of the available examples for GeoServer run on Tomcat and uses Jetty for is integration tests.
GeoServer includes in is software stack a considerable amount of other third party libraries like Java Topology Suite (JTS) or GeoTools. In the next sections we will de-scribe to important projects on which also GeoServer depends: Maven and the Spring Framework. We focus on this two dependencies because their are mainly responsible for the high maintainability and extensibility of GeoServer.
4.2.1
Maven
Maven is an open-source build automation tool for software projects, mainly used for Java projects it can also take care of projects written in other languages like C# or Scala. Maven purchase the same objective as Unix Make command or Ant tool, but is based on different concepts. Unlike Make or Ant were we need to define the build tasks of our project in Maven we use a declarative approach, i.e. we describe our project and let Maven create the build tasks for us.
The plugin architecture on which Maven is based grants him an high capacity of ex-tensibility. Some of is base behavior is given by plugins like the dependency management. Plugins can be used for several proposes like IDE integration or even add support for a new language. A plugin can be associated with one or more Maven goals. The big num-ber of existing maven plugins have contributed to turn maven in a Swiss army knife for
build modern and flexible applications.
Another appreciated aspect of Maven are the standard procedures he introduces. A developer already introduced to Maven will easily understand the structure of a new project based on Maven. No time will be spend understanding obscure build scripts or IDE custom project source folder organization.
Project Structure
Maven give us the possibility to separate our projects in several modules that have they own life cycle. A module can contain any piece of the architecture and can also contains sub-modules which let us group components of our architecture by some criteria. Such granularity can be used to have a flexible code organization.
The concept of modules can be coupled with the profile support given by Maven. Profiles allow us to activate or deactivate some build goals based on some criteria. One of the typical use cases for profiles is the running control of tests. When used with modules profiles can be used to control which components are included in the final distribution or even to produced several distributions.
Maven defines a standard structure for its projects. Its possible to redefine the default locations but its highly recommended to follow the standard structure. Configurations will be short, it will be easy to integrate new plugins and the learning curve for a new member of the project will be shorter.
Even following the standard structure of Maven a module can become very complex, but the complexity is hierarchized in sub-directories. The top module folder contains a pom.xml configuration file. A src folder that will contain all the necessary elements to build the module. A target folder where will be saved all the output produced by the build process.
Sometimes on big projects also appears the bin and conf folders. The first contains some executable scripts need by the build process. The second contain some configuration files that are used by the resources Maven plugin. At this level are also expected metadata
folders like the ones used by SVN, CVS or GIT.
The src folder typically contains a main folder and a test folder. The first will contain the elements used to build the main artifact and the second the unit tests. Sometimes this level also contain an it folder which contains the integration tests. The directory structure of the level below these folders is similar. Typically it will contain, for Java modules, a java folder and a resource folder.
In the case of an aggregator module, i.e. a module used to group a set of sub-modules. The top level will contain a pom.xml file and the sub-modules folders. The pom.xml will reference the sub-modules using the modules section as show in Listing 4.1. Note that the type of packing for the aggregate module is pom.
Listing 4.1: Multi-module pom that aggregate some data base drivers.
1 <project>
2 <groupId>org.example</groupId>
3 <artifactId>data-base-drivers</artifactId> 4 <packaging>pom</packaging>
5 <name>Data Base Drivers</name> 6 <version>1.0-SNAPSHOT</version> 7 <modules>
8 <module>postgres</module> 9 <module>oracle</module> 10 </modules>
11 </project>
Pom
The core component of a Maven module is the Open Web Service (OWS), an Extensible Markup Language (XML) based document were we describe our module properties like the version, dependencies and plugins configurations. In Listing 4.2 we can see a basic pom example that will produce a jar artifact and have a dependency to the JDBC PostGres database.
A Maven artifact is uniquely identified by is groupId, artifactId, version and type and is the result of a Maven build. An artifact can be of any type, most common are: jar, war, zip and ear. By default a produced artifact is always uploaded to the local maven repository but can be also be upload to any other repository using the deploy command. An artifact can be requested by other Maven projects using the dependency tag.
Listing 4.2: Simple pom example.
1 <project>
2 <modelVersion>4.0.0</modelVersion> 3 <parent>
4 <groupId>org.example</groupId>
5 <artifactId>data-base-drivers</artifactId> 6 <version>1.0-SNAPSHOT</version>
7 </parent>
8 <groupId>org.example</groupId> 9 <artifactId>postgres</artifactId> 10 <version>1.0-SNAPSHOT</version> 11 <dependencies>
12 <dependency>
13 <groupId>org.postgresql</groupId> 14 <artifactId>postgresql</artifactId> 15 <version>9.2-1002-jdbc4</version> 16 </dependency>
17 </dependencies> 18 </project>
In a multi-modules projects, which is frequently the case, properties, dependencies and plugins configurations can be inherited by sub-modules using parent element. The postgres module (Listing 4.2) will inherit content from is parent data-base-drivers (Listing 4.1).
In big multi-modules projects is common to have in the top pom the sections: depen-dency management and plugin management.
The dependency management let us declare dependencies that won’t be inserted in the final distribution unless a sub-module depends on it. To use a dependency that have been declared in the dependency management a sub-module only need to use the groupId and artifacId. It this mechanism the dependencies of the hole project are managed in one place.
The plugin management section is the place where we configure the default behavior and properties for most of the used plugins, like its version for example. Although the plugin will run only for the plugins who declare it. The plugin configuration defined in the plugin management is inherited by all the sub-modules and will me merged it any configuration existing in the sub-module.
Build Life Cycle
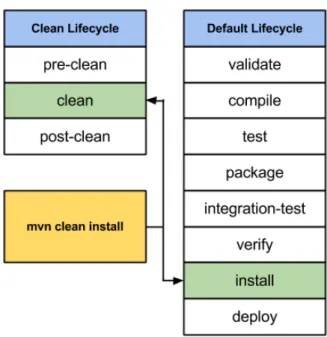
The build life cycles are a good example of the standard procedures introduced by Maven. A build life cycle clearly defines the process for building and distributing some artifact. Maven come with three build-in life cycles:
default handles the building, testing and deployment of the project. clean handles the project cleaning.
site handles the creation of the project site documentation.
A build life cycle is composed of several build phases. When we execute the Maven command mvn install we are executing the build phase install of the Maven default life cycle (Figure 4.1). Build phases are executed sequentially, i.e. when we call the install build phase all the previous build phases will also be executed.
Build phases are made of goals. A goal represent a well bounded an defined task. A goal can be associated with zero or more build phases. A goal can be directly called outside any build phase or build life cycle. A frequently used one is the eclipse:eclipse goal which use Maven Eclipse plugin to produce IDE integration files.
![Figure 2.1: 3D CAD models that represent the 3D entities and the DTM, as proposed by Cambray in 1993 (Source [6] ).](https://thumb-eu.123doks.com/thumbv2/123dok_br/17760753.835607/19.892.259.642.842.988/figure-cad-models-represent-entities-proposed-cambray-source.webp)
![Figure 2.2: Types of clients as described on W3DS specification (Source [31] ).](https://thumb-eu.123doks.com/thumbv2/123dok_br/17760753.835607/23.892.203.685.369.722/figure-types-clients-described-w-ds-specification-source.webp)
![Figure 3.1: Example of 3D styles (Source [12] ).](https://thumb-eu.123doks.com/thumbv2/123dok_br/17760753.835607/39.892.109.790.648.945/figure-example-d-styles-source.webp)