Revista Brasileira de Estudos Regionais e Urbanos (RBERU) v. 13, n. 3, p. 309-339, 2019
http://www.revistaaber.org.br
INTER-INDUSTRY RELATIONS AND AGGLOMERATION ECONOMIES IN BRAZIL: AN APPROACH BASED ON FIRM CREATION*
Patrícia Araújo Amarante
Professora Adjunta do Departamento de Ciências Sociais Aplicadas da Universidade Federal da Paraíba (UFPB), Campus III.
E-mail: [email protected] Magno Vamberto Batista da Silva
Professor Associado do Departamento de Economia da Universidade Federal da Paraíba (UFPB), Campus I. E-mail: [email protected]
Paulo Aguiar do Monte
Professor Associado do Departamento de Economia da Universidade Federal da Paraíba (UFPB), Campus I. E-mail: [email protected]
ABSTRACT: This study analyzes the effects of the agglomeration mechanisms proposed by Marshall (1920) on the intensity of the economies of localization and urbanization in the manufacturing industry, based on the creation of companies in Brazilian municipalities between 2011 and 2013. For this purpose, the following two-stage procedure was conducted: 1) estimation of regression models for count data to identify the type of agglomeration economy that contributes to new firm location and 2) use of the coefficients obtained in the first stage to assess the industry characteristics related to Marshall’s agglomeration mechanisms that may contribute to differences in the strength of those economies. Due to the results obtained, localization economies are more intense in the industries that employ workers with specific skills of the sector, and thus, can share a pooling of skilled workers. Similarly, knowledge spillovers act in a way to boost the economies of localization, providing an environment conducive to the transmission of knowledge and new ideas. However, localization economies are less intense in industries that have a greater dependence on manufactured inputs and the primary and energy sectors. Urbanization economies, in turn, are negatively related to labor market pooling and knowledge spillovers. On the other hand, the effects of input sharing and dependence on primary inputs on urbanization economies are positive and statistically significant. Keywords: Firm creation; Agglomeration mechanisms; Localization economies; Urbanization economies. JEL Codes: L60; R12; R30.
RELAÇÕES INTERINDUSTRIAIS E AS ECONOMIAS DE AGLOMERAÇÃO NO BRASIL: UMA ABORDAGEM A PARTIR DO NASCIMENTO DE FIRMAS
Resumo. Este estudo analisa os efeitos dos mecanismos de aglomeração propostos por Marshall (1920) sobre a intensidade das economias de localização e urbanização na indústria de transformação, com base na criação de empresas em municípios brasileiros entre 2011 e 2013. Para esse fim, o seguinte procedimento em duas etapas foi realizado: 1) estimativa de modelos de regressão para dados de contagem para identificar o tipo de economia de aglomeração que contribui para a nova localização da empresa e 2) uso dos coeficientes obtidos no primeiro estágio para identificar as características setoriais relacionadas aos mecanismos de aglomeração de Marshall que possam contribuir para as diferenças na intensidade dessas economias. Conforme os resultados obtidos, as economias de localização são mais intensas nas indústrias que empregam trabalhadores com habilidades específicas do setor e, portanto, podem compartilhar um conjunto de trabalhadores qualificados. Da mesma forma, os spillovers de conhecimento atuam de maneira a impulsionar as economias de localização, proporcionando um ambiente propício à transmissão de conhecimento e novas ideias. No entanto, as economias de localização são menos intensas nas indústrias que dependem mais dos insumos manufaturados e dos setores primário e energético. As economias de urbanização, por sua vez, estão negativamente relacionadas com o pooling do mercado de trabalho e os spillovers de conhecimento. Por outro lado, os efeitos do compartilhamento e da dependência de insumos primários nas economias de urbanização são positivos e estatisticamente significativos.
Palavras-Chave: Nascimento de firmas; Mecanismos de aglomeração; Economias de localização; Economias de urbanização.
1. Introdution
One of the issues addressed in the literature regarding agglomeration economies is the possibility for companies and workers to take advantage of positive externalities derived from the geographic concentration of economic activities, predominantly in large urban centers, wherein they find an environment that is more diversified and prone to knowledge -sharing -prone environment (GLAESER; KERR, 2009). In this line of research, the following two types of agglomeration economies are analyzed: localization economies (MARSHALL, 1920), which derive from the benefits generated by the presence of same-industry firms in a specific region, and urbanization economies (JACOBS, 1969), wherein economic diversity benefits firms, particularly in large cities (JOFRE-MONSENY et al., 2011).
Among the methods most commonly used to quantify the effects of agglomeration economies, the research strategy based on firm creation is an underused approach, especially because firm location choice involves many determinants that are often difficult to measure, such as the technological level of firms and worker efficiency (COMBES; GOBILLON, 2014). Those studies hypothesize that entrepreneurs locate their firms based on a profit maximization analysis. In this case, the existence of evidence for agglomeration economies, which lead to productivity gains, favors concentration of firms in specific geographical locations (ROSENTHAL; STRANGE, 2004).
Dumais et al. (2002), for example, analyze the process of geographical concentration of manufacturing firms in the United States based on a dynamic approach that decomposes aggregate concentration changes into portions attributable to plant creations, expansions, contractions and closures. Conversely et al. (2003) address the geographical and organizational nature of agglomeration economies in the United States by analyzing firm creation and their employment levels.
Despite the need to assess the presence of agglomeration economies, theoretical and empirical studies have more recently focused on identifying the determinants of this phenomenon. Thus, in line with the precepts of Marshall (1920), who identifies one of the determinants of agglomeration of firms and people in external economies, this study aims to associate agglomeration economies with the following factors that affect the geographical distribution of economic activities: 1) the formation of clusters of specialized workers and the production of new ideas (labor market pooling); 2) the physical conditions of the region, such as climate and soil types, and the availability of and ease of access to production inputs and consumer markets (input sharing); and 3) the existence of knowledge spillovers.
In this line of research, studies addressing theoretical and empirical aspects have been published in the economic literature (ROSENTHAL; STRANGE, 2001; GLAESER; KERR, 2009; ELLISON et al., 2010; JOFRE-MONSENY et al., 2011; JOFRE-MONSENY et al., 2014). In the Brazilian literature, studies regarding agglomeration economies have predominantly addressed industrial employment growth and effects on wages. However, no Brazilian studies assessing those mechanisms based on firm creation have been published thus far. From the standpoint of companies, Brazilian studies have focused on industry clustering and geographical location, albeit without assessing the importance of agglomeration economies for this process. Garcia (2001), Britto and Albuquerque (2002), Rezende et al. (2012) and Sobrinho and Azzoni (2015) are examples of such studies.
In this context, the study addresses the location of new manufacturing firms in Brazilian municipalities, created during the period from 2011 to 2013, as a function of the agglomeration mechanisms proposed by Marshall (1920): labor market pooling, customer-supplier relationship and knowledge spillovers. For this purpose, a two-stage estimation procedure is conducted, following the method of Jofre-Monseny et al. (2014). First, Poisson and negative binomial regression models are estimated for count data to identify, for each sector, the type of agglomeration economy that contributes to new firm locations. Then, the industry characteristics related to Marshall’s agglomeration mechanisms (labor market pooling, customer-supplier relationship and knowledge spillovers) that determine differences in the incidence of those economies are assessed using the
coefficients obtained in the first stage and the generalized method of moments (GMM) with endogeneity control.
Accordingly, the present study improves on that of Jofre-Monseny et al. (2014), which has limitations, particularly regarding the empirical analysis method. The study mentioned used the weighted least squares method (WLSM) to analyze the effect of Marshall’s agglomeration mechanisms on agglomeration economies, disregarding possible endogeneity problems. Diversely, the analysis performed in this study allows assessing the relative importance of each of Marshall’s agglomeration mechanisms, considering its incidence in different geographic scales using sample exclusion criteria. Furthermore, we use a 100% formal database, the Relação Anual de Informações Sociais Identificada - RAIS identificada (identified RAIS - Annual Social Information Report), with no limit to the size of municipalities.
Thus, the present study contributes to the empirical literature regarding agglomeration mechanisms shaping the geography of economic activities by adopting an underused strategy, especially in Brazil: assessing agglomeration economies based on firm creation. In the analysis of agglomeration economies, the basic hypothesis of this approach takes into account the choice of the place where the entrepreneurs install their plants as a function of a profit maximization analysis. If agglomeration economies are present, they generate productivity gains that may induce a disproportionate concentration of firms at specific points in space. Thus, the location and spatial concentration of new firms become potential sources of investigation of agglomeration economies. In addition, the studies of agglomeration economies through the birth of firms do without data on capital, which is subject to high imprecision and whose access is notoriously difficult. Another quality is that new establishments are not restricted by previous decisions. They decide where to locate and how much labor to hire based on the current economic environment, which is exogenously given (ROSENTHAL; STRANGE, 2004). Another novel aspect of this study is the association of agglomeration economies with determinants of the geographical distribution of economic activities according to Marshall’s agglomeration mechanisms. Furthermore, localization and urbanization agglomeration economies are initially measured separately for the different sectors of the manufacturing industry to allow a sector-level analysis of variability in those effects.
The results indicate that localization economies are more intense in the industries employing workers with specific sectoral skills. Similarly, knowledge spillovers act in a way to boost the localization economies, providing an environment conducive to the transmission of knowledge and new ideas. On the other hand, localization economies are less intense in industries that have a greater dependence on manufactured inputs and the primary and energy supply sectors. Urbanization economies, in turn, are negatively related to labor market pooling and knowledge spillovers. However, the effects of input sharing and dependence on primary inputs on urbanization economies are positive and statistically significant.
In addition to this introduction, the study is organized as follows: Section 2 describes the empirical strategy, Section 3 presents the database and the treatments performed, Section 4 describes how the variables representative of agglomeration mechanisms were measured, Section 5 discusses the empirical results, and Section 6 presents the final considerations.
2. Empirical strategy
The central idea of the present study is to analyze the relative importance of each of Marshall’s agglomeration mechanisms – labor market pooling, customer-supplier relationship and knowledge spillovers – by analyzing new firm locations in Brazilian manufacturing industries. For this purpose, based on the method proposed by Jofre-Monseny et al. (2014), this study initially assesses, for each industry, the possible effects of (localization and urbanization) agglomeration economies on the explanation for firm creation. Subsequently, based on the coefficients obtained in those estimations, Marshall’s agglomeration mechanisms that may explain differences in the incidence of those economies are analyzed.
However, studying agglomeration economies based on firm creation has advantages and limitations. One of the main advantages is the fact that this type of analysis usually requires no data regarding capital (for example, capital, labor, equipment and land stock), to which access is notoriously difficult. Moreover, new firms are not limited by previous decisions. Thus, their location choices and decisions about how much labor to hire, based on the current economic environment, are determined exogenously.
The following are the main disadvantages: 1) the possibility of an absence of firm creation in specific locations in the period and sectors analyzed, which may limit the choice of econometric methods; and 2) the tendency of new firms to locate in areas with a preexisting concentration of industrial activities. These facts limit the choice of more restrictive econometric methods because they cause the presence of censored observations in the sample (ROSENTHAL; STRANGE, 2004; COMBES; GOBILLON, 2014). Rosenthal and Strange (2003), for example, analyze the geographical scope of agglomeration economies by concurrently measuring firm creation and associated job levels using tobit and probit models. More recently, Jofre-Monseny et al. (2011, 2014) include count data in the analysis of new firm creation using Poisson regression models.
The firm creation process can be expressed using the random profit function approach proposed by Carlton (1983), assuming the following linear expected profit function:
= . + . + ′ + (1)
where denotes the profit of firm in industry and municipality . Profit is determined by the following variables: 1) localization economies, which are measured as the logarithm of the employment level in industry of municipality ( ); 2) urbanization economies, which are measured as the logarithm of the overall employment level in municipality minus the employment in industry ( ); 3) , the vector with the other control variables; and 4) , the random error term.
In practice, cannot be observed. However, a conditional logit model can be constructed by assuming a Weibull distribution for (DUMAIS et al, 2002). Therefore, the probability that firm k is located in the geographical unit c has the following conditional logit form:
Pr(firm is located in ) = + , . + . +
-∑ , . + . + - (2)
However, Guimarães et al. (2003) warn that using the conditional logit method to model firm location decisions brings problems when working with complex choice scenarios with a large number of spatial alternatives. In this case, the conditional logit model can be estimated regardless of the number of choices, based on an equivalence relation between the conditional logit likelihood function and the Poisson regression, as follows:
/(0 ) = + , . + . + ′- (3)
where the dependent variable (0 ) is the number of new firms in industry and municipality . The Poisson distribution is appropriate when the dependent variable has only non-negative integer values and can be used to model the number of occurrences of an event (CAMERON; TRIVEDI, 2009). The Poisson distribution for a specific observation has the following probability of occurrence of a count y in a given period, area or region:
where 9 is the expected number of occurrences or the estimated mean incidence rate of a specific phenomenon for a given exposure and 5 is a non-negative number that represents the number of occurrences of the dependent variable.
Because there is only one parameter in the Poisson distribution, the mean and variance are equal, that is, /(4) = 9 and BC2(4) = 91. This property is known as Poisson equidispersion.
Although the Poisson regression model is an alternative to count data estimation, the restrictive data dispersion assumption (the Poisson equidispersion assumption) is not usually satisfied because the variance of count data tends to exceed the mean2. In this case, for this type of data, the variance of the dependent variable usually exceeds its mean. This characteristic is termed overdispersion, and it may be attributed to the presence of undetected data heterogeneity. Disregarding the existence of overdispersion when estimating a Poisson model may generate biased parameters (CAMERON; TRIVEDI, 2005).
Alternatively, the negative binomial model may be used to address the overdispersion problem. This model incorporates a random component (α), with a Gamma distribution, into the Poisson model, treating the overdispersion process as a result of undetected heterogeneity (WOOLDRIDGE, 2002). In this case, the density function of the negative binomial distribution is as follows:
ℎ35|9, F6 =Γ(HΓ(HI)Γ(HI+ 5)I+ 5) JHHI+ 9KI L MN
O9 + H9 IP: (5)
where H is equal to 1 F⁄ and represents the degree of data scattering and Γ indicates a standard Gamma function. The negative binomial model is non-linear and commonly estimated using the maximum likelihood estimation method.
Thus, the possible effects of agglomeration economies on new firm creation were estimated using the Poisson and negative binomial models to enable assessing the sensitivity of the results considering different count models.
A goodness-of-fit chi-square test was performed to assess the fit of the Poisson regression model (CAMERON; TRIVEDI, 2009). A non-significant test indicates that the model has a good fit to the Poisson distribution. Conversely, a significant test strongly suggests the existence of a data scattering problem, and the negative binomial model should be used in this case. Moreover, as previously mentioned, the second research stage aims to identify the industry characteristics that may explain inter-industry differences in the importance of localization and urbanization economies based on Marshall’s agglomeration theory. For this purpose, the following estimated equation was used:
QR S = H + T + U + (6)
where T is a vector of explanatory variables that measure Marshall’s agglomeration factors, that is, labor market pooling, knowledge spillovers and input sharing; is a set of control variables; and is a random error term. This equation was estimated for the following dependent variables: the coefficients of the localization ( Q ) and urbanization ( Q ) economies estimated using Equation (3).
However, as noted by Combes and Gobillon (2014), virtually all local variables explaining firm location choices may be considered endogenous, which remains overlooked in empirical research studies on this subject. In Ellison et al. (2010), for example, instrumental variables representative of the measures of inter-industry relations are constructed based on United Kingdom data and are then used to define the corresponding variables for the United States. However, the authors concede that
1 The standard mean parameterization is 9 = exp (+ ) to ensure that 9 > 0. This implies that based on the property of equidispersion of the Poisson distribution, the model is intrinsically heteroscedastic (CAMERON; TRIVEDI, 2009). 2 Overdispersion has consequences that are qualitatively similar to those of failure of the homoscedasticity property in
such instruments will only reduce the simultaneity bias if the agglomeration mechanisms similarly affect firm location choice in the United Kingdom and in the United States, which is unlikely.
In this context, the generalized method of moments (GMM) was used to estimate those parameters to correct possible endogeneity problems between the coefficients of localization and urbanization economies, the dependent variables of the model, and the Marshall’s agglomeration mechanisms, i.e., the explanatory variables. The values of those explanatory variables lagged by one or two periods (Y − 1, Y − 2) were used as measuring instruments of Marshall’s agglomeration mechanisms. As highlighted by Wooldridge (2002), GMM is used to control for endogeneity and belongs to a class of estimators that combine the main methods of generalized estimation of the parameters of linear and nonlinear models, thereby overcoming autocorrelation, heteroscedasticity and multicollinearity problems.
Notwithstanding the aforementioned advantages of using the GMM, it should be noted that the efficiency of the GMM is subject to the following set of constraints: 1) the included instrumental variables must be correlated with the endogenous variables and 2) the instrumental variables must be orthogonal to the random error term. In this context, the endogeneity test using the C statistic, or “difference-in-Sargan” statistic, and the Sargan-Hansen robustness test (1982) were used to assess the validity of the instrumental variables (CAMERON; TRIVEDI, 2009).
3. Database and description of variables
The database used was constructed from secondary data extracted from the Relação Anual de Informações Sociais Identificada - RAIS identificada (Annual Social Information Report - identified RAIS), published by the Ministry of Labor and Employment (Ministério do Trabalho e Emprego), in 2011, 2012 and 2013. Identified RAIS enables monitoring firms across years using the National Registry of Legal Entities (Cadastro Nacional da Pessoa Jurídica – CNPJ) and provides key data for the present study, including opening and closing dates, location, labor stock and activity sector.
In relation to the timeframe used, specifically the final year is justified by the availability of information, being the most recent year at the time of writing the article. Thus, since a three-year period is the minimum time span necessary for the signature counting process and, as such, has been defined for the counting of new forms, 2011 is the initial year. In addition, although the data for the calculation of the creation of firms are available for several years, the information necessary for calculations of other variables, such as the input-output matrix, are not available for every year.
Some exclusion criteria were used to reduce the sample size. Initially, companies with more than one subsidiary were removed from the sample, thereby excluding firm creation resulting from the expansion of preexisting companies. Firms with statutory employment relationships were also removed, thereby excluding government-owned companies from the analysis. Also, only new firms active in the reference year were kept in the sample.
Because the second stage of the analysis involved constructing variables representative of agglomeration mechanisms and input sharing between them, it required performing a matching3 procedure between the industry sectors of the National Classification of Economic Activities (Classificação Nacional de Atividades Econômicas – CNAE) and the activities of the input-output matrix, according to the correspondence between the CNAE 2.0 Groups and the list of activities provided by the Brazilian Institute of Geography and Statistics (Instituto Brasileiro de Geografia e Estatística – IBGE). This matching procedure resulted in a total of 30 industrial sectors, as outlined in Table A1 in the Appendix.
To estimate parameters indicative of localization and urbanization economies, the dependent variable is defined as the number of firms created in 2011, 2012 and 2013 by industry sector and location. The definition of new firms was based on the identified RAIS, which allows monitoring companies over the years using their CNPJ number, including opening and closing dates, location,
3 The compatibilization was necessary for the calculation of the input sharing variable, since the activities defined in the input-output matrix are more disaggregated in relation to the division presented in the CNAE for the manufacturing industry.
work stock and activity sector. The variable “new firms” is defined as the number (count) of firms created and active in the reference years, by industry and location, and filtered by the exclusion criteria mentioned above.
The data collected from the RAIS database refer to the manufacturing industry at the group level, that is, a three-digit code, according to the CNAE 2.0. To avoid simultaneity, the explanatory variables are measured using 2010 data. Furthermore, all explanatory variables are expressed as logarithms.
As shown in Equation 3, the vector of explanatory variables consists of three dimensions: 1) localization economies, which are measured as the logarithm of the employment level in industry and municipality ; 2) urbanization economies, which are measured as the logarithm of the overall employment level in municipality minus the employment level in industry ; and 3) a set of control variables for geographical or location characteristics.
The control variables include the logarithm of the municipality area and regional dummies (North, Northeast, Southeast, South and Central-West)4. For some industry-municipality pairs, the number of employees is zero, which precludes logarithmic transformation of the variables. To circumvent this problem, the method proposed by Crépon and Duguet (1997) was adopted. In this approach, a dummy variable with a value of 1 is created if the employment of a specific industry-municipality pair is zero, and it is assigned a value of 0 otherwise. The dummy variable is then added to the employment level, and subsequently, this sum is log-transformed. In the estimates, the dummy variable created is included as a regressor.
Equation 3 is estimated separately for the 30 industry sectors analyzed, thereby obtaining estimates of the coefficients of localization ( Q ) and urbanization ( Q ) economies for each sector. After estimating the effect of localization and urbanization economies on new firm location, the next stage is to assess how some industry characteristics affect the patterns of localization and urbanization economies in the geographical space of new firms.
For this purpose, the estimates of coefficients of localization ( Q ) and urbanization ( Q ) economies are regressed on the variables that measure the characteristics of the industry. Specifically, the hypothesis that the following industries have strong localization and/or urbanization economies is tested: 1) industries that employ workers with industry-specific skills (labor market pooling); 2) industries that extensively use manufactured inputs (input sharing); and 3) industries that extensively use knowledge (knowledge spillovers). This method makes it possible to identify which of these three industry characteristics are more important to explain why firms prefer to locate where the density of their industry sector is high (localization economies) or where more diversified industry environments are found (urbanization economies) (JOFRE-MONSENY et al., 2014).
4. Measurement of agglomeration mechanisms
Variables representative of industry characteristics describe Marshall’s agglomeration mechanisms and are calculated as follows:
Labor market pooling( [[\ ]^): This variable is representative of the advantages to firms and workers obtained by locating in concentrated markets. Thus, if labor market pooling is a relevant agglomeration theory, the incentive for companies and workers of the same industry sector to locate near each other, given the existence of workers with sector-specific skills, will be stronger (Rosenthal & Strange, 2001).
Similarly to Bacolo et al. (2010), Ellison et al. (2010), Jofre-Monseny et al. (2014), the proxy variable for labor market pooling was calculated using occupation to represent the skills of workers. For this purpose, the 2002 Brazilian Classification of Occupations (Classificação Brasileira de
4 The inclusion of regional dummies is important since the methodology used in the Jofre-Monseny et al. (2014) study was initially applied to Spain, a country quite different from that analyzed in this article, Brazil. Unlike Spain, Brazil is a continental country with great heterogeneity, which can lead to different impacts of the economies of urbanization and location in each region.
Ocupações – CBO; CBO 2002) of the IBGE, which is available in the RAIS statistical records, was used at the subgroup level, with 192 occupations, considering its distribution by labor stock. According to the IBGE, the CBO describes and ranks the occupations within a hierarchical structure, thereby allowing aggregation of information about the workforce based on occupational characteristics, such as functions, tasks and obligations, and on the content of the work, that is, knowledge, skills and personal attributes, among others.
Thus, the objective is to create a proxy that measures the specificity of workers in each industry in terms of skills. This was achieved by calculating a measure of occupational dissimilarity between this industry sector and the rest of the economy, the index of dissimilarity. Also known as the Duncan Segregation Index, because it was proposed by Duncan and Duncan (1955), this index compares the occupational structure of each industry with the rest of the economy as follows:
1[[\ ]^ =12 _ `aa −a − `a (7)
where [ is the occupation index; a is the number of workers in occupation [ of industry ; a is the number of workers in industry ; a is the number of workers in occupation [ minus the total workforce of industry ; and a − is total workforce of the economy minus the workforce of industry . This variable ranges from 0 to 1 and may be interpreted as the fraction of workers in industry that must change occupation to simulate the occupational structure of the economy. Thus, the more specialized the occupational structure is, the closer to 1 the values of this variable will be, that is, the more specific the industry will be in terms of worker skills (JOFRE-MONSENY et al., 2014).
Knowledge spillovers (b \\[c 2b): This variable refers to the ease with which companies and workers located nearby establish informal relations, thereby enabling the exchange of knowledge and ideas relevant to the improvement of industrial products and processes (Marshall, 1920). The present study is based on the hypothesis that knowledge spillovers are more important in knowledge-intensive industries, that is, in industries with greater human capital needs (JOFRE-MONSENY et al., 2014).
To test this agglomeration mechanism, two complementary lines of research can be followed: 1) the relationship between city growth and innovation (DURANTON; PUGA, 2001; JAFFE et al., 1993; CARLINO et al., 2007); and 2) growth and skills in cities (GLAESER; RESSENGER, 2010). However, these strategies are difficult to measure, especially regarding the calculation of variables representative of innovations and skills. Therefore, the knowledge spillovers variable is measured as the number of workers with a university degree employed in the industry. The variable was constructed based on the distribution of workers by level of education, which was available in the RAIS and measured as follows:
b \\[c 2b =d[YC\ ]e f 2 [g [\\ ^ ^2CheCY bd[YC\ ]e f 2 [g i[2 2b (8) The hypothesis that same-sector industries co-locate to benefit from knowledge spillovers is consistent with the idea that location effects are more important in industries with high fractions of skilled workers. Similarly, high levels of urbanization economies in knowledge-intensive industries suggest that companies co-locate in large urban areas to benefit from some form of tacit knowledge of workers (JOFRE-MONSENY et al., 2014).
Input sharing (j] eY kℎC2 ]^): This variable refers to the advantages of firm concentration associated with sharing a larger base of suppliers and, simultaneously, customers. According to this premise, firms will be more efficient when located near input suppliers because they will be able to minimize their transportation costs. Furthermore, the greater the dependence on inputs is, the greater the incentive for these firms to locate in areas with a high firm concentration. The 2010 Brazilian System of Input-Output Matrices, with 68 industry sectors or activities and 128 products, was used to quantify this variable.
This matrix was constructed based on the National Accounts published by the IBGE following the method proposed by Guilhoto and Sesso Filho (2005; 2010). As previously mentioned, this required performing a matching procedure between the CNAE industry sectors and the input-output matrix activities based on the match between the CNAE 2.0 Groups of the IBGE. Furthermore, this matrix was chosen because it includes more updated data compatible with the study period.
The variable measuring the relative importance of manufactured inputs for the industry was constructed following Rosenthal and Strange (2001) and Jofre-Monseny et al. (2014), dividing the purchased manufactured inputs by the total number of sales of each industry sector analyzed:
j] eY kℎC2 ]^ =d[YC\ ]e f 2 [g j] eYbd[YC\ ]e f 2 [g kC\ b (9) Thus, if industries with evidence of localization economies use manufactured inputs intensively, one of the reasons for these industries to locate in environments that are economically more specialized is easier sharing of input suppliers. Conversely, if industries with strong urbanization economies tend to use manufactured inputs intensively, input sharing will be a reason for these firms to locate in large cities (JOFRE-MONSENY et al., 2014).
In addition to variables representative of Marshall’s agglomeration mechanisms, natural advantage was used as a control variable. Natural advantage is a set of factors that affect the location of economic activities, such as the abundance of natural resources and cost of energy (ELLISON; GLAESER, 1999). Intuitively, if a specific location can provide easier access to natural resources and energy, industries that use these factors of production more intensively will tend to concentrate at that location.
Using again the 2010 Brazilian System of Input-Output Matrices, the natural advantage variable is defined as the sum of inputs purchased from the primary and energy sectors divided by the total sales of each industry sector analyzed. To calculate this variable, the following input-output matrix sectors are analyzed: agriculture, including agricultural and postharvest support; animal husbandry, including animal husbandry support; wood industry; fisheries and aquaculture; coal and nonmetallic mining; oil and natural gas extraction, including support activities; iron ore mining, including beneficiation and agglomeration; and non-ferrous mining, including beneficiation. The electricity, natural gas and other utilities sector was considered as the power supply sector.
A set of binary variables characteristic of the location, large regions, sector, firm size and technological intensity was also used. The technological intensity variable was calculated according to the classification of the Organization for Economic Co-operation and Development (OECD), which groups the manufacturing industry sectors according to their technological intensity: high, medium-high, medium-low and low. Thus, the variable has a value of 0, 1, 2 or 3 if the industry has low, medium-low, medium-high and high technological intensity, respectively. Table A2 in Appendix outlines the classification according to the technological intensity of the sectors analyzed. 5. Results
5.1 Descriptive analysis of the sample
The sample used is formed by 106,395 firms (creations) between 2011 and 2013, distributed by sector, as outlined in Table 1. Table 1 presents the maximum number of firms created in each sector, considering their geographical location and the percentage of municipalities with zero creations. In the industries of biofuel production and oil refining and coking plants, for example, no new firms were created in approximately 99% of Brazilian municipalities during the study period.
Table 1 - Brazil: Firms created in the manufacturing industry, 2011-2013
Sectors Firms New Firms (%) New Maximum Municipalities with zero firm creations (%) 1. Meat packing and production of meat products,
including dairy and fishery products 2,092 1.97 38 (Brasília-DF) 78.53 2. Sugar manufacture and refining 54 0.05 4 (Catanduva-SP) 99.16 3. Other food products 10,447 9.82 355 (São Paulo-SP) 52.45 4. Manufacture of beverages 422 0.40 33 (Brasília -DF) 94.47 5. Manufacture of tobacco products 44 0.04 8 (Santa Cruz do Sul-RS) 99.46 6. Manufacture of textiles 3,376 3.17 265 (São Paulo-SP) 83.23 7. Manufacture of apparel and accessories 23,466 22.06 3933 (São Paulo-SP) 58.62 8. Manufacture of footwear and leather goods 4,114 3.87 547 (Franca-SP) 87.40 9. Manufacture of wood products 3,473 3.26 64 (São Paulo-SP) 74.52 10. Manufacture of cellulose, paper and paper
products 898 0.84 100 (São Paulo-SP) 92.15
11. Printing and copying 4,776 4.49 853 (São Paulo-SP) 79.89 12. Oil refining and coking plants 32 0.03 Fortaleza-CE, Diadema-2 (Cascavel-PR,
SP and Araucária-PR)
99.46
13. Biofuel production 47 0.04 3 (Jataí-GO) 99.26
14. Production of other organic and inorganic
chemicals, resins and elastomers 339 0.32 15 (São Paulo-SP) 95.99 15. Manufacture of pesticides, disinfectants, paints
and various chemicals 513 0.48 18 (São Paulo-SP) 94.25
16. Manufacture of cleaning products, cosmetics/
perfumes and toilet preparations 553 0.52 51 (São Paulo-SP) 93.84 17. Manufacture of pharmaco-chemical and
pharmaceutical products 79 0.07 10 (São Paulo-SP) 98.94
18.Manufacture of rubber and plastic products 2,228 2.09 192 (São Paulo-SP) 86.34 19. Manufacture of non-metallic mineral products 6,801 6.39 125 (Cachoeiro de Itapemirim-ES) 60.93 20. Production of pig iron/ ferrous alloys, steel and
seamless steel tubes 148 0.14 17 (São Paulo-SP) 97.97
21. Metallurgy of nonferrous metals and metal
smelting industry 376 0.35 26 (São Paulo-SP) 95.87
22. Manufacture of metal products, excluding
machinery and equipment 12,676 11.91 556 (São Paulo-SP) 57.25 23. Manufacture of computers, electronics and
optical products 628 0.59 77 (São Paulo-SP) 95.90
24. Manufacture of electrical machinery and
equipment 679 0.64 98 (São Paulo-SP) 94.90
25. Manufacture of machinery and mechanical
equipment 2,172 2.04 142 (São Paulo-SP) 87.78
26. Manufacture of cars, trucks and buses,
excluding parts 399 0.38 20 (Goiânia-GO) 95.42
27. Manufacture of parts and accessories for motor
vehicles 736 0.69 80 (São Paulo-SP) 93.84
28. Manufacture of other transport equipment,
excluding motor vehicles 270 0.25 25 (Manaus-AM) 96.86
29. Manufacture of furniture and products of
various industries 11,695 10.99 635 (São Paulo-SP) 61.11 30. Maintenance, repair and installation of
machinery and equipment 12,862 12.09 1463 (São Paulo-SP) 69.79 Source: Authors, based on RAIS data.
The data also indicate that new firms were predominantly created in the following sectors: manufacture of apparel and accessories (23,466); maintenance, repair and installation of machinery and equipment (12,862); manufacture of metal products, excluding machinery and equipment (12,676); manufacture of furniture and products of various industries (11,695); and other food products (10,447).
Conversely, the following sectors had the lowest number of firm creations: oil refining and coking plants (32); manufacture of tobacco products (44); biofuel production (47), sugar manufacture and refining (54); and manufacture of pharmaco-chemical and pharmaceutical products (79). The geographical concentration of new firm creation is noteworthy. The municipality of São Paulo, for example, has the highest number of creations in virtually all sectors.
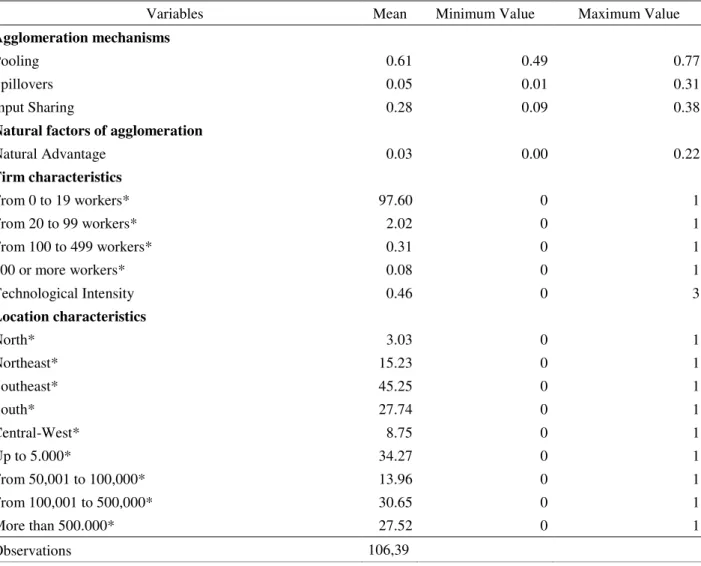
Table 2 presents descriptive statistics for the variables used to measure the role of agglomeration mechanisms in explaining the sources of localization and urbanization economies. The data indicate that the highest percentages of firms created are found in the Southeast and South regions, with 45.25% and 27.74%, respectively, and that 97.60% of industries have from 0 to 19 workers and are predominantly located in large cities, with populations greater than 100,000 inhabitants.
Table 2 - Brazil: Descriptive statistics from the database: mean, minimum and maximum values (2011-2013)
Variables Mean Minimum Value Maximum Value
Agglomeration mechanisms
Pooling 0.61 0.49 0.77
Spillovers 0.05 0.01 0.31
Input Sharing 0.28 0.09 0.38
Natural factors of agglomeration
Natural Advantage 0.03 0.00 0.22 Firm characteristics From 0 to 19 workers* 97.60 0 1 From 20 to 99 workers* 2.02 0 1 From 100 to 499 workers* 0.31 0 1 500 or more workers* 0.08 0 1 Technological Intensity 0.46 0 3 Location characteristics North* 3.03 0 1 Northeast* 15.23 0 1 Southeast* 45.25 0 1 South* 27.74 0 1 Central-West* 8.75 0 1 Up to 5.000* 34.27 0 1 From 50,001 to 100,000* 13.96 0 1 From 100,001 to 500,000* 30.65 0 1 More than 500.000* 27.52 0 1 Observations 106,39
Source: Authors, based on RAIS data.
Note: *Represents a binary variable. For binary variables, the mean should be interpreted as the ratio.
Labor market pooling reflects the possible advantages for companies and workers because they are located in regions with dense labor markets. In this case, if this is a relevant agglomeration mechanism, industries employing similar workers should be concentrated, thereby benefiting from
knowledge transfers generated by worker mobility between industries. The closer to one labor market pooling is, the stronger the pooling effects on the generation of agglomeration economies will be. The mean labor market pooling is 0.61, and manufacture of footwear and leather goods is the industry sector that employs workers with the most specific skills, with pooling of 0.77. Conversely, oil refining and coking plants is the sector that employs the least specialized workers, with pooling of 0.49.
The mean fraction of graduate workers, a proxy for the variable knowledge spillovers, which is the agglomeration mechanism that measures the transfer of knowledge and ideas that may occur between companies and workers close to each other, is 0.05. The industry of manufacture of pharmaco-chemical and pharmaceutical products has the highest fraction of qualified workers, with spillover of 0.31, whereas manufacture of footwear and leather goods has the lowest fraction, 0.01
Regarding the variable input sharing, which reflects the advantages derived from a greater possibility of sharing suppliers and customers provided by economically concentrated environments, the mean value is 0.28. Manufacture of cars, trucks and buses, excluding parts, is the industry with the highest use of manufactured inputs, 0.38, whereas sugar manufacture and refining has the lowest use, 0.09. Furthermore, the use of primary and energy inputs in relation to sales, the natural advantage, is highest for the industry of production of organic and inorganic chemicals, resins and elastomers, 0.22, and has a mean value of 0.03.
5.2 New firm location and agglomeration economies
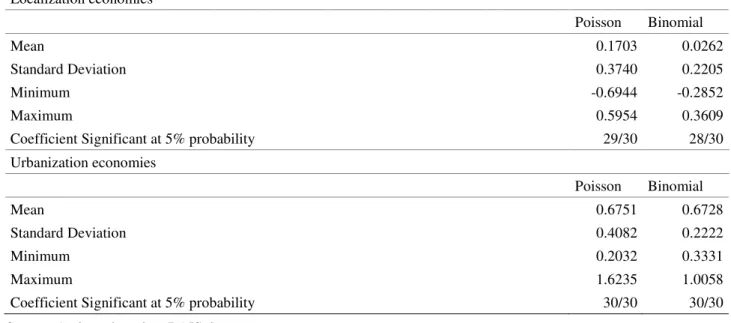
The next stage aims to identify the effects of (localization and urbanization) agglomeration economies on each sector explaining new firm creation. Table 3 outlines the 30 estimates made for each industry sector studied by analyzing the results of the Poisson and negative binomial models. The dependent variable is new firm count by sector and location. The explanatory variables are employment in industry (localization economies) and employment in industry minus employment in the sector (urbanization economies). Control variables include regional fixed effects (dummies for each of the five Brazilian regions) and the area of the municipality in km².
The magnitude of the parameters estimated varies slightly between the first two specifications, but their significance and signs do not. Table A3 in the Appendix describes the robust estimates and standard errors of location and urbanization economies of all sectors, calculated using the Poisson model, while Table A4 describes the complete results of the negative binomial model. A goodness-of-fit chi-square test was performed to assess the fit of the Poisson regression model (Cameron & Trivedi, 2009), which was significant for all study sectors, thus indicating the existence of significant differences between the predicted and the observed values of the dependent variable, firm creations; that is, the model does not fit the data well. Therefore, the estimates made using the negative binomial model should be more robust because this model is more indicated in the presence of overdispersion.
Thus, considering the estimates from the negative binomial model controlled for area and region, the mean value of the parameters of localization economies is 0.0262, with a standard deviation of 0.2205. For 28 of the 30 industry sectors, the estimated coefficient is significant and mostly positive; that is, localization economies may positively affect firm creation. The mean location elasticity estimates range from -0.2852, in the industry sector of maintenance, repair and installation of machinery and equipment, to 0.3609, in the sector of manufacture of apparel and accessories.
Regarding the manufacturing industries of meat packing and production of meat products, including dairy and fishery products; other food products; manufacture of beverages; manufacture of non-metallic mineral products; manufacture of metal products, excluding machinery and equipment; manufacture of machinery and mechanical equipment; manufacture of furniture and products of various industries; and maintenance, repair and installation of machinery and equipment, the localization economies had a significantly negative effect on new firm location decisions. Regarding the sectors of manufacture of wood products and production of organic and inorganic chemicals, resins and elastomers, the localization economies had a non-significant effect on firm creation.
Conversely, the mean value of the parameters of urbanization economies is 0.6728, with a standard deviation of 0.2222. Furthermore, the estimated coefficient of urbanization economies is positive and significant for all industry sectors analyzed. The lowest estimated coefficient is 0.3331, for the manufacture of apparel and accessories industry sector, whereas the three highest coefficients are found for the industries of maintenance, repair and installation of machinery and equipment (1.0058), manufacture of metal products, excluding machinery and equipment (0.8715), and manufacture of machinery and mechanical equipment (0.7702). Thus, on average, urbanization economies are stronger than localization economies and have a deeper effect on new firm location.
Table 3 - Brazil: Descriptive statistics regarding the estimated coefficients of agglomeration economies (2011-2013) Localization economies Poisson Binomial Mean 0.1703 0.0262 Standard Deviation 0.3740 0.2205 Minimum -0.6944 -0.2852 Maximum 0.5954 0.3609
Coefficient Significant at 5% probability 29/30 28/30
Urbanization economies Poisson Binomial Mean 0.6751 0.6728 Standard Deviation 0.4082 0.2222 Minimum 0.2032 0.3331 Maximum 1.6235 1.0058
Coefficient Significant at 5% probability 30/30 30/30
Source: Authors, based on RAIS data.
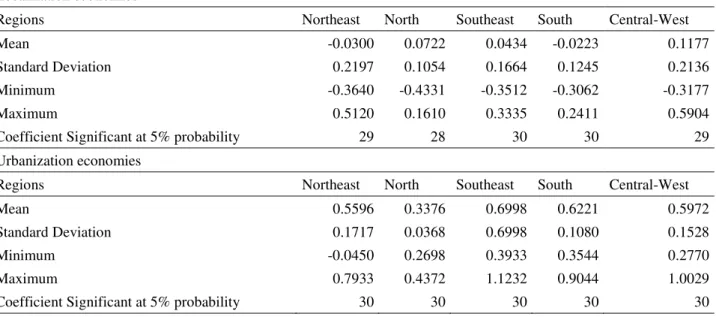
However, Brazil is a continental country with great heterogeneity between regions. Thus, it is possible that the economies of urbanization and location had different impacts in their different geographic spaces. To test this hypothesis, Table 4, below, shows negative binomial regressions, controlled by area size in km², for each Brazilian region5: Northeast, North, Southeast, South and Central-West. In general, it is possible to observe that the results are similar to those found previously in the more aggregated analysis presented in Table 3, especially with regard to the significance and average magnitude of the estimated parameters.
Regarding localization economies, the average value of the parameters for the Northeast region is -0.0300, with a standard deviation of 0.2197. For 29 of the 30 industries, the coefficient is statistically significant. The average estimates of location elasticity range from -0.3640, in the sector of meat packing and production of meat products, including dairy and fishery products, to 0.5120, in the manufacture of apparel and accessories. In the North region, the mean value of the parameters is 0.0722, with a standard deviation of 0.1054. For 28 of the 30 industries, the coefficient is statistically significant. The average estimates of location elasticity range from -0.4331, in the sugar manufacturing and refining industry to 0.1610, in the sector of other food products. For the Southeast region, the estimated coefficient for all industries analyzed is statistically significant, varying from -0.3512, in the maintenance, repair and installation of machinery and equipment industry, to 0.3335, in the manufacture of apparel and accessories. The mean value of the parameters is 0.0434, with a standard deviation of 0.1664. For the South region, the estimated coefficient for all industries
5 Tables A5, A6, A7, A8 and A9 in the appendix present the estimates, as well as the robust standard errors, of the economies of localization and urbanization for all industries and for the Northeast, North, Southeast, South and North regions, respectively, obtained by means of the negative binomial model.
analyzed is statistically significant, ranging from -0.3062, in the maintenance, repair and installation of machinery and equipment industry, to 0.2411, in the manufacture of apparel and accessories sector. The mean value of the parameters is -0.0223, with a standard deviation of 0.1245. Finally, for the Central-West region, the estimated coefficient was statistically significant in 29 of the 30 industries analyzed. The mean value of the parameters is 0.1177, with a standard deviation of 0.2136. The average estimates of location elasticity range from -0.3177 in the manufacture of metal products, excluding machinery and equipment, to 0.5904 in the oil refining and coking plants industry.
As for urbanization economies, it is possible to observe that the magnitude of the parameters estimated for all regions is higher than those verified for the economies of localization. In addition, for all regions, the estimated coefficient for the 30 industries analyzed is statistically significant. Specifically, for the Northeast, average estimates of urbanization elasticity range from -0.0450, in the manufacture of apparel and accessories industry, to 0.7933, in the meat packing and production of meat products industry, including dairy and fishery products. For the North region, the lowest elasticity of urbanization, 0.2698, is verified in the maintenance, repair and installation of machinery and equipment industry, while the largest, 0.4372, in the manufacture of non-metallic mineral products. In the Southeast region, average estimates of urbanization elasticity vary from 0.3933, in the manufacture of apparel and accessories industry, to 1.1232, in the sector of maintenance, repair and installation of machinery and equipment. For the South region, the manufacture of textiles industry presents the lowest elasticity of urbanization, 0.3544, while the greater, 0.9044, is found in the industry of maintenance, repair and installation of machinery and equipment. Finally, for the Central-West, average estimates of urbanization elasticity vary from 0.2770, in the manufacture of apparel and accessories, to 1.0029, in the manufacture of metal products, excluding machinery and equipment.
Table 4 - Descriptive statistics regarding the estimated coefficients of agglomeration economies for the Brazilian regions (2011-2013)
Localization economies
Regions Northeast North Southeast South Central-West
Mean -0.0300 0.0722 0.0434 -0.0223 0.1177
Standard Deviation 0.2197 0.1054 0.1664 0.1245 0.2136
Minimum -0.3640 -0.4331 -0.3512 -0.3062 -0.3177
Maximum 0.5120 0.1610 0.3335 0.2411 0.5904
Coefficient Significant at 5% probability 29 28 30 30 29 Urbanization economies
Regions Northeast North Southeast South Central-West
Mean 0.5596 0.3376 0.6998 0.6221 0.5972
Standard Deviation 0.1717 0.0368 0.6998 0.1080 0.1528
Minimum -0.0450 0.2698 0.3933 0.3544 0.2770
Maximum 0.7933 0.4372 1.1232 0.9044 1.0029
Coefficient Significant at 5% probability 30 30 30 30 30 Source: Authors, based on RAIS data.
A possible negative correlation between the combined effects of localization and urbanization economies has been published in the literature (DURANTON; PUGA, 2000; JOFRE-MONSENY et al., 2014). A possible explanation for this negative correlation is the fact that specialized cities (with stronger localization economies) are usually smaller in area. Therefore, to some extent, firms must choose between gains in specialization (localization economies) and city size (urbanization economies), that is, the magnitude of the effects of those economies would vary. Indeed, the present
findings indicate that the coefficients estimated for the localization economies of the three sectors with the strongest urbanization economies are negative.
The results reported herein suggest the validity of the three findings previously reported in the empirical literature regarding agglomeration economies and reviewed by Rosenthal and Strange (2004) and Combes and Gobillon (2014). First, agglomeration economies may be considered a key determinant of firm location decisions and of their productivity. Second, both types of agglomeration economies, localization and urbanization, are key determinants of new firm location choice. Finally, the importance of localization and urbanization economies may vary considerably between industry sectors.
5.3 The role of agglomeration mechanisms in explaining the sources of localization and urbanization economies
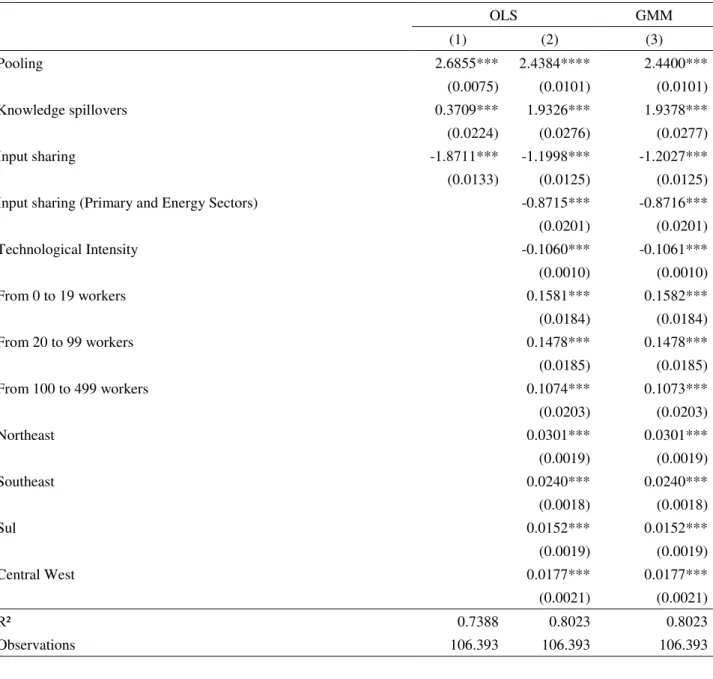
Here, based on the coefficients obtained in the previous subsection, Marshall’s agglomeration mechanisms that may explain differences in the strength of localization and urbanization economies are analyzed. Tables 5 and 6 indicate which industry characteristics may explain the interindustry differences in the importance of localization and urbanization economies, respectively. In those tables, columns 1 and 2 present the results obtained using the ordinary least squares (OLS) method, whereas column 3 outlines the GMM estimates controlled for endogeneity.
Models with different specifications were estimated. Based on the most parsimonious specification, column 1 outlines the regression results obtained when using the different agglomeration mechanisms simultaneously, without using control variables. The results of the OLS and GMM models are found in columns 2 and 3, respectively, which include the control variables for the use of natural resources, technological intensity, mean firm size and regions. The analysis of the last specification reveals that the estimates obtained using OLS and the GMM indicate no considerable variation in terms of magnitude, parameter sign and standard deviation. However, as previously discussed, the literature warns of the likely endogeneity between agglomeration economies and agglomeration mechanisms, which suggests the need for an estimation method considering that characteristic, such as the GMM. Furthermore, the robustness of estimates obtained by the GMM is demonstrated by the results of the endogeneity tests, which confirm the exogeneity of the model variables after including instrumental variables, and those of the Sargan–Hansen test, which suggest not rejecting the null hypothesis of exogeneity of the instrumental variables used.
In Table 5, when the dependent variable is agglomeration economies, the variable labor market pooling has a positive value for all specifications, with an estimated coefficient of 2.4400 in the GMM model. This result indicates that the effects of localization economies are usually more important in industries that employ workers with sector-specific skills; that is, companies in the same sector tend to cluster towards sharing a pool of skilled workers. Indeed, labor market pooling has been one of the most relevant agglomeration mechanisms, as shown, for example, in Rosenthal and Strange (2001), Gleaser and Kerr (2009) and Jofre-Monseny et al. (2011).
Similarly, knowledge spillovers are also significantly and positively related to localization economies, with a coefficient of 1.9378 in the GMM model. In this case, firms in the same sector would also tend to locate in specialized economic environments, thus sharing the possible benefits of knowledge transfer and new ideas. Regarding the relationship between the effects of localization economies, input sharing and dependence on primary inputs (primary and energy sectors), the results reveal a negative and significant effect, thus indicating weak localization economies in industries using manufactured inputs and inputs from the primary and energy supply sectors more intensely. This result suggests that firms do not locate in specialized environments to share inputs. Regarding the other control variables, the results indicating that localization economies tend to weaken in more technologically intensive industries and to strengthen with firm size in terms of number of workers should also be noted.
Regarding knowledge spillovers and input sharing, empirical studies have obtained different results. Jofre-Monseny et al. (2011), for example, find evidence that the effect of knowledge
spillovers on new firm creation is relatively weak and restricted to a more limited geographical scale, whereas the effect of input sharing is more intense. Ellison et al. (2010) also confirm the importance of input sharing as an agglomeration mechanism. Conversely, in a more recent study, Jofre-Monseny et al. (2014) suggest that knowledge spillovers negatively affect the location decisions of firms of the same sector, whereas input sharing exhibits no significant effect.
Table 5 - Brazil: Localization economies in the manufacturing industry, 2011-2013
OLS GMM (1) (2) (3) Pooling 2.6855*** 2.4384**** 2.4400*** (0.0075) (0.0101) (0.0101) Knowledge spillovers 0.3709*** 1.9326*** 1.9378*** (0.0224) (0.0276) (0.0277) Input sharing -1.8711*** -1.1998*** -1.2027*** (0.0133) (0.0125) (0.0125) Input sharing (Primary and Energy Sectors) -0.8715*** -0.8716*** (0.0201) (0.0201) Technological Intensity -0.1060*** -0.1061*** (0.0010) (0.0010) From 0 to 19 workers 0.1581*** 0.1582*** (0.0184) (0.0184) From 20 to 99 workers 0.1478*** 0.1478*** (0.0185) (0.0185) From 100 to 499 workers 0.1074*** 0.1073*** (0.0203) (0.0203) Northeast 0.0301*** 0.0301*** (0.0019) (0.0019) Southeast 0.0240*** 0.0240*** (0.0018) (0.0018) Sul 0.0152*** 0.0152*** (0.0019) (0.0019) Central West 0.0177*** 0.0177*** (0.0021) (0.0021) R² 0.7388 0.8023 0.8023 Observations 106.393 106.393 106.393 Endogeneity Test chi2(3) = 5.3323 (p = 0.1490)
Sargan-Hansen Test chi2(3) = 5.84337
(p = 0.1195)
Source: Authors, based on RAIS data.
Notes: 1. ***Significant values at 1% probability. 2. Robust standard errors are highlighted in parentheses.
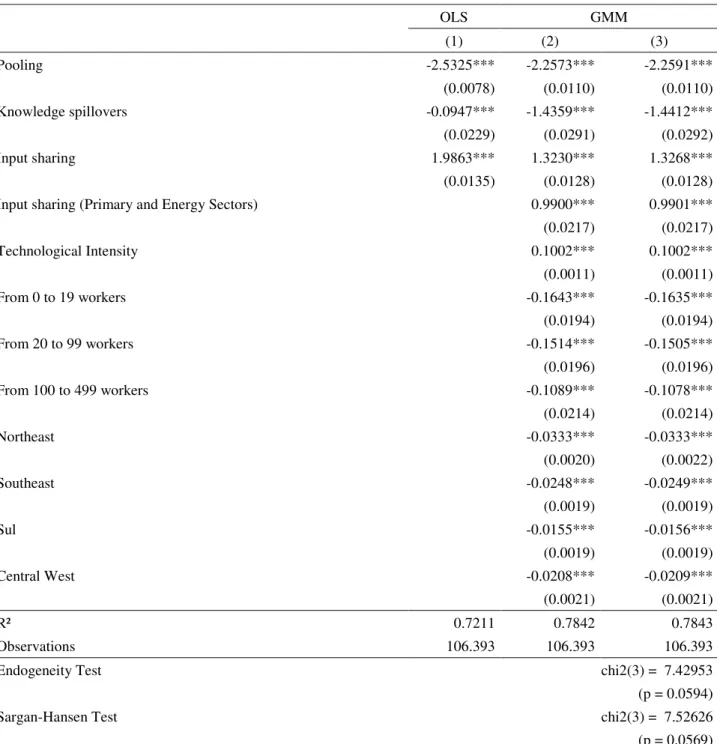
The results outlined in Table 6 suggest that urbanization economies are negatively related to labor market pooling and knowledge spillovers, thereby indicating that firms in sectors employing workers with industry-specific skills and that employ high fractions of qualified workers usually have weak urbanization economies, which are typically stronger in large cities. Considering labor market
pooling, this result corroborates the findings of Jofre-Monseny et al. (2014) for Spain. In contrast, the same authors find positive effects of knowledge spillovers on urbanization economies.
Table 6 - Brazil: Urbanization economies in the manufacturing industry, 2011-2013
OLS GMM (1) (2) (3) Pooling -2.5325*** -2.2573*** -2.2591*** (0.0078) (0.0110) (0.0110) Knowledge spillovers -0.0947*** -1.4359*** -1.4412*** (0.0229) (0.0291) (0.0292) Input sharing 1.9863*** 1.3230*** 1.3268*** (0.0135) (0.0128) (0.0128) Input sharing (Primary and Energy Sectors) 0.9900*** 0.9901***
(0.0217) (0.0217) Technological Intensity 0.1002*** 0.1002*** (0.0011) (0.0011) From 0 to 19 workers -0.1643*** -0.1635*** (0.0194) (0.0194) From 20 to 99 workers -0.1514*** -0.1505*** (0.0196) (0.0196) From 100 to 499 workers -0.1089*** -0.1078*** (0.0214) (0.0214) Northeast -0.0333*** -0.0333*** (0.0020) (0.0022) Southeast -0.0248*** -0.0249*** (0.0019) (0.0019) Sul -0.0155*** -0.0156*** (0.0019) (0.0019) Central West -0.0208*** -0.0209*** (0.0021) (0.0021) R² 0.7211 0.7842 0.7843 Observations 106.393 106.393 106.393
Endogeneity Test chi2(3) = 7.42953
(p = 0.0594)
Sargan-Hansen Test chi2(3) = 7.52626
(p = 0.0569)
Source: Authors, based on RAIS data.
Notes: 1. ***Significant values at 1% probability. 2. Robust standard errors are highlighted in parentheses.
Regarding the effects of input sharing and dependence on primary inputs (the primary and energy sectors) on urbanization economies, Table 6 highlights a positive and significant effect, thus indicating the presence of strong urbanization economies in industries using manufactured inputs and inputs from the primary and energy supply sectors more intensely. This result suggests that firms locate in economic environments that are more diversified for the purpose of input sharing. Regarding the other control variables, the results indicate that urbanization economies tend to strengthen among more technologically intensive industries and among smaller firms, in terms of number of workers.
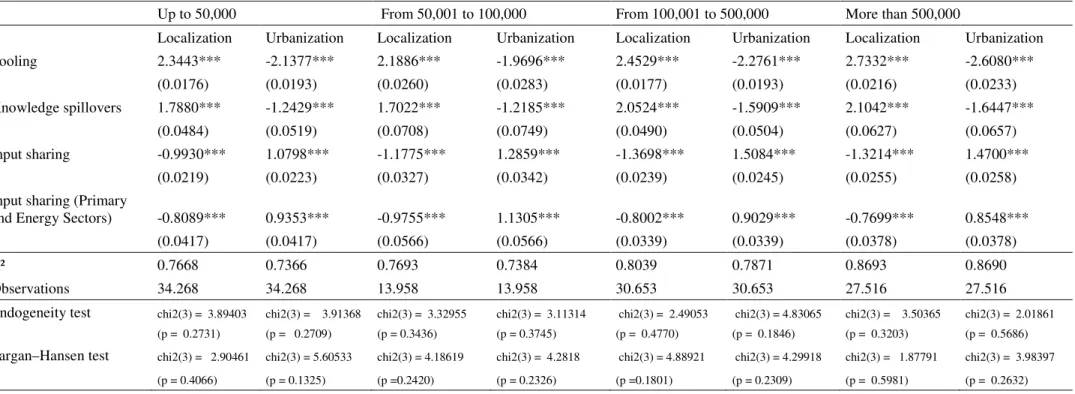
Lastly, Table 7 demonstrates the robustness of the results of alternative specifications, which assess the effects of agglomeration mechanisms on localization and urbanization economies, considering the population size. Furthermore, the analysis performed enables quantifying the relative importance of each agglomeration mechanism proposed by Marshall (1920), considering their incidence in different geographical scales using different exclusion criteria to reduce the sample size. In this case, the estimates presented were obtained using the GMM. Furthermore, the overall results reveal no differences from previously performed analyses of overall samples. This result corroborates, for example, the findings of Jofre-Monseny et al. (2011), who analyzed the effects of agglomeration mechanisms on new firm location in Spain using different population exclusion criteria.
Regarding localization economies, the results outlined in Table 7 indicate that pooling and knowledge spillover are apparently the most relevant agglomeration mechanisms, enhancing the effects of those economies. Regarding urbanization economies, the variables related to input supply and input sharing (the primary and energy sectors) enhance the effects of these economies. The results also demonstrate that the effects of agglomeration mechanisms may strengthen with increased population density of the economic environment.
Indeed, significant effects of Marshall’s agglomeration mechanisms on new firm location have been reported in the literature, although they differ in terms of the magnitude and specific contribution of each agglomerative factor. In Rosenthal and Strange (2001), for example, evidence that labor market pooling is the strongest effect, positively affecting firm location decisions, is reported. Conversely, Ellison, Glaeser and Kerr (2010) find significant evidence for the three agglomeration mechanisms, among which input sharing has the strongest effect. Similarly, Jofre-Monseny et al. (2011) find significant evidence for the three agglomeration mechanisms, and labor market pooling is the most relevant agglomeration mechanism. In this line of research, analyzing localization and urbanization economies, the present study finds significant evidence for the three Marshall’s agglomeration mechanisms by analyzing new firm location, a research strategy underused in studies on this subject at the national and even international level.
6. Final considerations
This study aimed to assess, based on an analysis of firm creation in the manufacturing industry of Brazilian municipalities, how the agglomeration mechanisms proposed by Marshall (1920) – labor market pooling, customer-supplier relationship or input sharing and knowledge spillovers – determine localization and urbanization economies. For this purpose, the analysis followed the method proposed by Jofre-Monseny et al. (2014), performing a two-stage estimation procedure: 1) estimation of Poisson and negative binomial regression models for count data to identify, for each industry sector, the type of agglomeration economy that contributes to new firm location and 2) use of the coefficients obtained in the first stage to assess the industry characteristics related to Marshall’s agglomeration mechanisms that may contribute to differences in the incidence of those economies by applying the GMM and controlling for endogeneity.
Initial evidence indicates that both agglomeration economies, localization and urbanization, can be considered key determinants of new firm location decisions and firm productivity. Furthermore, the relative importance of those economies may vary considerably between industry sectors. Localization economies are stronger in industry sectors that employ workers with industry-specific skills, thus enabling specialized labor market pooling. Similarly, knowledge spillovers strengthen localization economies, thereby providing an environment conducive to knowledge transfer and new ideas. In contrast, input sharing and dependence on primary inputs (the primary and energy sectors) have positive and significant effects on urbanization economies, thus suggesting the presence of strong urbanization economies in industries that use manufactured inputs and inputs from the primary and energy supply sectors more intensely. In this case, firms would tend to locate in more diversified economic environments for input sharing, thus reducing input and freight costs.
Table 7 - Brazil: Localization and urbanization economies by population size, 2011-2013
Up to 50,000 From 50,001 to 100,000 From 100,001 to 500,000 More than 500,000
Localization Urbanization Localization Urbanization Localization Urbanization Localization Urbanization
Pooling 2.3443*** -2.1377*** 2.1886*** -1.9696*** 2.4529*** -2.2761*** 2.7332*** -2.6080*** (0.0176) (0.0193) (0.0260) (0.0283) (0.0177) (0.0193) (0.0216) (0.0233) Knowledge spillovers 1.7880*** -1.2429*** 1.7022*** -1.2185*** 2.0524*** -1.5909*** 2.1042*** -1.6447*** (0.0484) (0.0519) (0.0708) (0.0749) (0.0490) (0.0504) (0.0627) (0.0657) Input sharing -0.9930*** 1.0798*** -1.1775*** 1.2859*** -1.3698*** 1.5084*** -1.3214*** 1.4700*** (0.0219) (0.0223) (0.0327) (0.0342) (0.0239) (0.0245) (0.0255) (0.0258)
Input sharing (Primary
and Energy Sectors) -0.8089*** 0.9353*** -0.9755*** 1.1305*** -0.8002*** 0.9029*** -0.7699*** 0.8548***
(0.0417) (0.0417) (0.0566) (0.0566) (0.0339) (0.0339) (0.0378) (0.0378)
R² 0.7668 0.7366 0.7693 0.7384 0.8039 0.7871 0.8693 0.8690
Observations 34.268 34.268 13.958 13.958 30.653 30.653 27.516 27.516
Endogeneity test chi2(3) = 3.89403 chi2(3) = 3.91368 chi2(3) = 3.32955 chi2(3) = 3.11314 chi2(3) = 2.49053 chi2(3) = 4.83065 chi2(3) = 3.50365 chi2(3) = 2.01861
(p = 0.2731) (p = 0.2709) (p = 0.3436) (p = 0.3745) (p = 0.4770) (p = 0.1846) (p = 0.3203) (p = 0.5686)
Sargan–Hansen test chi2(3) = 2.90461 chi2(3) = 5.60533 chi2(3) = 4.18619 chi2(3) = 4.2818 chi2(3) = 4.88921 chi2(3) = 4.29918 chi2(3) = 1.87791 chi2(3) = 3.98397
(p = 0.4066) (p = 0.1325) (p =0.2420) (p = 0.2326) (p =0.1801) (p = 0.2309) (p = 0.5981) (p = 0.2632)
Source: Authors, based on RAIS data.
Notes: 1. ***Significant values at 1% probability. 2. Robust standard errors are highlighted in parentheses. 3. Estimates were controlled by the same covariates as those of Tables 5 and 6.