A New Tool for Network Analysis on Team Sports
The ultimate performance analysis tool
Frutuoso G. M. Silva, Abel J. P. Gomes
University of Beira Interior, Instituto de Telecomunicações, Rua Marquês d’Ávila e Bolama,
6201-001Covilhã, Portugal
[email protected], [email protected]
Quoc Trong Nguyen Instituto de Telecomunicações, Av. Rovisco Pais,1 – Torre Norte
Lisboa, Portugal
Fernando M. L. Martins
Instituto Politécnico de Coimbra, Escola Superior de Educação, RoboCorp, Instituto de
Telecomunicações, Av. Rovisco Pais,1 – Torre Norte 1049-001, Lisboa, Portugal
Filipe M. Clemente
Instituto Politécnico de Viana do Castelo, Escola Superior de Desporto e Lazer,
Instituto de Telecomunicações, Complexo Desportivo e Lazer Comendador Rui
Solheiro – Monte de Prado, 4960-320, Melgaço, Portugal
Abstract— Network analysis has been used to classify the
interactions between teammates in team sports. However, no dedicated software or application was specifically developed to import, compute and export data in the specific case of sports, as far as we know. Based on that, we intend to propose a new application to visualize and analyze networks in soccer. The Ultimate Performance Analysis Tool (uPATO) allows observing, codifying, importing, visualizing, computing measures and exporting data from the observed games. The user may use a single application to work in the visualization and analysis of the match only considering the network that emerges from the game. In this paper it will be possible to observe the steps to visualize and import data and it will also be described the development of some network measures to characterize the centralities and general properties of unweighted and weighted graphs and digraphs. Finally, data from a real game will be used to test the network measures implemented and to show the values that can be exported and interpreted.
Keywords— Graph Theory; Network Analysis; Football; Match analysis
I. INTRODUCTION
Network analysis tools are used in a wide range of applications, for example for the study of the structure and dynamics of social, biological, and infrastructure networks. For example, social networks are everywhere and they can be formed of anything like a family, a project team, classmates in school, sports teams, membership in social networks like Facebook, Twitter or Instangram sites, etc. Thus, network analysis tools are more and more used to analyze the influence and interdependence of each element in a network. People are considered a node of the network and its relations or
Recently, the use of network analysis tools was applied to team sports, considering the network of the passes between players during a game, with the aim to understand how the collective and individual performance may be optimized. However, no dedicated software or application was specifically developed to import, compute and export data in the specific case of sports, as far as we know. Thus, this paper introduces a network analysis tool oriented for team sports, which enables the creation of adjacency matrices or load an adjacency matrix from file that allows us to compute several metrics over the network, i.e., individual and collective metrics.
The paper is organized as follows: section II presents a brief review of the network analysis tools available. In section III are described the main functionalities of our network analysis tool. Section IV presents a test case using data from a real game. Finally, section V presents some conclusions based on the data produced in previous sections.
II. RELATED WORK
There are several network analysis tools in the literature and the main difference between them are its purpose. The most relevant ones are presented as follows.
NetworkX is one of these tools that can manage complex networks in social, biological and infrastructures areas. Its aim is study of the structure, dynamics, and functions of complex networks [1].
NetworKit is other tool that is more oriented for large-scale network analysis. Its aim is to provide tools for the analysis of large networks in the size range from thousands to billions of edges. For this purpose, it implements efficient graph algorithms many of them parallel to utilize multi-core
Pajek is a tool for analysis and visualization of very large networks, such as collaboration networks, organic molecule in chemistry, protein-receptor interaction networks, genealogies, Internet networks, citation networks, etc. [3]
NetMiner is a tool to analyze and visualize the data networks. This tool allows to explore the network visually and interactively and recognizes patterns and network infrastructures [4].
Graphviz is a graph visualization software. Graph visualization is a way of representing structural information as diagrams of abstract graphs and networks [5].
Graph-Tool is an efficient module for the manipulation and statistical analysis of graphs. Many algorithms are implemented in parallel, which provides excellent performance on multi-core architectures, without degrading it on single-core machines [6].
Gephi is an open source software for exploring and manipulating networks. It provides easy and broad access to network data and allows spatializing, filtering, navigating, manipulating and clustering [7].
SocNetV is a social network analysis and visualization tool. It lets users construct social networks with a few clicks on a virtual canvas or load networks of various formats and modify them to suit the users' needs [8].
NodeXL is a tool to explore network graphs in Excel. With NodeXL, it is possible to enter a network edge list in a worksheet, click a button and see your graph, all in the familiar environment of the Excel window [9].
Most of these tools allow the processing and visualization of graphs in several domains. In this paper we introduce a network analysis tool oriented to the analysis in team sports. Thus the metrics most useful for team sports were compiled previously, and they can be seen in [10].
Network analysis has been used in team sports to identify the patterns of interaction during passing sequences [11,12]. Two main dimensions of analysis have been conducted: i) macro level; and ii) micro level. In the macro level some studies have detected a relationship between great values of network density and performance in game and an inverse relationship between centralization and performance [11,13].
In the case of centralities, the studies have identified that midfielders and external defenders are the prominent players during attacking building [14]. However, in counter-attack the centralities levels increase [15].
Despite of the results of the above-mentioned studies, there is little information about intermediation measures and co- dependency metrics. Moreover, in most of the cases there is a dependency of the researchers from more that one tool, one for observe or extract data and another to compute the measures. Based on that, we propose a new tool that may help researchers and coaches to analyze the data, i.e. extract the data and compute the measures in the same application in an easy and fast way.
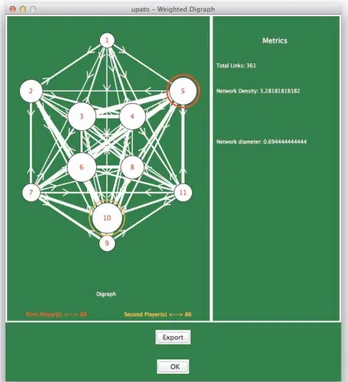
Fig. 1 - Digraph of Real Madrid.
III. OUR SOFTWARE: UPATO
The PATO software was initially developed to create easily the adjacency matrices for two teams to be analyzed by the same observer in a very user-friendly way [16]. The adjacency matrices codify our graphs, which in case of football they are weighted digraphs. Then was decided to extend the PATO tool to also calculate the metrics of the network and visualize the representations of graphs and digraphs, weighted or not. This extension was named “ultimate performance analysis tool” (uPATO).
The metrics available in uPATO are divided in three categories: Individual metrics; Subgroup metrics and Team metrics. In [10] it is possible to see all the metrics available and their interpretation in the case of the football. In the next section we will see an example of some metrics for each category for a practical case in football. For that, our software enables to import an adjacency matrix from a text file. Note that we have used the networks of passing sequences from Real Madrid and Athletic Madrid teams from the UEFA Champions League final of 2015/2016 season.
The first characteristic of uPATO is the drawing of the graph or digraph correspondent to the adjacency matrix loaded. Thus in this practical case, a weighted digraph is displayed as shows the Fig. 1 and Fig. 2, for Real Madrid and Athletic Madrid, respectively.
Fig. 2 - Digraph of Athletic Madrid.
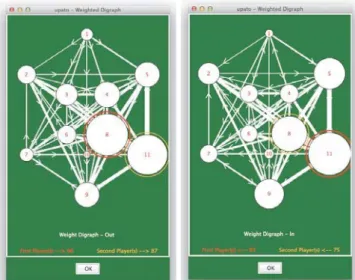
In the representation of the graph/digraph, the size of the nodes is proportional to the number of passes performed by the players. In the case of a digraph we can also display the digraph-out and the digraph-in, as shows the Fig. 3 and Fig. 4.
The edges of the digraph indicate the type of passes by the direction of the arrow, i.e. the passes made (O-->--) and the passes received (O---<--).
Fig. 3 - Digraph-Out and Digraph-In from Real Madrid.
Fig. 4 - Digraph-Out and Digraph-In from Athletic Madrid.
In the right side of the window of the digraph representation there is an area to display some metrics about the network. For example, in this case we can see the total number of links, the network density and diameter. However, other metrics can be presented in this area. In the future, it will be possible to display the selected metric(s) by the user for the selected player(s), as shows the Fig. 5.
Other option in graph/digraph representation is the reposition of each node (i.e. each player), for example to simulate a new tactical position of the team, as shows Fig. 6 for Real Madrid. For that, the user can select each node and move it freely inside the window.
In each graph/digraph representation are marked the two players that have the greater number of passes. A red circle marks the player with maximum number of passes and an orange circle marks the second maximum, and the values are showed in the bottom of the window.
The uPATO also allows representing graphically the results of some metrics. For example in the practical case, we can see in Fig. 7 and Fig. 8 all individual metrics calculated for two teams represented by a bar chart with all players. But we can also see a representation of all metrics for each player as show Fig. 9 and Fig. 10. In this case we can see the performance of each player in each metric, and then it is easier to compare the performance between players.
Fig. 6 - Reposition of the players in digraph of the Real Madrid.
Fig. 7 - Individual metrics for all players: Real Madrid.
Fig. 8 - Individual metrics for all players: Athletic Madrid.
In a similar way, we can represent all type of metrics available in our software. For example, in Fig. 11 we can see the team metrics used in practical case.
The uPATO software allows us to create the adjacency matrices, which means that we can create the graph/digraph with uPATO. Besides, the adjacency matrices can be partial, which means that we can codify a match as a sum of several matrices. For example, we can create a matrix for each 15 minutes of the game or for each part. Thus it is possible to analyze the performance of the players and the team for each part. Note that in our practical case we used only one matrix per team for the entire game.
Fig. 9 - All individual metrics for each player: Real Madrid.
5 5 0.20 0.81 41 -6 6 5 0.17 1.00 44 -9 7 10 0.17 0.46 23 -5 8 12 0.20 0.70 33 -5 9 6 0.14 0.39 19 -8 10 3 0.14 0.95 46 -9 11 11 0.20 0.52 23 -2
Fig. 11 - Team metrics: 1-Athletic; 2-Real.
IV. PRATICAL CASE
This section presents a practical case using uPATO.
We have used the networks of passing sequences from the UEFA Champions League final of 2015/2016 season. Real Madrid and Athletic Madrid draw 1-1 during the regular period and the game went to penalties (5-3). Playing positions were classified accordingly with the teams’ formations. Real Madrid: 1) goalkeeper; 2) right defender; 3) central defender; 4) central defender; 5) left defender; 6) defensive midfielder; 7) right wing; 8) midfielder; 9) striker; 10) midfielder; 11) left wing. Athletic Madrid: 1) goalkeeper; 2) right defender; 3) central defender; 4) central defender; 5) left defender; 6) midfielder; 7) right wing; 8) midfielder; 9) forward; 10) forward; 11) left wing.
Table 1 represents the macro-level values obtained for both teams during the final.
Transitivity allows to identify the balance of passing patterns between triads of players. Data collected from this case study suggest that a greater balance or equilibrium in passing patterns was found in Real Madrid (0.978) rather than in Athletic (0.716).
TABLE I. GENERAL PROPERTIES OF THE NETWORKS OF BOTH TEAMS.
Reciprocity values showed that Athletic Madrid has a greater tendency of mutual connections since this measure represents how pairs return the ball between each other.
Global centrality revealed that Athletic Madrid has a greater tendency to a star-like topology in establishment of sequences of passes. Higher values of global centrality represent a smaller homogeneity in the direction of passes and suggest a clear tendency to pass for specific members.
Values of proximity prestige are smaller since only one condition (passing only for a player) can achieve the higher value. Generally, passing sequences are distributed and for this reason the value is small for both teams.
Real Madrid had 0.006 of assortativity coefficient and Athletic Madrid -0.037. The data suggest that network is disassortative and that players with higher degree connect with others with smaller values.
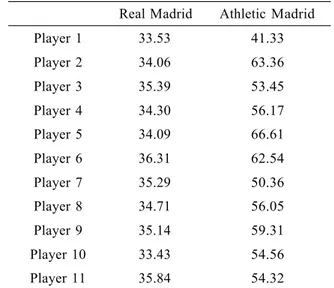
TABLE II. AVERAGE NEIGHBOR DEGREE PER PLAYING POSITION Real Madrid Athletic Madrid
Player 1 33.53 41.33 Player 2 34.06 63.36 Player 3 35.39 53.45 Player 4 34.30 56.17 Player 5 34.09 66.61 Player 6 36.31 62.54 Player 7 35.29 50.36 Player 8 34.71 56.05 Player 9 35.14 59.31 Player 10 33.43 54.56 Player 11 35.84 54.32
TABLE III. CENTRALITY LEVELS OF REAL MADRID PLAYERS.
Real Madrid
Athletic
Madrid i-j Player
Stress Central
Eccentrici
ty Eigenvect or
Power
centrali Centroid value
(i) (j) ity Centrality ty
Transitivity 0.978 0.716 0.261 1 0 0.25 0.36 17 -4 Reciprocity 0.620 0.760 -0.140 Global Centrality 1.611 5.767 -4.156 Group closeness centrality 2.788 4.379 -1.591 Group betweenness centrality 0.132 0.187 -0.055 Average proximity prestige 0.388 0.365 0.023 Variance proximity prestige 0.008 0.007 0.000 Variation coefficient proximity prestige 0.225 0.232 -0.007 Assortativity 0.006 -0.037 0.043 2 29 0.25 0.75 33 -2 3 30 0.25 0.93 43 1 4 25 0.20 0.93 39 -3
Player Stress Central ity Eccentrici E ty Centrality igenvect or Power centrali ty Centroid value ACKNOWLEDGMENT
This study was carried out within the scope of R&D Unit 50008, financed by UID/EEA/50008/2013. This study was 1 2 0.17 0.15 17 -6 conducted in the aim of the granted project: uPATO from
2 30 0.20 0.47 33 -2 Instituto de Telecomunicações.
3 23 0.20 0.44 40 -5
4 7 0.17 0.56 50 -8 REFERENCES
5 21 0.25 0.72 49 -3 [1] Overview — NetworkX, Retrieved March 1, 2017 in
6 7 0.20 0.39 32 -7 [2] NetworKit, Retrieved March 1, 2017 in https://networkit.iti.kit.edu/ 0.19 20 -1 [3] Pajek, Retrieved March 1, 2017 in http://mrvar.fdv.uni-lj.si/pajek/ 1.00 90 -9 [4] NetMiner, Retrieved March 2, 2017 in http://www.netminer.com/
[5] GraphViz, Retrieved March 2, 2017 in http://www.graphviz.org 0.59 48 -6 [6] Graph-Tool, Retrieved March 9, 2017 in https://graph-tool.skewed.de 0.05 5 -2 [7] M. Bastian, S. Heymann, M. Jacomy. “Gephi: an open source software 0.99 87 -9 for exploring and manipulating networks”, International AAAI Conference on Weblogs and Social Media, 2009.
7 36 0.25
8 0 0.17
9 4 0.17
10 27 0.25
11 0 0.20
Meso-level of analysis was also analyzed on this study, particularly using the average neighbor degree. The values of average neighbor degree can be found in table 2.
Player 6 (midfielder) of Real Madrid had the higher value (36.31) of average neighbor degree. In the case of Athletic, the higher value (66.61) was obtained by player 5 (left defender). These values may suggest that these players are the most connected with their teammates considering that this measure represents the average of correlation levels between pairs of players.
Centrality values of Real Madrid and Athletic Madrid can be observed in Tables 3 and 4, respectively.
Stress centrality indicates that central defender (Real Madrid) and right wing (Athletic Madrid) were the playing positions heavily involved in passing sequences. Players 1, 2 and 3 of Real Madrid and 5, 7 and 10 of Athletic Madrid had the higher value of eccentricity thus suggesting that they will be more easily influenced or conversely influence the activity of their teammates.
Defensive midfielder (player 6) of Real Madrid and midfielder (player 8) of Athletic Madrid were the playing positions with higher values of eigenvector. Results suggest that these players assume a regulatory role in passing sequences and interact with the most important teammates of the team.
Power centrality suggested that midfielders (players 10 and 8) of Real Madrid and Athletic Madrid, respectively, were the most central players of the team and such players are closer to establish connections with the remaining teammates, thus being the most relevant players during passing sequences.
Finally, player 3 of Real Madrid and player 7 of Athletic Madrid were the playing positions with the highest centroid levels, thus suggesting that these players are functionally capable of organizing clusters in the team during passing sequences.
TABLE IV. CENTRALITY LEVELS OF ATHLETIC MADRID PLAYERS.
V. CONCLUSIONS
As presented above, the uPATO software allows the creation of adjacency matrices, which represent our graph/digraph with the passes between players of a team during a match or during several parts of a match. This feature of uPATO allows the technical team to evaluate the performance of the players and the team for different periods of time in a match, as well as for the entire match.
In terms of the representation of graphs/digraphs, our tool allows the user to adjust the position of the players (i.e. nodes of graph) according to different tactical positions for the team (e.g. a 4x4x2 or 4x3x3). In the case of digraphs, it is possible to represent the digraph-out and the digraph-in, which in case of the football represents the passes made and received by players.
Other advantage of our tool is that it allows the computation of several metrics over the graph/digraph and their graphical representation, which makes easier the interpretation of the results of the metrics and the comparison between players or teams. For example, using a bar graph for each metric with all players or a representation with all metrics for each player (see for example Fig. 7 and Fig. 9 respectively).
The uPATO is a software under development yet and our goal is create a network analysis tool more oriented for team sports. Thus the main idea is that it could be available for any team, particularly for medium and small teams that do not have large budgets to acquire recent technologies based on video for analyze the performance of the players and teams. However, we are now extending the uPATO software to support also geolocation data provided by GPS systems, that some teams starting using for the players. These data do the tracking of the player position during a match and there are some measures that can be calculated to analyze the performance of the players and the team.
[8] SocNetV – Social Network Analysis and Visualization Software, Retrieved March 9, 2017 in http://socnetv.org
[9] NodeXL: Network Overview, Discovery and Exploration for Excel, Retrieved March 9, 2017 in https://nodexl.codeplex.com
[10] F. M. Clemente, F. M. L. Martins, R. S. Mendes, “Social Network Analysis Applied to Team Sports Analysis,” SpringerBriefs in Applied Sciences and Technology, 2016.
[11] J. Duch, J. S. Waitzman, and L. A. Amaral, “Quantifying the performance of individual players in a team activity,” PLoS One, vol. 5, no. 6, p. e10937, 2010.
[12] T. U. Grund, “Network structure and team performance: The case of English Premier League soccer teams,” Soc. Networks, vol. 34, no. 4, pp. 682–690, 2012.
[13] F. M. Clemente, F. M. L. Martins, D. Kalamaras, D. P. Wong, and R. S. Mendes, “General network analysis of national soccer teams in FIFA World Cup 2014,” Int. J. Perform. Anal. Sport, vol. 15, no. 1, pp. 80–96, 2015.
[14] F. M. Clemente, F. M. L. Martins, D. P. Wong, D. Kalamaras, and R. S. Mendes, “Midfielder as the prominent participant in the building attack: A network analysis of national teams in FIFA World Cup 2014,” Int. J. Perform. Anal. Sport, vol. 15, no. 2, pp. 704–722, 2015.
[15] P. Malta and B. Travassos, “Characterization of the defense-attack transition of a soccer team,” Motricidade, vol. 10, no. 1, pp. 27–37, 2014.
[16] F.M. Clemente, F. Silva, F. Martins, D. Kalamaras, R. Mendes, “Performance analysis tool (PATO) for network analysis on team sports: a case study of FIFA Soccer World Cup 2014,” Journal of Sports Engineering and Technology , Vol. 230 , No. 5 , pp. 1 - 31, July, 2015.