MONITORING DEVICE OF ICE FORMATION IN EVAPORATOR
SURFACE OF REFRIGERATION SYSTEMS
Marcos Graça
1, Pedro D. Gaspar
1*, Pedro D. Silva
1, J. Nunes
2and L.P. Andrade
2 1: University of Beira Interior, Faculty of Engineering, Department of Electromechanical Engineering,Calçada do Lameiro, 6200-001 Covilhã, Portugal
2: Agriculture school, Polytechnical Institute of Castelo Branco, 6001-909 Castelo Branco, Portugal e-mail: dinis@ubi.pt; dinho@ubi.pt; web: http://www.ubi.pt
Abstract: In order to achieve lower temperatures than ambient air, whether for food cold
storage purposes or thermal comfort, the evaporator coils generally operate at lower
temperatures than the freezing point of water. The ice formed on the evaporator surface is
disadvantageous for the energy efficiency and performance of the refrigeration system. Thus,
its removal is crucial to restore the desired operating conditions. This paper studies the
feasibility of using a simple and low cost device for monitoring the ice formation on the
surface of evaporators. The concept of the developed device is based on variation imposed by
the ice formation on the electrical resistance measured between electrodes. Through a
detailed analysis of results, the electronic circuit capable of automating the entire process has
been designed and projected on a printed circuit board. The results show that both the circuit
configuration and the concept have potential to be used as ice formation monitoring devices.
Some adjustments have to be included in the device to achieve a widespread application level.
Keywords: Ice formation, Evaporator, Resistive sensor, Refrigeration system, Thermal performance,
1.
INTRODUCTIONThe refrigeration systems are nowadays an indispensable resource. Refrigeration is an engineering area of great importance that has been improved for centuries due to the high requirements that come from lifestyle and constant evolution of society. It has several applications, but the largest number are related to air conditioning and food preservation. The food preservation using cold is based on the partial or total restraint of microbial growth, chemical reactions and enzyme activity. Taking into account the food safety context and the temperatures usually encountered in food cold stores, the lower the air temperature, the slower will be food spoilage. The food conservation by chilling process results in slower food degradation, and hence an increase in its useful shelf life. In order to obtain temperatures lower than those available in the environment, the evaporator coils operate generally at temperatures below the freezing point of water, which may cause the ice formation on its surface. There are two major types of commercial refrigeration systems for food preservation, open and closed ones. However, there will be air exchange for any of these types, either intermittently (closed) or continuously (open). The air exchange occurs due to different densities of the fluid (air), as result of the different temperatures between spaces (cold and ambient environments). The air entering the system is at a higher temperature than the air inside the refrigerated space, which implies thermal gain for the system. The air under normal conditions consists, among others, by water in the gaseous state, which in contact with the surface of the evaporator with a temperature below the dew point temperature will condense. Additionally, if the temperature of the evaporator surface is below the freezing point temperature, ice formation will occur [1]. The ice formation is a complex process of transitions between physical states where both heat and mass transfers occur simultaneously [2]. The ice formation and its growth pattern depend on the water and temperature of the evaporator surface, as well as air temperature, flow, purity and relative humidity [1]. The resistance to heat transfer from the evaporator surface to the air increases with the ice layer thickness, thus acting as an insulator [3-4] and, additionally, causing an air pressure loss across the evaporator that ultimately will block the airflow. The consequences of the ice formation on the evaporator surface are the reduction of the cooling capacity and the increase of energy consumption. According to the IEA (International Energy Agency), the final energy consumption has increased over the years. Among others, one of those responsible for this growth is the increase in electricity consumption [5]. Thus it is important to stimulate the energy efficiency and energy waste reduction. Currently, many of the defrosting systems are controlled by timer that regulates the daily number of defrost cycles and it respective duration [6]. Apart from these, there are systems on the market that monitor the ice formation through the evaluation of the air temperature. These are indirect methods of ice detection. However, since these latter methods do not consider the many variables that affect the ice formation, it results in most cases in an excess of defrost cycles [7]. It should be noted that any defrost system causes an increase of the air temperature inside the cold environment. Thus, a misfit defrost period results in a further marked reduction of the system efficiency that, depending on the application, may also impair the quality and food safety. By implementing a reliable, cheap and efficient monitoring device of the ice formation on the evaporator surface, it is possible to adjust the number and duration of the defrost cycles to what is strictly necessary. Thus, it will be possible to achieve increased system efficiency, increase its cooling capacity, improving the quality and the shelf life of the food products stored. In the long run, there is also an increased life of the system. This paper describes in detail the consequences related to the ice formation on the surface of evaporators and studies the feasibility of using a simple and low cost device for monitoring the ice formation on the surface of evaporators.
2. MATERIALS AND METHODS 3.1. Experimental prototype
The ice formation monitoring has been investigated from different research areas, among these, aviation engineering due to the huge risk for the safety of passengers and crew that ice formation may have in the normal operation of an aircraft [8-9]. In this application area, the sensors must have high reliability and sensitivity, being its cost a secondary question. On the other hand, a sensor developed for monitoring the ice formation in refrigeration application has the cost as determining factor. Thus, any prototype to be developed must be inexpensive and have reasonable sensitivity and reliability [7]. Currently the most widely used defrost system in the refrigeration industry is time controlled. The defrost system is triggered periodically during predefined periods [10]. Although not obtaining the desired results, it continues to be the most selected systems due to its simplicity and inexpensiveness, although with compromised reliability [7]. Taking into account these factors, the ice formation monitoring system to be developed will use a resistive sensor. This sensor type is cheap and has the potential to achieve good results. In addition, it does not require special equipment for data acquisition and can be simple and cheaply automated.
3.2. Experimental setup
The experimental setup consists of the following equipment and components (see sketch in Figure 1): Voltage source to supply 12 V to the circuit. The electronic circuit is composed by two 100 k resistors and a transistor [11]. The electrodes are made from copper due to its high commercial availability, low cost, high corrosion resistance and high electric conductivity. The multimeter was used to determine the sensor characteristic curves depending on the presence of water in different physical state (gas, liquid and solid). Other components that allow the system to operate autonomously will be described in the next section.
Figure 1. Sketch of experimental setup. 3.3. Operating principle of the sensor
The electrical resistance is the ability of a particular material to oppose the flow of electric current. Ohm's first law gives this quantity. The electrical resistivity is the property that quantifies how strongly a given material opposes the flow of electric current. Consequently, the electrical
conductivity is the reciprocal of electrical resistivity, and measures a material's ability to conduct an electric current. Thus, smaller the resistivity of a material, larger its conductivity and hence the ability of the material to allow the flow of electric current. Table 1 describes the average electrical conductivity of water in different physical states.
Table 1. Average electrical conductivity of water in different physical states [12]. Physical state Electrical conductivity (S/m)
Gas (air) 3×10⁻¹⁵ to 8×10⁻¹⁵ (20 ºC) Liquid (water) 5×10⁻⁴ to 5×−5 (20 ºC) Solid (ice) 1×10⁻⁶ to 1×10⁻¹⁰ (-10 ºC)
As shown in Table 1, the potential feasibility of the method is confirmed by the different electrical conductivities of three physical states of water. Therefore, it is expected that the test circuit is able to distinguish the physical state, and consequently the ice formation. According to the working principle of the sensor, materials with different electrical conductivities between two parallel electrodes electrically charged will determine different voltage drops between them.
3.4. Experimental study
It has necessary to set up some procedures related to the device and its operation in order to obtain reliable and accurate data measured by the sensor. One of these procedures is related to the position and orientation of the sensor. It must be highlighted that the results report the presence of a solid material (ice) between the electrodes at the location where the sensor(s) is(are) located. Thus, it is extremely important that the sensor be placed in a position and orientation such that its measurements disclose the time in which the ice layer becomes disadvantageous for the refrigeration system. The sensor should therefore be located where the ice formation does not have favourable conditions since the ice is not formed uniformly across the evaporator surface [13] and the thermal performance of the refrigeration system is not influenced immediately by ice formation only when a considerable part of its surface has ice. After setting the sensor position and orientation, there is the inconvenience of the material of the evaporator fins where the device will be fixed, as well as the electrodes material have good electrical conductivity. If these materials come into direct contact, the electrical circuit is closed and there will be no representative measurement of voltage drop for the case study. This difficulty was overcome by using an insulating material between the electrode and the evaporator fin to which it is attached. In addition to the above-mentioned purpose, the insulating material also ensures that the electrodes remain parallel during the experiment. The electrodes should be parallel and of equal length to eliminate uniformities of the electric field [13]. Other factors related to the influence of the distance between the electrodes on the results will be described later.
3.5. Operating principle validation
Experimental tests were performed with the three materials under study (air, water and ice) deposited between the electrodes to validate the operating principle. The parallel electrodes are 1 cm away from each other. The results for each type of material deposited between the electrodes effectively prove
that there is a direct relationship between the voltage drop and the physical state. Thus, the feasibility of the operating principle of the sensor is confirmed. The voltage values measured at resistance terminals noticeably varied depending on the physical state.
3.5. Calibration of the distance between electrodes
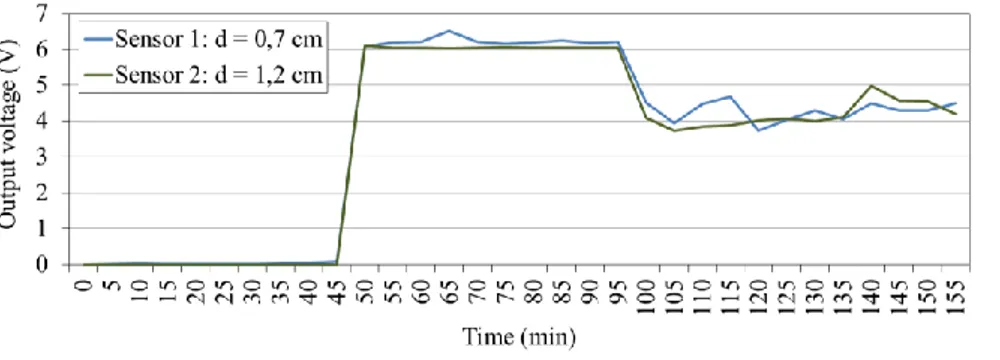
Two sensors with different distances between it respective electrodes were used to calibrate the spacing between electrodes. The default spacing was determined taking into account some factors considered crucial for the proper operation of the sensor as well as of the application. These are: (1) The distance between electrodes cannot promote the ice formation; (2) The distance between electrodes cannot affect the sensor sensitivity. Taking into account the aforementioned factors, the spacing used for sensor 1 and 2 was respectively 0.7 cm and 1.2 cm. These spacing values are in the order of the fins spacing usually found in evaporator coils. As can be seen in Figure 2, the results obtained for both electrode spacing are similar during the test time. Both results present reasonable sensitivity. It is shown the physical state transition from air to water at time around 45 min as well as the transition from water to ice at time around 100 min. The distance between electrodes selected for the remaining experimental studies was 1.2 cm.
Figure 2. Output voltage variation for the calibration test of electrodes spacing. 4. ANALYSIS AND DISCUSSION OF RESULTS
Figure 3 a) shows the variation of temperatures recorded throughout the study. The air temperature at the evaporator inlet slightly increases throughout the experimental test, showing a greater slope before t = 40 min. In contrast, the air temperature at the evaporator outlet decreases from the beginning of the experimental test until t ≈ 45 min, then remains relatively constant with small variations until t = 95 min, to start slightly increasing again until end of experimental test. The temperature in the evaporator surface abruptly decreases until t = 50 min, then decreases slightly until t = 60 mim. The superficial temperature shows small variations between t = 60 and t = 100 minutes and from this time stars decreasing noticeably. The relative humidity of air was also measured at the evaporator inlet and outlet. The results are shown in Figure 3 b). The air relative humidity at the evaporator inlet during the first 50 min decreases. From this time until the end of the experimental test, the air relative humidity remained almost constant in a value around 40%. On the other hand, the air relative humidity at the evaporator outlet steadily increases until t = 55 min and then swings slightly until the end of the experimental test remaining relatively constant with values around 65%.
As shown in Figure 2, it is possible to distinguish between the presence of air, water or ice, The first phase corresponds to the presence of air between electrodes with values of measured voltage around 0 V from the beginning of the study and t = 45 min. The second phase corresponds to the presence of water, with voltage values between 6 V and 6.5 V. This phase occurs between 50 < t <95 min. The third stage corresponds to the formation of ice for which it was recorded voltage values between 3.8 V and 5 V, from t = 100 min to the end of the study. During the time intervals 45 < t < 50 min and 95 < t < 100 min corresponding to the measurement range for which there is a change of physical state. It is also possible to verify from the analysis of Figures 2 and 3 that the time when the sensor "complains" the presence of ice, t 95 min, overlaps the time when the air temperature at the evaporator outlet begins to rise continuously. The air temperature at the evaporator outlet is used to validate the results obtained by the sensor, since it reveals the loss of cooling capacity of the system. Note that, as mentioned earlier, this is one of the consequences of ice formation. The temperature of the evaporator surface is another factor that strengthens the capability of the sensor for monitoring the ice formation. The time when the sensor detects the presence of ice coincides with the instant at which the temperature at the evaporator surface starts continuously decreasing abruptly. Figure 4 shows the images that illustrate how the ice formation throughout the study progresses.
a) Temperature. b) Relative humidity.
Figure 3.Variation of temperature during the experimental test for air velocity of 2 m/s.
t = 0 min. t = 30 min. t = 60 min. t = 90 min. t = 120 min. t = 150 min. Figure 4. Evolution of the ice formation on the evaporator surface for experimental test.
5. CONCLUSIONS
This experimental study evaluates the feasibility and reliability of using resistive sensor composed by two electrodes in the development of a simple and low cost device for monitoring the ice formation on the surface of evaporators.
The study regarding the validation of the sensor's operating principle shows that the tested circuit has the capacity to distinguish air, water and ice. It is also concluded that the distance between electrodes
has a small effect on the results. Thus, it was set as default the configuration with largest distance between electrodes to avoid or reduce icing.
Experimental tests using an air-handling unit (AHU) and its respective evaporator were developed for air velocities of 2 m/s. The sensor is able to distinguish between the different physical states of water for this air velocity. The device indicated the presence of ice formation when the temperature of the air at the evaporator outlet began to rise for the test with air velocity of 2 m/s. Note that cooling capacity loss that is consequence of the ice formation. Upon the ice formation on the surface of the evaporator is expected that the temperature of its surface undergo an abrupt decrease. This condition occurs at the same time that the sensor detects the ice formation and increasing the outlet temperature of the evaporator starts to rise. The range of voltage results related to the ice formation was determined. An electronic circuit capable of automating the entire process is designed and sized. The results show that both the circuit configuration and the concept have potential to be used as ice formation monitoring devices. Some adjustments have to be included in the device to achieve a widespread application level.
REFERENCES
[1] Wang W, Xiao J, Feng Y, Guo Q, Wang L. Characteristics of an air source heat pump with novel photoelectric sensors during periodic frost-defrost cycles. Applied Thermal Engineering, 2013, 50(1):177–186.
[2] Tudor V, Ohadi M, Salehi MA, Lawler JV. Advances in control of frost on evaporator coils with an applied electric field. International Journal of Heat and Mass Transfer, 2005, 48(21– 22):4428–4434.
[3] Tassou SA, Datta D. Influence of supermarket environmental parameters on the frosting and defrosting of vertical multideck display cabinets, in Transactions of ASHRAE, 1999, 105(2): 491-496.
[4] Na B, Webb RL. New model for frost growth rate. International Journal of Heat and Mass Transfer, 2004, 47(5):925–936.
[5] IEA. Key World Energy Statistics. International Energy Agency (IEA), Soregraph, Paris, 2013.
[6] Aviles EA, Miller NR, Newell TA. Detection of Evaporator Frost. ACRC TR-215, Air Conditioning and Refrigeration Center (ACRC), University of Illinois, Illinois, 2003.
[7] Tassou SA, Datta D, Marriott D. Frost formation and defrost control parameters for open multideck refrigerated food display cabinets. Proc. of the Institution of Mechanical Engineers, Part A: Journal of Power and Energy, vol. 215(2), March 1, 2001: 213-222.
[8] Roy S., Izad A, DeAnna RG, Mehregany M. Smart ice detection systems based on reasonant piezoelectric transducers. Sensors and Actuators A: Physical, 1998, 69(3):243–250.
[9] Lawrence JM, Evans JA. Refrigerant flow instability as a means to predict the need for defrosting the evaporator in a retail display freezer cabinet. International Journal of Refrigeration, 2008, 31(1):107–112.
[10] Fricke BA, Sharma V. Demand Defrost Strategies in Supermarket Refrigeration Systems. Interim Report, Refrigeration Project Team Retail Energy Alliance, Oak Ridge, 2011.
[11] Wartchow CA, Fröhlich HB. Projeto e construção de um sensor de umidade relativa do tipo resistivo. Dissertação - Universidade Federal do Rio Grande do Sul, Porto Alegre, 2013.11 [12] Petrenko VF. Electrical Properties of Ice. Special Report 93-20, US Army Corps of Engineers,
1993.
[13] Owusu KP. Capacitive probe for ice detection and accretion rate measurement: proof of concept. Thesis: University of Manitoba, Manitoba, 2010.