Article
Basin Irrigation Design with Multi-Criteria Analysis
Focusing on Water Saving and Economic Returns:
Application to Wheat in Hetao, Yellow River Basin
Qingfeng Miao1, Haibin Shi1,*, José M. Gonçalves2,3 ID and Luis S. Pereira2
1 College of Water Conservancy and Civil Engineering, Inner Mongolia Agricultural University, Hohhot 010018, China; [email protected]
2 Centro de Investigação em Agronomia, Alimentos, Ambiente e Paisagem (LEAF),
Instituto Superior de Agronomia, Universidade de Lisboa, Tapada da Ajuda, 1349-017 Lisboa, Portugal; [email protected] (J.M.G.); [email protected] (L.S.P.)
3 Polytechnic of Coimbra, College of Agriculture, Bencanta, 3045-601 Coimbra, Portugal * Correspondence: [email protected]; Tel.: +86-0471-4300177
Received: 23 November 2017; Accepted: 5 January 2018; Published: 13 January 2018
Abstract:The sustainability of the Hetao Irrigation System, located in the water scarce upper Yellow River basin, is a priority considering the need for water saving, increased water productivity, and higher farmers’ incomes. The upgrading of basin irrigation, the main irrigation method, is essential and includes the adoption of precise land levelling, cut-off management, improved water distribution uniformity, and adequate irrigation scheduling. With this objective, the current study focuses on upgrading wheat basin irrigation through improved design using a decision support system (DSS) model, which considers land parcels characteristics, crop irrigation scheduling, soil infiltration, hydraulic simulation, and environmental and economic impacts. Its use includes outlining water saving scenarios and ranking alternative designs through multi-criteria analysis considering the priorities of stakeholders. The best alternatives concern flat level basins with a 100 and 200 m length and inflow rates between 2 and 4 L s−1m−1. The total irrigation cost of designed projects, including the cost of the autumn irrigation, varies between 2400 and 3300 Yuan ha−1; the major cost component is land levelling, corresponding to 33–46% of total irrigation costs. The economic land productivity is about 18,000 Yuan ha−1. The DSS modelling defined guidelines to be applied by an extension service aimed at implementing better performing irrigation practices, and encouraged a good interaction between farmers and the Water Users Association, thus making easier the implementation of appropriate irrigation management programs.
Keywords:surface irrigation modelling; precise land levelling; irrigation systems design; beneficial water use; decision support systems (DSS); inflow rates; cut-off time
1. Introduction
The Yellow River basin is a water scarce region, with low water availability; about 500 m3per capita per year [1]. Agricultural irrigation corresponds to close to 90% of the total water use in the basin [2], and is particularly important in the Hetao Irrigation District. Climate change is likely a main cause for a decrease of water availability during the last decades [3–5], while increased water abstractions for industrial and domestic uses highly exacerbate water scarcity [2]. Forecasted scenarios on water resources allocation and use in the Yellow River basin point out the need to reduce irrigation water use [6].
The reduction of water resources allocation for irrigation due to the increased demand by non-agricultural sectors has unbalanced traditional irrigation management [6–9] and resulted in
heavy challenges for the future use of water for irrigation. Thus, major priorities in the upper Yellow River basin refer to developing and implementing appropriate technologies aimed at water saving, improved water productivity, and increased farmer’s incomes [7]. Since basin irrigation is the most used irrigation method in the 570,000 ha of irrigated land of Hetao, there is a requirement to focus on improving basin irrigation, which implies precise land levelling, appropriate inflow discharges and cut-off times, and adopting improved crop irrigation schedules [10–14], as well as improved supply management, namely modernizing canal conveyance and the distribution service aimed at upgrading water delivery and reducing runoff and seepage wastages [12,15–17]. When soils are saline [18], basin irrigation modernization also needs to consider salinity control practices [12,17,19], mainly adopting improved out of season autumn irrigation to appropriately leach the salts out of the soil’s root zone. In addition, because water-saving practices impact groundwater dynamics [9,20], it is required that mutual influences of groundwater-irrigation are assessed and target groundwater depths are defined [21].
It is known that the performance of surface irrigation systems highly depends upon design and management [17,22–25]. Thus, appropriate design procedures and modelling are required because surface irrigation design based on simulation models produces results more easily, provides a better description of runoff and infiltration processes and the assessment of expected system performance, and results in the improved quality of design solutions [23–25]. In fact, there are a variety of factors that influence surface irrigation performance and shall be considered in the design: soil infiltration rates, hydraulic roughness, inflow discharge and duration, field length and slope, land shape, and surface micro-topography, as well as irrigation scheduling and control of salinity [17,22–29]. In addition, design must consider the negative impacts of irrigation, such as operational water losses by deep percolation and runoff out of the fields, water erosion due to surface flow, or relative to the control of fertilizer and chemical pollution and/or to control health impacts of irrigation with treated wastewater [29].
Decision support systems (DSS) aimed at the design of surface irrigation [30–32] may be the most adequate design tools because they may integrate data, models, and other calculation tools that focus on the various factors and impacts referred to above and, therefore, can be utilised for the easy creation of design alternatives. In addition, DSS integrate computational facilities that rank the considered design solutions, thus supporting design decision making. Ranking may be performed with multi-criteria analysis (MCA) [33], which identifies the compatibility among contradictory design criteria such as those relative to water saving and economic viability [34,35].
The application of DSS models for irrigation design easily associates issues relative to the hydraulics of the system with factors determining the irrigation performance and the environmental and economic results [30,36–39]. They are appropriate to be used in Hetao to assess solutions for water saving and economic returns for farmers because related design solutions depend upon numerous factors. However, design solutions cannot be field validated and model generated design alternatives have to be assessed and ranked to support the selection of the “best” solution, i.e., the alternative that better satisfies the design criteria. Thus, models and computational tools used by the DSS to create the design alternatives need to be parameterized using field data and validated models. Considering that good results were previously obtained with the DSS SADREG in surface irrigation design applied to wheat and cotton in Syria and Central Asia [31,34], this DSS model was selected for the current application to wheat in the Dengkou area of Hetao.
The objective of the present study was to assess and rank several design alternatives developed for basin irrigation applied to wheat in the experimental area of Dengkou, in the south-eastern part of Hetao. With this objective, the DSS model SADREG was used to create and rank various design alternatives. Ranking was performed with MCA considering two groups of design criteria, one relative to water saving and the other to economic returns. To appropriately parameterize SADREG, previous studies were developed during three years in the Dengkou area, one relative to basin irrigation [13], and the other to crop irrigation management [14], which provided field data for validating the simulation tools integrated in SADREG. Further objectives refer to preparing for extending the use
of the DSS model for surface irrigation design to other areas of Hetao as a base for implementing irrigation water saving and modernization at the farm level.
2. Materials and Methods 2.1. The Study Area
The Hetao irrigation district is located in the upper reaches of the Yellow River and is one of the three largest irrigation districts of China, with 570,000 ha of irrigated land, and is 250 km long and 50 km wide (Figure1). Hetao has an arid continental monsoon climate, with an average annual rainfall of 200 mm. According to the Köppen classification [40], the climate is BWk, with hot and dry summers and long, dry, and severely cold winters, which extend from November to March. Agriculture is only feasible during the spring-summer crop season and when irrigated.
validating the simulation tools integrated in SADREG. Further objectives refer to preparing for extending the use of the DSS model for surface irrigation design to other areas of Hetao as a base for implementing irrigation water saving and modernization at the farm level. 2. Materials and Methods 2.1. The Study Area The Hetao irrigation district is located in the upper reaches of the Yellow River and is one of the three largest irrigation districts of China, with 570,000 ha of irrigated land, and is 250 km long and 50 km wide (Figure 1). Hetao has an arid continental monsoon climate, with an average annual rainfall of 200 mm. According to the Köppen classification [40], the climate is BWk, with hot and dry summers and long, dry, and severely cold winters, which extend from November to March. Agriculture is only feasible during the spring‐summer crop season and when irrigated.
Figure 1. Map of the Hetao Irrigation District with representation of: (a) main irrigation drainage canals, (b) cropped areas, in green; (c) location of the Dengkou experimental area (Wu et al. [18]).
Water diverted from the Yellow River for irrigation totals about 5.2 billion m3 year−1 [41,42]. To
address water scarcity and the demand of non‐irrigation water user’ sectors, the Yellow River Water Conservancy Commission decided that diversions for irrigation in Hetao should be reduced to nearly 4.0 billion m3 year−1. However, a heavy reduction of water available for agriculture may have
very important social impacts and a more flexible water allocation policy is advocated [43], limiting restrictions to irrigation water use to 10% in dry years. In addition, there are limitations in using groundwater due to salinity [18,44] and the presence of arsenic [45]. Only a small area is irrigated with groundwater and uses drip irrigation. Xu et al. [9,20] provided descriptions of the Hetao surface and groundwater systems and respective interactions as influenced by irrigation. Recent analysis of water use in Hetao includes a study on the water footprint of crop production [46] and an assessment of crop evapotranspiration dynamics [47].
The conveyance and distribution system of Hetao consists of seven levels of irrigation canals. The first main canal is gravity‐fed from the Yellow River, with head‐works located nearby Dengkou city and along the river (Figure 1). This first main canal supplies the main canals that flow South to
Figure 1. Map of the Hetao Irrigation District with representation of: (a) main irrigation drainage canals, (b) cropped areas, in green; (c) location of the Dengkou experimental area (Wu et al. [18]).
Water diverted from the Yellow River for irrigation totals about 5.2 billion m3year−1[41,42]. To address water scarcity and the demand of non-irrigation water user’ sectors, the Yellow River Water Conservancy Commission decided that diversions for irrigation in Hetao should be reduced to nearly 4.0 billion m3year−1. However, a heavy reduction of water available for agriculture may have very important social impacts and a more flexible water allocation policy is advocated [43], limiting restrictions to irrigation water use to 10% in dry years. In addition, there are limitations in using groundwater due to salinity [18,44] and the presence of arsenic [45]. Only a small area is irrigated with groundwater and uses drip irrigation. Xu et al. [9,20] provided descriptions of the Hetao surface and groundwater systems and respective interactions as influenced by irrigation. Recent analysis of water use in Hetao includes a study on the water footprint of crop production [46] and an assessment of crop evapotranspiration dynamics [47].
The conveyance and distribution system of Hetao consists of seven levels of irrigation canals. The first main canal is gravity-fed from the Yellow River, with head-works located nearby Dengkou city and along the river (Figure1). This first main canal supplies the main canals that flow South
to North. Secondary drains also flow in the same direction into a main drain that flows West to East into a great lake. There are 61 areas served by the main and sub-main irrigation canals, named divisions, averaging ca. 9300 ha each. Branch and lower order canals of each division are managed by Water Users Associations (WUA), namely to deliver water to farms and to clean canals from deposited sediments carried by the irrigation water. Main and sub-main canals and drains, as well as the head-works and the drainage pumping station, are managed by the Hetao Administration, which is in charge of water allocation policies, water measurements, water fees, and the modernization of hydraulic structures.
An experimental area has been installed in Dengkou, in the upstream part of Hetao and where irrigation water is supplied by the Dongfeng canal (Figure1). It is a main canal, 63 km long, designed for a discharge of 25 m3s−1, and that supplies a division comprising 480 irrigation sectors and a total irrigated area of 16,300 ha. The branch and distributor canals that deliver water to the farms are currently being upgraded. A rotation delivery scheme is applied by the WUA, with fields supplied with a nearly constant discharge during each irrigation event. The application time is defined by the WUA depending upon the farmer’s demand and the available water. The experimental area of Dengkou consists of a sector with 33.4 ha, with 394 land parcels and 210 farmers. The most common crops are maize, wheat, and sunflower, sometimes intercropped [14]. Experimentation is performed in the farmers’ fields and respective irrigation management is agreed with the WUA.
2.2. Weather and Soils Data
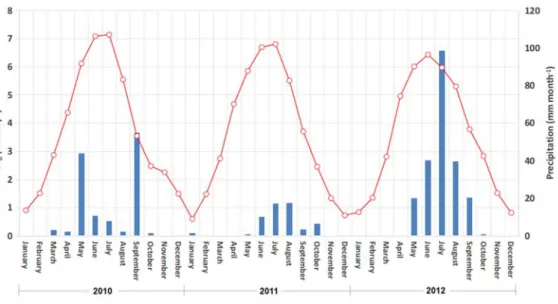
Daily weather data, including precipitation, maximum and minimum air temperature (◦C), maximum and minimum relative humidity (%), wind speed (m s−1), and sunshine duration (h) were recorded in an automatic weather station (40◦130N, 107◦050E, and 1048 m elevation) located within the experimental area. Precipitation and grass reference evapotranspiration (ETo) computed with the FAO-PM method [48] are shown in Figure2, relative to the period of experimentation, 2010–2012. It may be noticed that rainfall is much smaller than ETo and highly varies with time. Differently, ETovaries little and its variability relates to the occurrence of rainfall in Summer.
Water 2018, 10, 67 4 of 23
North. Secondary drains also flow in the same direction into a main drain that flows West to East into a great lake. There are 61 areas served by the main and sub‐main irrigation canals, named divisions, averaging ca. 9300 ha each. Branch and lower order canals of each division are managed by Water Users Associations (WUA), namely to deliver water to farms and to clean canals from deposited sediments carried by the irrigation water. Main and sub‐main canals and drains, as well as the head‐works and the drainage pumping station, are managed by the Hetao Administration, which is in charge of water allocation policies, water measurements, water fees, and the modernization of hydraulic structures.
An experimental area has been installed in Dengkou, in the upstream part of Hetao and where irrigation water is supplied by the Dongfeng canal (Figure 1). It is a main canal, 63 km long, designed for a discharge of 25 m3 s−1, and that supplies a division comprising 480 irrigation sectors
and a total irrigated area of 16,300 ha. The branch and distributor canals that deliver water to the farms are currently being upgraded. A rotation delivery scheme is applied by the WUA, with fields supplied with a nearly constant discharge during each irrigation event. The application time is defined by the WUA depending upon the farmer’s demand and the available water. The experimental area of Dengkou consists of a sector with 33.4 ha, with 394 land parcels and 210 farmers. The most common crops are maize, wheat, and sunflower, sometimes intercropped [14]. Experimentation is performed in the farmers’ fields and respective irrigation management is agreed with the WUA.
2.2. Weather and Soils Data
Daily weather data, including precipitation, maximum and minimum air temperature (°C), maximum and minimum relative humidity (%), wind speed (m s−1), and sunshine duration (h) were recorded in an automatic weather station (40°13′N, 107°05′E, and 1048 m elevation) located within the experimental area. Precipitation and grass reference evapotranspiration (ETo) computed with the FAO‐PM method [48] are shown in Figure 2, relative to the period of experimentation, 2010–2012. It may be noticed that rainfall is much smaller than ETo and highly varies with time. Differently, ETo varies little and its variability relates to the occurrence of rainfall in Summer. Figure 2. Monthly precipitation ( ) and daily reference evapotranspiration ( ) observed in the Dengkou experimental area during the three years of experimentation, 2010–2012.
The soil in the experimental area is a siltic irragric Anthrosol [49] originated from sediments deposited by the Yellow River. Main soil textural and hydraulic properties were obtained from sampling in various locations within the study area. The texture of Dengkou soils is generally silt loamy in the upper layers, until a 0.60 m depth, and silt clay can be found below that depth. Soil
Figure 2. Monthly precipitation (
North. Secondary drains also flow in the same direction into a main drain that flows West to East into a great lake. There are 61 areas served by the main and sub-main irrigation canals, named divisions, averaging ca. 9300 ha each. Branch and lower order canals of each division are managed by Water Users Associations (WUA), namely to deliver water to farms and to clean canals from deposited sediments carried by the irrigation water. Main and sub-main canals and drains, as well as the head-works and the drainage pumping station, are managed by the Hetao Administration, which is in charge of water allocation policies, water measurements, water fees, and the modernization of hydraulic structures.
An experimental area has been installed in Dengkou, in the upstream part of Hetao and where irrigation water is supplied by the Dongfeng canal (Figure 1). It is a main canal, 63 km long, designed for a discharge of 25 m3 s−1, and that supplies a division comprising 480 irrigation sectors and a total irrigated area of 16,300 ha. The branch and distributor canals that deliver water to the farms are currently being upgraded. A rotation delivery scheme is applied by the WUA, with fields supplied with a nearly constant discharge during each irrigation event. The application time is defined by the WUA depending upon the farmer’s demand and the available water. The experimental area of Dengkou consists of a sector with 33.4 ha, with 394 land parcels and 210 farmers. The most common crops are maize, wheat, and sunflower, sometimes intercropped [14]. Experimentation is performed in the farmers’ fields and respective irrigation management is agreed with the WUA.
2.2. Weather and Soils Data
Daily weather data, including precipitation, maximum and minimum air temperature (°C), maximum and minimum relative humidity (%), wind speed (m s−1), and sunshine duration (h) were recorded in an automatic weather station (40°13′N, 107°05′E, and 1048 m elevation) located within the experimental area. Precipitation and grass reference evapotranspiration (ETo) computed with the FAO-PM method [48] are shown in Figure 2, relative to the period of experimentation, 2010–2012. It may be noticed that rainfall is much smaller than ETo and highly varies with time. Differently, ETo varies little and its variability relates to the occurrence of rainfall in Summer.
Figure 2. Monthly precipitation ( ) and daily reference evapotranspiration ( ) observed in the Dengkou experimental area during the three years of experimentation, 2010–2012.
The soil in the experimental area is a siltic irragric Anthrosol [49] originated from sediments deposited by the Yellow River. Main soil textural and hydraulic properties were obtained from sampling in various locations within the study area. The texture of Dengkou soils is generally silt loamy in the upper layers, until a 0.60 m depth, and silt clay can be found below that depth. Soil
) and daily reference evapotranspiration (
North. Secondary drains also flow in the same direction into a main drain that flows West to East into a great lake. There are 61 areas served by the main and sub-main irrigation canals, named divisions, averaging ca. 9300 ha each. Branch and lower order canals of each division are managed by Water Users Associations (WUA), namely to deliver water to farms and to clean canals from deposited sediments carried by the irrigation water. Main and sub-main canals and drains, as well as the head-works and the drainage pumping station, are managed by the Hetao Administration, which is in charge of water allocation policies, water measurements, water fees, and the modernization of hydraulic structures.
An experimental area has been installed in Dengkou, in the upstream part of Hetao and where irrigation water is supplied by the Dongfeng canal (Figure 1). It is a main canal, 63 km long, designed for a discharge of 25 m3 s−1, and that supplies a division comprising 480 irrigation sectors and a total irrigated area of 16,300 ha. The branch and distributor canals that deliver water to the farms are currently being upgraded. A rotation delivery scheme is applied by the WUA, with fields supplied with a nearly constant discharge during each irrigation event. The application time is defined by the WUA depending upon the farmer’s demand and the available water. The experimental area of Dengkou consists of a sector with 33.4 ha, with 394 land parcels and 210 farmers. The most common crops are maize, wheat, and sunflower, sometimes intercropped [14]. Experimentation is performed in the farmers’ fields and respective irrigation management is agreed with the WUA.
2.2. Weather and Soils Data
Daily weather data, including precipitation, maximum and minimum air temperature (°C), maximum and minimum relative humidity (%), wind speed (m s−1), and sunshine duration (h) were recorded in an automatic weather station (40°13′N, 107°05′E, and 1048 m elevation) located within the experimental area. Precipitation and grass reference evapotranspiration (ETo) computed with the FAO-PM method [48] are shown in Figure 2, relative to the period of experimentation, 2010–2012. It may be noticed that rainfall is much smaller than ETo and highly varies with time. Differently, ETo varies little and its variability relates to the occurrence of rainfall in Summer.
Figure 2. Monthly precipitation ( ) and daily reference evapotranspiration ( ) observed in the Dengkou experimental area during the three years of experimentation, 2010–2012.
The soil in the experimental area is a siltic irragric Anthrosol [49] originated from sediments deposited by the Yellow River. Main soil textural and hydraulic properties were obtained from sampling in various locations within the study area. The texture of Dengkou soils is generally silt loamy in the upper layers, until a 0.60 m depth, and silt clay can be found below that depth. Soil ) observed in the Dengkou experimental area during the three years of experimentation, 2010–2012.
The soil in the experimental area is a siltic irragric Anthrosol [49] originated from sediments deposited by the Yellow River. Main soil textural and hydraulic properties were obtained from sampling in various locations within the study area. The texture of Dengkou soils is generally silt
loamy in the upper layers, until a 0.60 m depth, and silt clay can be found below that depth. Soil textural and hydraulic properties were measured in a laboratory: texture was determined using a dry particle size analyser (HELOS RODOS, Sympatec, Clausthal-Zellerfeld, Germany); and the soil water retention curve was measured using a pressure plate extractor (model 1500F1, Soil Moisture Equipment Corp., Santa Barbara, CA, USA). Main soil physical characteristics are shown in Table1. The total available soil water (TAW) ranges from 200 to 260 mm m−1. Despite salinity occurring in large areas of Hetao, in the Dengkou area, the electrical conductivity of the saturation extract of the soil, ECe, ranges from 0.11 to 1.58 dSm−1. These values are smaller than the ECe threshold relative to the referred main crops [48]. Moreover, such low salinity levels do not affect infiltration.
Table 1.Main soil textural and hydraulic properties of the soil in Dengkou (from [14]).
Depth (m) Particle Size Distribution (%) Soil Water Content (cm
3cm−3)
Clay Silt Sand At Saturation At Field Capacity At Wilting Point
0–0.20 23.0 76.7 0.3 0.47 ± 0.01 0.36 ± 0.01 0.16 ± 0.01
0.20–0.40 12.1 81.6 6.3 0.48 ± 0.01 0.37 ± 0.01 0.16 ± 0.01
0.40–0.60 14.6 84.2 1.2 0.49 ± 0.01 0.37 ± 0.01 0.16 ± 0.01
0.60–0.80 35.1 64.9 0.0 0.50 ± 0.02 0.39 ± 0.02 0.17 ± 0.02
0.80–1.00 42.5 57.5 0.0 0.52 ± 0.02 0.41 ± 0.02 0.18 ± 0.02
Following previous studies [13], infiltration is described by the Kostiakov equation [50]:
Z=K·τa (1)
where Z is the cumulative infiltration depth (m), τ is the infiltration time (min), and K (m min−a) and a (dimensionless) are empirically adjusted parameters. Because the duration of the water application in basin irrigation is small, the intake rate derived from Equation (1) does not significantly under-estimate infiltration at the end of irrigation [50]; thus, a third parameter representing the basic infiltration rate was not considered.
A large number of field measurements of irrigation events in Dengkou determined six standard infiltration curves [13]. Field basin infiltrometer tests [28] were performed, which provided a first estimation of the parameters K and a (Equation (1)). Later, these parameters were optimized using field advance and recession observations through the application of the inverse method [51,52] with the model SIRMOD [53]. This is a mechanistic surface irrigation simulation model aimed at the numerical solution of the Saint-Venant Equations for the conservation of mass and momentum [28].
Results of the infiltration tests performed have shown that the cumulative infiltration in silty soils increases with the precision of the adopted land levelling. Tests have also shown that infiltration rates decreased from the first to the following irrigation events, particularly for the precision levelled basins [13]. This behaviour was also observed in the nearby Huinong area [11] and by Bai et al. [26] in the North China Plain. It is likely due to the deposition of detached soil particles by the flowing water, which reduces infiltration due to the clogging of surface soil pores.
Six standard infiltration curves (SC-I to SC-VI) were obtained for the Dengkou silty soils from field observations [13]. For operational purposes, following the approach by Walker et al. [50], infiltration curves were clustered into three infiltration families (Figure3) characterized by:
(i) High infiltration rates, when the first irrigation event is described by the observed curve SC-I, the second event to the curve SC-II, and the third and following events to the SC-III curve; (ii) Medium infiltration rates, with the first event described by the curve SC-III, the second event by
the curve SC-IV, and the third and following events by the curve SC-V; and
(iii) Low infiltration rates, where the first irrigation event is described by the curve SC-IV, the second event by the curve SC-V, and the third and later events by the curve SC-VI.
The K and a parameters relative to the infiltration curves are given in Figure3. The distribution of high, medium, and low infiltration soils in the study area corresponds to 7–9%, 70–72%, and 20–22%, respectively. Further information on the methodologies applied is provided in Miao et al. [Water 2018, 10, 67 136 of 23 ,14].
Figure 3. Cumulative infiltration curves SC‐I to SC‐VI characterizing the infiltration families relative to high, medium, and low infiltration rates represented with blue, red, and violet lines, respectively. 2.3. Irrigation and Yield Data A survey on basin irrigation has been performed in the Dengkou experimental area [13] and the results have been used in the current design study. The typical sizes of field parcels and respective inflow discharges are summarized in Table 2. Irrigation basins commonly have a length of 50 m and widths ranging from 7 to 50 m. The wider fields often have more than one inlet. The field topography is flat but micro‐topography is uneven. Table 2. Field sizes and inflow discharges observed in Dengkou. Field Sizes Length ×Width (m) Field Area (ha) Inflow Discharge (Ls−1) Field Sizes Occurrence in the Area (%) 50 × 10 0.05 10 ± 2 10 50 × 30 0.15 15 ± 3 30 65 × 20 0.30 20 ± 4 20 65 × 40 0.60 25 ± 5 10 100 × 25 0.25 15 ± 3 10 100 × 50 0.50 25 ± 5 20
A land levelling survey was also performed in several field parcels [13] with traditional and precise land levelling using the methodology described by Dedrick et al. [54]. The traditional land levelling (TL) consists of land smoothing using rudimentary equipment and practices and is performed by farmers without the support of topography surveys, hence resulting in a poor micro‐topography and an uneven land surface. Differently, precise land levelling (PL) is performed with modern laser controlled levelling equipment, which provides a very regular soil surface with the target slopes. Precise land levelling is already well known in North China, including relative to its impacts on irrigation performance [25,26,55]. The latter were studied in Dengkou [13]. This study recognized the effects of inflow discharge control and irrigation scheduling on performance when aiming at water saving and higher crop yields.
The survey collected field data provided for calculating cut and fill volumes, and operation time and costs. Basin slopes were selected using terrain elevation data obtained by performing a field topography survey. It resulted in the following target slopes: zero cross slope for all cases, zero longitudinal slope (So) for level basins (LB), and So of 0.5‰ and 1.0‰ for graded basins (GB). The
land levelling survey determined the following economic and technical parameters to be used in basin irrigation design:
Figure 3.Cumulative infiltration curves SC-I to SC-VI characterizing the infiltration families relative to high, medium, and low infiltration rates represented with blue, red, and violet lines, respectively. 2.3. Irrigation and Yield Data
A survey on basin irrigation has been performed in the Dengkou experimental area [13] and the results have been used in the current design study. The typical sizes of field parcels and respective inflow discharges are summarized in Table2. Irrigation basins commonly have a length of 50 m and widths ranging from 7 to 50 m. The wider fields often have more than one inlet. The field topography is flat but micro-topography is uneven.
Table 2.Field sizes and inflow discharges observed in Dengkou. Field Sizes
Length×Width (m) Field Area (ha) Inflow Discharge (Ls−1)
Field Sizes Occurrence in the Area (%) 50×10 0.05 10±2 10 50×30 0.15 15±3 30 65×20 0.30 20±4 20 65×40 0.60 25±5 10 100×25 0.25 15±3 10 100×50 0.50 25±5 20
A land levelling survey was also performed in several field parcels [13] with traditional and precise land levelling using the methodology described by Dedrick et al. [54]. The traditional land levelling (TL) consists of land smoothing using rudimentary equipment and practices and is performed by farmers without the support of topography surveys, hence resulting in a poor micro-topography and an uneven land surface. Differently, precise land levelling (PL) is performed with modern laser controlled levelling equipment, which provides a very regular soil surface with the target slopes. Precise land levelling is already well known in North China, including relative to its impacts on irrigation performance [25,26,55]. The latter were studied in Dengkou [13]. This study recognized the effects of inflow discharge control and irrigation scheduling on performance when aiming at water saving and higher crop yields.
The survey collected field data provided for calculating cut and fill volumes, and operation time and costs. Basin slopes were selected using terrain elevation data obtained by performing a field topography survey. It resulted in the following target slopes: zero cross slope for all cases, zero longitudinal slope (So) for level basins (LB), and Soof 0.5‰ and 1.0‰ for graded basins (GB). The land levelling survey determined the following economic and technical parameters to be used in basin irrigation design:
(i) Operation time for maintenance: 3–4 and 4–5 h ha−1for TL and PL basins, respectively, depending upon the distances between cut and fill sites, the power of the levelling equipment, the experience of the operator, and the soil conditions;
(ii) Hourly operation costs: 80 to 120 Yuan h−1for TL basins and 200 to 240 Yuan h−1for PL basins, with prices depending upon the equipment power and size;
(iii) Quality of land forming as expressed by the root mean of squared deviations between observed and target land elevations: 6 to 10 cm for TL basins and less than 4 cm for PL;
(iv) Frequency of land levelling maintenance: annual for both TL and PL basins.
According to observations [56], the spring wheat yield of 6000 kg ha−1 can be assumed for non-stressed conditions, i.e., full irrigation in a low salinity soil. The previous field and simulation study on the wheat crop irrigation scheduling [14] was used herein. The improved full irrigation scheduling implies a seasonal net irrigation depth of 300 mm with three irrigation events of 100 mm each. The irrigation practice includes, in addition to summer irrigation, out of season autumn irrigation, which is performed after the crop season and applies a high irrigation depth, usually close to 250 mm or larger, particularly when the soil salinity is high. The main objectives of autumn irrigation consist of: (a) controlling soil salinity through leaching the salts out of the root zone; (b) to improve soil structure, porosity, and permeability, due to the effect of successive soil water freezing and melting during winter; and (c) to store water in the soil to be available for cropping in early spring. Related processes are well known [57–59]. Following Li et al. [59,60], an irrigation depth of 230 mm was assumed adequate to leach the salts out of the root zone. Crop season and autumn irrigation data are summarized in Table3.
Table 3.Water use components relative to current and improved wheat irrigation schedules (from [16]).
Irrigation Schedules Number Irrigation Events Net Target Irrigation Depth (mm) Season Net Irrigation (mm) Autumn Irrigation (mm) Effective Rainfall (mm) ETc act (mm) Tc act (mm) Yield (kg ha−1) Present 3 95 285 250 60 629 568 5880 Improved 3 100 300 230 60 644 574 6000
Notes: ETc act—actual crop evapotranspiration; Tc act—actual crop transpiration.
To estimate the yield impacts of the various irrigation alternatives, the yield response curve proposed by Solomon [61] was adopted:
Ya/Ymax= f(Wa/Wmax) (2)
where Yaand Ymaxare the actual and the maximum yield (kg ha−1), respectively; Wais the actual net irrigation water applied (mm); and Wmaxis the net water required to achieve Ymax. The respective parameterization is performed with the data in Table4, which applies to Dengkou soils with low salinity and is based upon regionally observed data [56,62].
Table 4.Parameters used in the water-yield function. Wa/Wmax 0.5 0.75 1.0 1.5 2.0
2.4. Irrigation Performance
The irrigation performance indicators used consist of the distribution uniformity (DU, %) and the beneficial water use fraction (BWUF, %) [63]. DU is defined as:
DU= Zlq
Zavg
×100 (3)
where Zlqis the average low quarter depth of water infiltrated (mm) and Zavgis the average depth of water infiltrated in the whole irrigated field (mm). Two equations are used for BWUF to distinguish the cases of over-irrigation (Zlq> Zreq) and under-irrigation (Zlq< Zreq):
BWUF= ( Zreq D ×100 Zlq>Zreq Zlq D ×100 Zlq<Zreq (4)
where Zreqis the average depth (mm) required to refill the root zone in the quarter of the field having a higher soil water deficit, and D is the average water depth (mm) applied to the field. Zreqis estimated from measurements or using a soil water balance model. Zlqand Zavgare estimated from computing the depth of water infiltrated during the irrigation process with SIRMOD [53]. D is given by the product of the cut-off time (tco) and the average inflow rate (Qin).
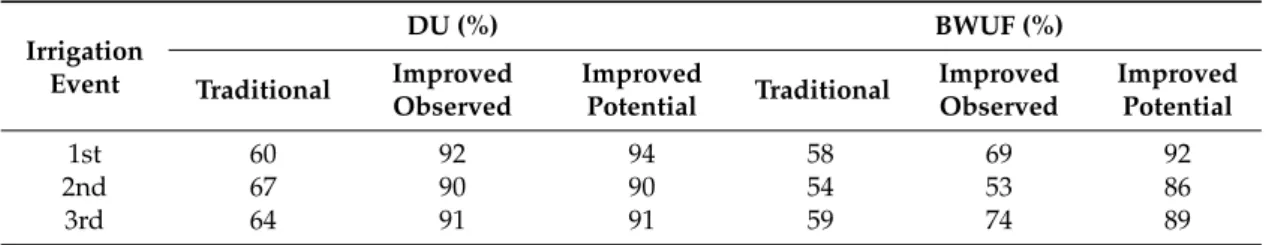
The previous field basin irrigation evaluations [13] estimated DU and BWUF for both TL and PL basins. The results in Table5clearly show that traditional irrigation is not able to achieve water saving and salinity control since DU and BWUF indicators are far behind the potential values. Contrarily, precise levelling provides a high DU in modernized basins. However, BWUF values show a large gap between observed and potential values when irrigations follow traditional scheduling. High BWUF values are only attainable when adopting well-adjusted tcoand Qin. Alternative values for tcoand Qin were therefore used in model design simulations.
Table 5. DU and BWUF obtained from observations in traditional and precise levelled basins for various irrigation events and their potential values (from Miao et al. [13]).
Irrigation Event DU (%) BWUF (%) Traditional Improved Observed Improved Potential Traditional Improved Observed Improved Potential 1st 60 92 94 58 69 92 2nd 67 90 90 54 53 86 3rd 64 91 91 59 74 89
2.5. The DSS Model SADREG and Multi-Criteria Analysis
SADREG is a decision support system developed to assist the process of designing and planning improvements in farm surface irrigation systems as described by Gonçalves and Pereira [30]. Applications include those by Gonçalves et al. [31] to Fergana, Central Asia, and by Darouich et al. [34,64] to eastern Syria. The design component applies database information and produces a set of alternatives in agreement with the user options and field conditions. The hydraulic simulations are performed with the simulation model SIRMOD [53], which is incorporated in SADREG. The procedure for creating the required design alternatives and for their evaluation and ranking, follows various steps:
(i) Creating the “workspace” with main field data relative to soil water retention and soil infiltration rate characteristics, Manning’s roughness coefficient, field length and width, longitudinal and cross slopes of the field, and land surface unevenness conditions;
(ii) Creating a “project” for selected combinations of workspace data, which characterizes the irrigation method, land levelling, crop data, field water supply, economic data, and number of units and outlets;
(iii) Grouping various projects to constitute a set of alternatives having different in-farm distribution systems and inflow rates Qin;
(iv) Application of associated model tools for land levelling design and for computing irrigation requirements, Zreq(mm);
(v) Performing the design simulation applying the SIRMOD model to every alternative, thus computing advance, wetting, and recession times, and infiltration depths, namely the average and the low quarter depths, Zavgand Zlq(mm), respectively;
(vi) Calculation of performance indicators for every alternative using the respective design data; (vii) Application of multi-criteria analysis for ranking the alternatives according to the defined design
criteria and user’s priorities, based on the respective performance attributes.
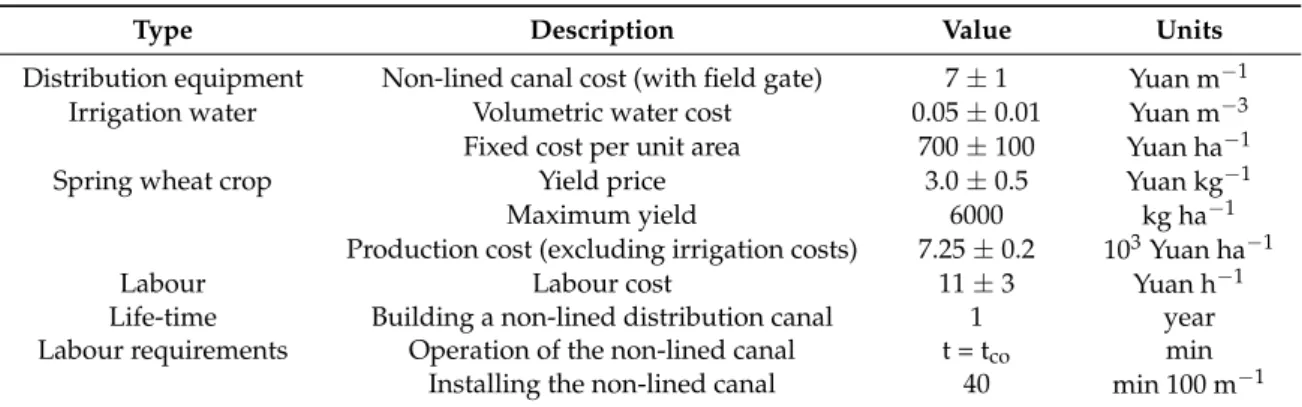
The economic and labour input data reported for 2010 are presented in Table6. At present, the farmer’s irrigation fees in Hetao are not computed in terms of water use but just depend on the irrigated area. Fees vary from 600 to 800 Yuan ha−1and cover WUA operation and maintenance (O&M) costs. The water price established by the Yellow River Commission for the water derived at the sector level ranges from 0.04 to 0.06 Yuan m−3. In the current study, an irrigation cost averaging 700 Yuan ha−1is considered, which is partitioned into a fixed cost of 420 Yuan ha−1for O&M, and a variable cost for the gross water use was assumed with a water price of 0.05 Yuan m−3.
Table 6.Economic and labour input data for wheat basin irrigation.
Type Description Value Units
Distribution equipment Non-lined canal cost (with field gate) 7±1 Yuan m−1
Irrigation water Volumetric water cost 0.05±0.01 Yuan m−3
Fixed cost per unit area 700±100 Yuan ha−1
Spring wheat crop Yield price 3.0±0.5 Yuan kg−1
Maximum yield 6000 kg ha−1
Production cost (excluding irrigation costs) 7.25±0.2 103Yuan ha−1
Labour Labour cost 11±3 Yuan h−1
Life-time Building a non-lined distribution canal 1 year
Labour requirements Operation of the non-lined canal t = tco min
Installing the non-lined canal 40 min 100 m−1
The Manning’s hydraulic roughness coefficient n = 0.20 m−1/3 s was used for hydraulic simulations of basin irrigation when fields were cropped with wheat. That n value was obtained from a former field study in the same area [65]. Other studies [11,25,66] support the assumption that the parameter n essentially depends upon tillage and plants density, but not upon the land slope or land levelling precision. Pereira et al. [11] reported that n values slightly increase from the first to the last irrigation due to crop development. However, because impacts of n values on simulated basin irrigation performances are reported to be small [25,67], the constant value n = 0.20 m−1/3s was assumed in the current study.
The irrigation methods considered are the flat level basin (LB) and the flat graded basin (GB). Precise land levelling (PL) with a null cross slope was considered with three options for the longitudinal slope (So): zero level, 0.5‰, and 1.0‰.
The inflow rates (Qin, L s−1m−1width) were defined in relation to the land parcel sizes (Table7), i.e., the combination length-width, with a larger Qinfor longer basins.
Table 7.Basin sizes and related unit inflow rates for modernized design alternatives.
Inflow Rate Identifier
Length 50 m Length 100 m Length 200 m
Width (m) Inflow Rate
(L s−1m−1) Width (m) Inflow Rate (L s−1m−1) Width (m) Inflow Rate (L s−1m−1) (S)mall 30 0.5 30 1.0 30 2.0 (M)edium 15 1.0 15 2.0 15 3.0 (L)arge 7.5 2.0 7.5 3.0 7.5 4.0
The modernization scenarios are represented by projects and groups of alternatives as indicated in Figure4. Projects refer to precision levelling (PL) and level basins (LB) and graded basins (GB) with Sovalues of 0.5‰ and 1.0‰ slope. Groups refer to basin lengths, and alternatives are discriminated according to inflow rates S, M, and L, defined in Table7in combination with basin widths.
Water 2018, 10, 67 10 of 23
discriminated according to inflow rates S, M, and L, defined in Table 7 in combination with basin widths.
Figure 4. Structure of setting alternatives: projects (traditional, level basin LB and graded basins GB with slopes of 0.5‰ and 1.0‰), grouped for field lengths of 50, 100, and 200 m, and alternatives having different inflow rates and field widths.
The evaluation and selection of the design alternatives is the last task in the design decision making process. That selection is a multiple objective problem, for which a rational solution often requires multi‐criteria analysis (MCA) to integrate different types of design attributes in a trade‐off process, thus comparing adversative objectives or criteria [68,69]. In irrigation, adversative objectives generally refer to environmental, water saving, and economic criteria.
Linear utility functions were used for each criterion j:
U α x β (5)
which are normalized in the [0,1] interval, with zero for the most adverse and 1 for the most advantageous result. The slope parameter α is negative for criteria whose highest values are the worse, e.g., costs and water use, and is positive for criteria whose higher values are the best, e.g., water productivity. For each alternative, the linear weighted summation method [70,71] calculated the global utility that represents the integrated score performance of the considered alternative:
U λ U (6)
where Uglob is the global utility, scaled in the [0,1] interval; Nc is the number of criteria (Nc=7 in this
application); λj is the weight assigned to criterion j; and Uj is the utility relative to criterion j
(Equation (5)). The decision criteria attributes, the respective weights, and the parameters of their linear utility functions (Equation (5)) are presented in Table 8. Overlapping or redundancy of criteria was checked and avoided.
The attributes relative to economic criteria are:
(i) Economic land productivity (ELP, €∙ha−1), the monetary yield value per unit of land;
(ii) Fixed irrigation costs (FIC, €∙ha−1), corresponding to investment costs per unit of land;
(iii) Variable irrigation costs (VIC, €∙ha−1), corresponding to the operation and maintenance costs per
unit of land; and
(iv) Economic water productivity ratio (EWPR, dimensionless), defined as the ratio of total yield value to the total irrigation costs [63].
Figure 4.Structure of setting alternatives: projects (traditional, level basin LB and graded basins GB with slopes of 0.5‰ and 1.0‰), grouped for field lengths of 50, 100, and 200 m, and alternatives having different inflow rates and field widths.
The evaluation and selection of the design alternatives is the last task in the design decision making process. That selection is a multiple objective problem, for which a rational solution often requires multi-criteria analysis (MCA) to integrate different types of design attributes in a trade-off process, thus comparing adversative objectives or criteria [68,69]. In irrigation, adversative objectives generally refer to environmental, water saving, and economic criteria.
Linear utility functions were used for each criterion j:
Uj=αjxj+βj (5)
which are normalized in the [0,1] interval, with zero for the most adverse and 1 for the most advantageous result. The slope parameter α is negative for criteria whose highest values are the worse, e.g., costs and water use, and is positive for criteria whose higher values are the best, e.g., water productivity. For each alternative, the linear weighted summation method [70,71] calculated the global utility that represents the integrated score performance of the considered alternative:
Uglob= Nc
∑
j=1
where Uglob is the global utility, scaled in the [0,1] interval; Ncis the number of criteria (Nc= 7 in this application); λjis the weight assigned to criterion j; and Uj is the utility relative to criterion j (Equation (5)). The decision criteria attributes, the respective weights, and the parameters of their linear utility functions (Equation (5)) are presented in Table8. Overlapping or redundancy of criteria was checked and avoided.
Table 8.Criteria attributes, utility functions, and weights.
Decision Criteria Attributes Symbol Units Weights (λj)
Utility Parameters (Equation (5))
α β
Economic Productivity and Costs
Economic land productivity ELP Yuan ha−1 0.20 1.25 × 10⁻⁴ −1.25
Fixed irrigation costs FIC Yuan ha−1 0.10 −2.50 × 10⁻⁴ 1
Variable irrigation costs VIC Yuan ha−1 0.10 −2.50 × 10⁻⁴ 1
Economic water productivity ratio EWPR ratio 0.10 0.25 1
Water Saving and Environment
Total irrigation water use IWU m3ha−1 0.20 −3.17 × 10⁻⁴ 1.95
Beneficial water use fraction BWUF 0.15 1.818 −0.727
Irrigation water productivity IWP kg m−3 0.15 −3.17 × 10⁻⁴ 1.95
The attributes relative to economic criteria are:
(i) Economic land productivity (ELP,€·ha−1), the monetary yield value per unit of land; (ii) Fixed irrigation costs (FIC,€·ha−1), corresponding to investment costs per unit of land;
(iii) Variable irrigation costs (VIC,€·ha−1), corresponding to the operation and maintenance costs per unit of land; and
(iv) Economic water productivity ratio (EWPR, dimensionless), defined as the ratio of total yield value to the total irrigation costs [63].
The attributes relative to water saving criteria consist of:
(i) Total irrigation water use (IWU, mm), corresponding to the seasonal gross irrigation depth (or irrigation volume, m3);
(ii) Beneficial water use fraction (BWUF, dimensionless), defined with Equation (4); and (iii) Irrigation water productivity (IWP, kg m−3), ratio of total yield to IWU (in m3).
Criteria are grouped into economic and water saving issues (Table8); thus an economic utility (UEC) and a water saving utility (UWS) were defined:
UEC= Nc(EC)
∑
i=1 λECiUECi/λEC (7) UWS= Nc(WS)∑
i=1 λWSiUWSi/λWS (8)where λECand λWSare the sums of the weights relative to the economic and water saving criteria, respectively, with λEC+ λWS= 1.0. The global utility corresponds to the sum of UECand UWS:
Uglob= Nc
∑
j=1
λjUj=λECUEC+λWSUWS. (9)
Solving Equation (9) in relation to UWSresults in
UWS = Uglob
λWS − λEC
that allows a Cartesian representation of Uglobin the UEC-UWSPlane, and where the Uglobisolines are straight lines with slopes depending upon the values of λECand λWS. That representation provides a better understanding of the impacts of water saving and economic results on the global utility.
To provide a sensitivity analysis of changes in the decision making priorities, several combinations of weights were used, starting when 20% of weights were assigned to farm economic results and 80% to water saving, and after considering pairs λEC-λWSof 40%-60%, 60%-40%, and 80%-20%. The weights λj used for the criteria attributes were consequently modified proportionally to those in Table 8, representing a balance between economic and water saving criteria (50% for each group).
3. Results and Discussion
3.1. Irrigation Water Use and Performance
Beneficial and non-beneficial water use (BWU and NBWU, m3ha−1) are compared in Figure5for 27 design alternatives. A smaller NBWU is achieved in level basin projects with a length of up to 200 m and for GB with 0.5‰ slopes when the length does not exceed 100 m. Naturally, a smaller NBWU corresponds to projects whose BWUF is higher and water productivity IWP is also higher (TableWater 2018, 10, 67 12 of 23 9).
Figure 5. Beneficial and non‐beneficial water use (BWU and NBWU , m3 ha−1) relative to
summer irrigation in a medium infiltration soil and considering level basins (LB) and graded basins (GB) with slopes of 1.0‰ and 0.5‰, with precise land levelling (PL); lengths of 50, 100, and 200 m; and inflow rates S, M, and L (defined in Table 7).
Main irrigation performance indicators relative to design alternatives for medium infiltration soils, the third irrigation event, and adopting an improved irrigation schedule, are presented in Table 9. These results indicate that: (i) Modernization projects may achieve a BWUF of up to 90% when deep percolation (DP) is well controlled, thus when basin irrigation is highly improved relative to traditional systems, which have an average BWUF of 60% and DP of 40%. (ii) Graded basin alternatives with a 200 m length and 1.0‰ slope are non‐satisfactory (BWUF < 60% and DP > 40%), and hence were not considered further in the selection analysis.
(iii) The relationship between inflow rates (Qin) and DU have been shown to be very weak, thus
indicating that the magnitude of Qin has small impacts on DU. However, as formerly observed
for medium and low infiltration silty soils in China, inflow rates Qin ≥ 2 L s−1 m−1 are required
[11,26,27]. This result also indicates that a high irrigation performance may be obtained with a flexible, varied inflow discharge. Differently, the cut‐off time plays a crucial role in adjusting the applied depth to its target to avoid over‐irrigation.
(iv) It was observed that So only slightly influences DU and that So=0‰ (level basins) generally
leads to a higher DU and BWUF. Poor results for long graded borders (L=200 m) are likely due to the fact that So> 0‰ simultaneously favours advance and a long recession time resulting in
high infiltration downstream, thus in a high DP and low DU.
(v) Irrigation water productivity is high (>1.8 kg m−3) for LB and GB with So=0.5‰ with a 50 m
length, and for LB with a 100 m or 200 m length.
(vi) Relationships of field length (L) with DU are also quite weak, which may indicate that long basins are feasible but their performance depends on the combination So‐Qin.
Figure 5. Beneficial and non-beneficial water use (BWU
Water 2018, 10, 67 12 of 23
Figure 5. Beneficial and non-beneficial water use (BWU and NBWU , m3 ha−1) relative to summer irrigation in a medium infiltration soil and considering level basins (LB) and graded basins (GB) with slopes of 1.0‰ and 0.5‰, with precise land levelling (PL); lengths of 50, 100, and 200 m; and inflow rates S, M, and L (defined in Table 7).
Main irrigation performance indicators relative to design alternatives for medium infiltration soils, the third irrigation event, and adopting an improved irrigation schedule, are presented in Table 9. These results indicate that:
(i) Modernization projects may achieve a BWUF of up to 90% when deep percolation (DP) is well controlled, thus when basin irrigation is highly improved relative to traditional systems, which have an average BWUF of 60% and DP of 40%.
(ii) Graded basin alternatives with a 200 m length and 1.0‰ slope are non-satisfactory (BWUF < 60% and DP > 40%), and hence were not considered further in the selection analysis.
(iii) The relationship between inflow rates (Qin) and DU have been shown to be very weak, thus indicating that the magnitude of Qin has small impacts on DU. However, as formerly observed for medium and low infiltration silty soils in China, inflow rates Qin ≥ 2 L s−1 m−1 are required [11,26,27]. This result also indicates that a high irrigation performance may be obtained with a flexible, varied inflow discharge. Differently, the cut-off time plays a crucial role in adjusting the applied depth to its target to avoid over-irrigation.
(iv) It was observed that So only slightly influences DU and that So=0‰ (level basins) generally leads to a higher DU and BWUF. Poor results for long graded borders (L=200 m) are likely due to the fact that So> 0‰ simultaneously favours advance and a long recession time resulting in high infiltration downstream, thus in a high DP and low DU.
(v) Irrigation water productivity is high (>1.8 kg m−3) for LB and GB with So=0.5‰ with a 50 m length, and for LB with a 100 m or 200 m length.
(vi) Relationships of field length (L) with DU are also quite weak, which may indicate that long basins are feasible but their performance depends on the combination So-Qin.
and NBWU
Water 2018, 10, 67 12 of 23
Figure 5. Beneficial and non-beneficial water use (BWU and NBWU , m3 ha−1) relative to summer irrigation in a medium infiltration soil and considering level basins (LB) and graded basins (GB) with slopes of 1.0‰ and 0.5‰, with precise land levelling (PL); lengths of 50, 100, and 200 m; and inflow rates S, M, and L (defined in Table 7).
Main irrigation performance indicators relative to design alternatives for medium infiltration soils, the third irrigation event, and adopting an improved irrigation schedule, are presented in Table 9. These results indicate that:
(i) Modernization projects may achieve a BWUF of up to 90% when deep percolation (DP) is well controlled, thus when basin irrigation is highly improved relative to traditional systems, which have an average BWUF of 60% and DP of 40%.
(ii) Graded basin alternatives with a 200 m length and 1.0‰ slope are non-satisfactory (BWUF < 60% and DP > 40%), and hence were not considered further in the selection analysis.
(iii) The relationship between inflow rates (Qin) and DU have been shown to be very weak, thus indicating that the magnitude of Qin has small impacts on DU. However, as formerly observed for medium and low infiltration silty soils in China, inflow rates Qin ≥ 2 L s−1 m−1 are required [11,26,27]. This result also indicates that a high irrigation performance may be obtained with a flexible, varied inflow discharge. Differently, the cut-off time plays a crucial role in adjusting the applied depth to its target to avoid over-irrigation.
(iv) It was observed that So only slightly influences DU and that So=0‰ (level basins) generally leads to a higher DU and BWUF. Poor results for long graded borders (L=200 m) are likely due to the fact that So> 0‰ simultaneously favours advance and a long recession time resulting in high infiltration downstream, thus in a high DP and low DU.
(v) Irrigation water productivity is high (>1.8 kg m−3) for LB and GB with So=0.5‰ with a 50 m length, and for LB with a 100 m or 200 m length.
(vi) Relationships of field length (L) with DU are also quite weak, which may indicate that long basins are feasible but their performance depends on the combination So-Qin.
, m3 ha−1) relative to summer irrigation in a medium infiltration soil and considering level basins (LB) and graded basins (GB) with slopes of 1.0‰ and 0.5‰, with precise land levelling (PL); lengths of 50, 100, and 200 m; and inflow rates S, M, and L (defined in Table7).
Main irrigation performance indicators relative to design alternatives for medium infiltration soils, the third irrigation event, and adopting an improved irrigation schedule, are presented in Table9. These results indicate that:
(i) Modernization projects may achieve a BWUF of up to 90% when deep percolation (DP) is well controlled, thus when basin irrigation is highly improved relative to traditional systems, which have an average BWUF of 60% and DP of 40%.
(ii) Graded basin alternatives with a 200 m length and 1.0‰ slope are non-satisfactory (BWUF < 60% and DP > 40%), and hence were not considered further in the selection analysis.
(iii) The relationship between inflow rates (Qin) and DU have been shown to be very weak, thus indicating that the magnitude of Qin has small impacts on DU. However, as formerly observed for medium and low infiltration silty soils in China, inflow rates Qin≥2 L s−1m−1 are required [11,26,27]. This result also indicates that a high irrigation performance may be obtained with a flexible, varied inflow discharge. Differently, the cut-off time plays a crucial role in adjusting the applied depth to its target to avoid over-irrigation.
(iv) It was observed that So only slightly influences DU and that So= 0‰ (level basins) generally leads to a higher DU and BWUF. Poor results for long graded borders (L = 200 m) are likely due to the fact that So> 0‰ simultaneously favours advance and a long recession time resulting in high infiltration downstream, thus in a high DP and low DU.
(v) Irrigation water productivity is high (>1.8 kg m−3) for LB and GB with So= 0.5‰ with a 50 m length, and for LB with a 100 m or 200 m length.
(vi) Relationships of field length (L) with DU are also quite weak, which may indicate that long basins are feasible but their performance depends on the combination So-Qin.
Table 9.Irrigation performance and management indicators for various basin lengths, longitudinal slopes, and unit inflow rates in the case of medium infiltration soils.
Length (m) Slope (‰) Inflow Rate(1) Project Alternatives BWUF (%) DU (%) D (mm) DP (mm) tadv (min) tco (min) IWP(2) (kg m−3)
50 uneven Small Traditional-S 60.3 61.1 157 62 88 268 1.12
Medium Traditional-M 60.3 63.4 157 62 68 134 1.12 Large Traditional-L 60.2 67.0 157 62 48 67 1.12 0 Small LB-PL-50-S 90.1 90.0 111 11 96 186 1.80 Medium LB-PL-50-M 90.1 91.5 111 11 52 93 1.79 Large LB-PL-50-L 90.0 93.1 111 11 31 47 1.79 0.5 Small GB-0.5-PL-50-S 90.1 93.4 111 11 88 185 1.80 Medium GB-0.5-PL-50-M 90.0 92.7 111 11 48 93 1.80 Large GB-0.5-PL-50-L 89.9 92.5 111 11 29 46 1.80 1.0 Small GB-1.0-PL-50-S 84.4 85.8 118 18 83 197 1.72 Medium GB-1.0-PL-50-M 83.6 85.6 119 20 45 100 1.69 Large GB-1.0-PL-50-L 83.1 85.3 120 20 28 50 1.66 100 0 Small LB-PL-100-S 90.1 93.3 111 11 136 186 1.79 Medium LB-PL-100-M 90.0 92.9 111 11 77 93 1.79 Large LB-PL-100-L 90.1 92.7 111 11 60 62 1.94 0.5 Small GB-0.5-PL-100-S 85.1 87.0 117 17 121 195 1.75 Medium GB-0.5-PL-100-M 83.9 86.1 119 19 71 99 1.70 Large GB-0.5-PL-100-L 84.0 85.5 119 19 54 66 1.69 1.0 Small GB-1.0-PL-100-S 65.1 70.5 153 53 111 255 1.35 Medium GB-1.0-PL-100-M 70.7 75.1 141 41 66 118 1.39 Large GB-1.0-PL-100-L 70.1 75.1 142 43 50 79 1.37 200 0 Small LB-PL-200-S 90.1 93.0 111 11 198 186 1.77 Medium LB-PL-200-M 90.1 93.0 111 11 198 124 1.80 Large LB-PL-200-L 90.0 93.9 111 11 118 93 1.80 0.5 Small GB-0.05-PL-200-S 72.3 76.4 138 38 171 230 1.47 Medium GB-0.05-PL-200-M 71.7 75.8 139 39 128 154 1.42 Large GB0.05-PL-200-L 70.7 75.6 141 41 105 118 1.38 1.0 Small GB-0.10-PL-200-S 58.3 58.3 171 72 156 285 1.15 Medium GB-0.10-PL-200-M 46.5 55.3 214 115 117 238 0.77 Large GB-0.10-PL-200-L 51.1 59.7 195 95 97 163 0.83
Notes: BWUF—beneficial water use fraction; DU—distribution uniformity, gross irrigation depths; DP—deep percolation; tadv—advance time; tco—cut-off time; IWP—irrigation water productivity; LB and GB—level and graded basins; PL—precision land levelling;(1)inflow rates defined in Table7;(2)IWP computed for irrigation water use during the crop season.
To assess the effects of soil infiltration on the irrigation performance, particularly on irrigation water use (IWU), the results relative to several alternatives applied to soils with high, medium, and low infiltration (Figure3) are compared in Table10. In general, IWU values for low and medium infiltration soils are similar, with differences not exceeding 8%. Differently, the IWU values of high infiltration soils are different of those for medium infiltration soils, particularly for basin lengths larger than 100 m. No feasible solutions were found for long basins in high infiltration soils due to excessive infiltration and very high percolation.
Table 10.Gross irrigation water use (IWU, m3ha−1) during the crop season for several projects with medium inflow rates as influenced by soil infiltration—high, medium, and low (defined in Figure3).
Projects IWU (m
3ha−1) for Various Infiltration Rate Families
High Medium Low
LB-PL-50-M 3430 3360 3360 GB-0.5-PL-50-M 3410 3340 3330 GB-1.0-PL-50-M 3440 3550 3580 LB-PL-100-M 3530 3350 3350 GB-0.5-PL-100-M 3700 3520 3560 GB-1.0-PL-100-M 4010 4180 4160 LB-PL-200-M 4560 3330 3340 GB-0.5-PL-200-M 4670 4130 4160
Water saving, defined as the difference between the IWU of traditional irrigation (7350 m3ha−1) and IWU relative to the retained alternatives, was estimated for the various design alternatives (Figure6). IWU includes both the summer season and the autumn irrigation. The results in Figure6
show that projects LB and GB with So = 0.5‰ provide annual water savings ranging from 1520 to 1740 m3ha−1, i.e., 21% to 24% of IWU. LB perform slightly better than GB when the same basin length and inflow rate are considered. Water saving benefits of improved basin irrigation were reported in several studies carried out in China [7,11,13,27], Egypt [72], Portugal [30], Spain [73], and USA [74], supporting the assumption that water use decreases when the irrigation performance is improved.
Water 2018, 10, 67 14 of 23
Table 10. Gross irrigation water use (IWU, m3 ha−1) during the crop season for several projects with
medium inflow rates as influenced by soil infiltration—high, medium, and low (defined in Figure 3).
Projects IWU (m3ha−1) for Various Infiltration Rate Families
High Medium Low
LB‐PL‐50‐M 3430 3360 3360 GB‐0.5‐PL‐50‐M 3410 3340 3330 GB‐1.0‐PL‐50‐M 3440 3550 3580 LB‐PL‐100‐M 3530 3350 3350 GB‐0.5‐PL‐100‐M 3700 3520 3560 GB‐1.0‐PL‐100‐M 4010 4180 4160 LB‐PL‐200‐M 4560 3330 3340 GB‐0.5‐PL‐200‐M 4670 4130 4160 Water saving, defined as the difference between the IWU of traditional irrigation (7350 m3 ha−1)
and IWU relative to the retained alternatives, was estimated for the various design alternatives (Figure 6). IWU includes both the summer season and the autumn irrigation. The results in Figure 6 show that projects LB and GB with So=0.5‰ provide annual water savings ranging from 1520 to 1740
m3 ha‐1, i.e., 21% to 24% of IWU. LB perform slightly better than GB when the same basin length and
inflow rate are considered. Water saving benefits of improved basin irrigation were reported in several studies carried out in China [7,11,13,27], Egypt [72], Portugal [30], Spain [73], and USA [74], supporting the assumption that water use decreases when the irrigation performance is improved.
Figure 6.Water saving achievable by various design alternatives for level basins (LB) and graded basins (GB) with slopes of 1.0‰ and 0.5‰, with precise land levelling (PL); lengths of 50, 100, and 200 m; and inflow rates S, M, and L (as defined in Table 7) for a medium infiltration soil. 3.2. Economic Performance The economic attributes relative to various design alternatives adopting a medium inflow rate are presented in Table 11. The total irrigation costs (TIC), relative to both the summer season and the autumn irrigation, vary between 2408 and 3292 Yuan ha−1.Precision land levelling costs (1100 Yuan
ha−1) consist of the main component of TIC (33–46%). Considering that fixed water costs are 700
Yuan ha−1 (21–29% of TIC) and that variable water costs range from 269 to 328 Yuan ha−1 , i.e., only 8.8
to 13% of TIC, it can be inferred that the water operative costs are low and cannot play a large enough role as an incentive for water saving. Labour costs in traditional irrigation average 1330 Yuan ha−1, about 45% of TIC, while for modernized systems, the labour costs are smaller, varying
from 276 to 997 Yuan ha−1 (12–29% of TIC) because basin sizes are improved and processes of
Figure 6.Water saving achievable by various design alternatives for level basins (LB) and graded basins (GB) with slopes of 1.0‰ and 0.5‰, with precise land levelling (PL); lengths of 50, 100, and 200 m; and inflow rates S, M, and L (as defined in Table7) for a medium infiltration soil.
3.2. Economic Performance
The economic attributes relative to various design alternatives adopting a medium inflow rate are presented in Table 11. The total irrigation costs (TIC), relative to both the summer season and the autumn irrigation, vary between 2408 and 3292 Yuan ha−1.Precision land levelling costs (1100 Yuan ha−1) consist of the main component of TIC (33–46%). Considering that fixed water costs are 700 Yuan ha−1(21–29% of TIC) and that variable water costs range from 269 to 328 Yuan ha−1, i.e., only 8.8 to 13% of TIC, it can be inferred that the water operative costs are low and cannot play a large enough role as an incentive for water saving. Labour costs in traditional irrigation average 1330 Yuan ha−1, about 45% of TIC, while for modernized systems, the labour costs are smaller, varying from 276 to 997 Yuan ha−1(12–29% of TIC) because basin sizes are improved and processes of irrigation
![Figure 1. Map of the Hetao Irrigation District with representation of: (a) main irrigation drainage canals, (b) cropped areas, in green; (c) location of the Dengkou experimental area (Wu et al. [18]).](https://thumb-eu.123doks.com/thumbv2/123dok_br/18836628.928435/3.892.155.737.389.792/irrigation-district-representation-irrigation-drainage-location-dengkou-experimental.webp)
![Table 1. Main soil textural and hydraulic properties of the soil in Dengkou (from [14]).](https://thumb-eu.123doks.com/thumbv2/123dok_br/18836628.928435/5.892.122.774.372.503/table-main-soil-textural-hydraulic-properties-soil-dengkou.webp)

![Table 3. Water use components relative to current and improved wheat irrigation schedules (from [16]).](https://thumb-eu.123doks.com/thumbv2/123dok_br/18836628.928435/7.892.134.759.742.826/table-water-components-relative-current-improved-irrigation-schedules.webp)