I
NTERACTION
OF
V
ANADIUM
C
OMPOUNDS
WITH
DNA
Nataliya Butenko
Dissertação para obtenção do Grau de Doutor em Química
Trabalho efetuado sob a orientação de:
Declaração de autoria de trabalho
Declaro ser a autora deste trabalho, que é original e inédito. Autores e trabalhos consultados estão devidamente citados no texto e constam da listagem de referências incluída:
Copyright por Nataliya Butenko, estudante do Universidade do Algarve.
A Universidade do Algarve tem o direito, perpétuo e sem limites geográficos, de arquivar e publicitar este trabalho através de exemplares impressos reproduzidos em papel ou de forma digital, ou por qualquer outro meio conhecido ou que venha a ser inventado, de o divulgar através de repositórios científicos e de admitir a sua cópia e distribuição com objetivos educacionais ou de investigação, não comerciais, desde que seja dado crédito ao autor e editor.
"Whatever you are, or whatever has happened, just be glad. Be glad because you are here. You are here in a beautiful world; and all that is beautiful may be found in this world... Just be glad, and you always will be glad. You will always have better reason to be glad. You will have more and more things to make you glad. For great is the power of sunshine, especially human sunshine. It can change anything, transform anything, remake anything, and cause anything to be become as beautiful as itself. Just be glad and your fate will change; a new life will begin and a new future will dawn for you". Cristian D. Larson
Acknowledgements
I would like to express my profound gratitude to my advisor Prof. Dr. Isabel Cavaco for her excellent supervision, knowledge, all practical teachings, especially in agarose gel electrophoresis, immense help, continuous encouragement and support during my PhD work.
I wish to acknowledge several people who contributed to this work directly and indirectly:
- Professor João Costa Pessoa for giving me the opportunity to work in Centro de Química Estrutural, for welcoming and accepting me into his group, for keen interest and valuable suggestions;
- Professor José Paulo Pinheiro for teachings in voltammetry, constant support and willingness to help;
- Professor Vera Ribeiro for sharing her knowledge on plasmid DNA preparation and the opportunity to work in her laboratory;
- Professor Susana Etcheverry and her PhD student Ignacio León for collaboration, for kind and positive attitude in work;
- Doctor Isabel Tomaz for practical teachings and help in conducting Circular Dichroism and UV-Vis experiments as well as in synthesizing vanadium complexes, for her sincere interest and impressive dedication to work;
- Doctor Isabel Correia for practical teachings in NMR, for her boundless support, encouragement and friendship along these years;
- A big group in Centro de Química Estrutural, namely, Sérgio Marques, Sofia Gama, Gisela Gonçalves, Pedro Adão and many others for a very enjoyable work environment and the help to easily find my way around the laboratory; - Professor Igor Khmelinskii and Professor Jorge Martins for allowing to use
spectrofluorometry equipment;
- Miguel Manuel for practical teaching in Fluorescence;
- José Paulo da Silva for mass spectrometry experiments and corresponding discussions;
constant help in organizing my working process and friendly work environment; - My lab mates, Ana Luísa Ribeiro, Ana Catarina, Jorge Correia, Ana Guerreiro,
Ana Margarida Eufigénia, and Rute Félix, for creating an excellent atmosphere in the laboratory and constant help;
- A great team from International mobility office (namely, Mercês Covas, Paula Simões, Marleni Azevedo, Celia Oliveira, Sofia Nunes) and Igor Khmelinskii for taking care of organizational and paper work, and amicable relationships;
- My family, especially my mother, for being always there for me;
- All my friends for unconditional acceptance and boundless support, for being the sourse of continuous joy and laughter.
With deep respect and gratitude, in memory of Professor Lidiia Svirenko (1939-2011) who was my teacher and supervisor at the National Academy of Municipal Economy, Kharkiv (Ukraine). She was the first to introduce me to research and helped to carry out my first investigation. Special thanks to my teacher Yuri Vergeles. If it were not for him, I would probably not have learnt about the Erasmus Mundus program and the great opportunity to study in Portugal. I am also very grateful to my teacher Oleksandr Spirin who keeps my spirit high, encourages my personal development, and is always helpful in many aspects.
This work was financially supported by the Erasmus Mundus External Cooperation
Window Lot 6 and Fundação para a Ciência e Tecnologia (SFRH/BD/69444/2010).
Thanks to their granting, my work was successfully completed.
I would like to acknowledge Portuguese people for their hospitality and cordiality, willingness to help and create a delightful environment for foreigners.
Abstract
The DNA cleavage activity of several vanadium complexes (VC) was studied. The focus was on vanadium acetylacetonate, VIVO(acac)2, 1, and several β-diketonate
oxidovanadium(IV/V) derivatives: VIVO(hd)2 (2, hd = 3,5-heptanedione), V IV
O(Cl-acac) 2, (3,
Cl-acac = 3-chloro-2,4-pentanedione), VIVO(Et-acac)2 (4, Et-acac = 3-ethyl- 2,4-
pentanedione) and VIVO(Me-acac)2 (5, Me-acac = 3-methyl-2,4-pentanedione),
VV2O4(acac)2 (6), V V
O2(acac)(phen) (7, phen = 1,10-phenanthroline) and
VVO(OH)(OMe)(acac) (8). The nuclease activity of 28 additional vanadium, copper and nickel complexes was also analysed and compared.
The experimental techniques involved digestion of plasmid DNA (pDNA) followed by agarose gel electrophoreses to evaluate nuclease efficiency. pDNA was prepared and purified to assure the absence of interference from EDTA (ethylenediaminetetraacetic acid) and Tris present in commercial pDNA. The stability of complexes in aqueous solutions was studied by UV/vis spectroscopy and electroanalytical techniques, cyclic (CV) and square wave voltammetry (SWV). The nature of DNA cleavage mechanisms was assayed using fluorescent probes and 1H and 51V NMR spectroscopy.
VIVO(acac)2 was found to be efficient in cleaving pDNA. The extent of this pDNA cleavage is
dependent on buffer media. In organic buffers (Tris, HEPES MOPS) no significant changes are observed, whereas in phosphate medium the nuclease activity is remarkable. The activity of the different complexes follows the order 3>1≥2>>4~5. The V(V) derivatives, 6-8, do not show any significant activity, except in the presence of an oxidant activating agent. CV results show that 1-3 have a quasi-reversible electrochemical behaviour, while of 4 and
5 have an irreversible one, similar to 6.
The DNA cleavage by these complexes takes place through an oxidative mechanism. Complex 1 also cleaves DNA hydrolytically, however the reaction is too slow to compete with the radical mechanism.
In conclusion, phosphate buffer potentiates the DNA cleavage by VIVO(acac)2 derivatives
through a species which presents a quasi-reversible redox behaviour and facilitates the formation of ROS, probably a mixed V(IV)-V(V)-acac-phosphate complex.
Resumo
Este trabalho estuda a interação de complexos de vanádio com ADN, em particular a atividade nuclease do acetilacetonato de oxovánadio(IV), VIVO(acac)2, 1, e alguns dos seus
derivados: VO(hd)2 (2, hd = 3,5-heptanodiona), VO(Cl-acac)2, (3, Cl-acac =
3-cloro-2,4-pentanodiona), VO(Et-acac)2 (4, Et-acac = 3-etil-2,4-pentanodiona) e VO(Me-acac)2 (5,
Me-acac = 3-metil-2,4-pentanodiona), V2O4(acac)2 (6), VO2(acac)(phen) (7, phen =
1,10-fenantrolina) and VO(OH)(OMe)(acac) (8). O objetivo inicial foi identificar a(s) espécie(s) metálicas presentes em solução responsáveis pela degradação do ADN.
A atividade nuclease de seis compostos de vanádio e três compostos de cobre contendo aminoácidos e 1,10-fenantrolina e/ou 2,2‟-bipiridina como co-ligandos, 10-36, foi também analisada.
A eficiência da clivagem do ADN pelos complexos metálicos em soluções tamponizadas a pH 7 foi determinada por electroforese em gel de agarose. Comparou-se o efeito de diferentes tampões de pH sobre a atividade. A estabilidade dos complexos em solução aquosa foi estudada por espectroscopia de absorção molecular no UV-Vis e por técnicas electroanalíticas (voltametria cíclica e voltametria de onda quadrada). A natureza radicalar ou hidrolítica dos mecanismos de clivagem foi averiguada recorrendo a compostos modelo e usando técnicas de fluorescência molecular e de ressonância magnética nuclear.
O VO(acac)2 mostrou ser extremamente eficiente na clivagem de ADN (pADN), em
particular em soluções tamponizadas com fosfato. Não requer agentes ativadores, ar ou fotoirradiação para degradar o pADN. A clivagem de uma cadeia simples (“nicking”) observa-se na presença de concentrações de metal na ordem dos 1,2 µM (correspondendo a ri = 0,08, onde ri é a razão da concentração de metal para a concentração do ADN, em pares de bases). A extensão da clivagem aumenta à medida que a concentração de 1 aumenta, e para concentrações de metal da ordem dos 10 µM (ri = 0,7) observa-se a clivagem da dupla cadeia. Quando ri = 1,7 observa-se a degradação completa da forma superenrolada (Sc) do pADN.
atingindo a degradação completa da forma Sc para ri = 3,3. O complexo 3 é muito pouco solúvel em solução aquosa, mas ainda assim demonstra uma atividade nuclease razoável, sugerindo ser mais eficiente do que os anteriores. Os complexos 4 e 5 têm atividades semelhantes e muito inferiores a 1, não chegado a linearizar o pADN excepto para ri > 6,7. Os complexos 4 e 5 promovem a clivagem simples de uma cadeia a ri = 1,7.
O VOSO4 é frequentemente considerado um controlo negativo em ensaios de atividade
nuclease de compostos de vanádio. Neste estudo verificou-se que o VOSO4 (9) tem um
comportamento pouco reprodutível, nalguns ensaios apresenta uma atividade nuclease dependente da concentração tão forte como 1, enquanto noutros não apresenta qualquer atividade. É possível que esta falta de reprodutibilidade seja devida nalguns casos precipitação do oxovanádio como hidróxido. A precipitação resulta em pouca ou nenhuma atividade observada. Caso as condições da precipitação e a sua extensão sejam irreprodutíveis, a atividade observada resulta também irreprodutível.
A estabilidade em solução aquosa dos complexos 1–5 e 9 foi avaliada por espectroscopia de absorção molecular no UV/Vis. Verificou-se que 1 e 2 são razoavelmente estáveis nas primeiras 24 h em tampão fosfato, havendo apenas pequenas alterações no espectro ao fim de 2-4 h. Os complexos 4 e 5 têm um comportamento totalmente diferente, observando-se uma hidrólise significativa em menos de 1 h. O mesmo sucede com o complexo 9. O complexo 3 não é suficientemente solúvel em água, mas é muito estável em DMSO.
A diferente atividade dos complexos relaciona-se com a sua estabilidade em solução aquosa, seguindo a ordem 1≥2>>4~5. As nucleases fracas (4 e 5) são complexos instáveis que são rapidamente oxidados e hidrolisados a complexos de V(V) durante a primeira hora após dissolução numa solução tamponizada a pH 7. Esta observação é confirmada pelos resultados de voltametria cíclica: 1-3 apresentam um comportamento semelhante entre si, e muito diferente de 4 e 5. O comportamento electroquímico dos primeiros é quase-reversível, enquanto o dos segundos é claramente irreversível com um voltamograma semelhante ao do derivado de oxovanádio(V) (6).
excesso de ligando favorece a formação desta espécie em solução, relativamente ao metal livre e ao complexo VIVOL+. Ao adicionar excesso de acac a 1, observa-se uma diminuição progressiva da atividade à medida que a razão ligando/metal aumenta de 80 para 160. O efeito da presença de agentes redutores e de agentes oxidantes foi testada juntando oxona ou ácido mercaptopropiónico (MPA) à mistura reacional. Observou-se que a oxona favorece a eficiência da clivagem por 1. Por outro lado, o MPA reduz a atividade nuclease destes compostos, mas não totalmente. Estes efeitos são observados tanto quando a digestão é feita ao ar como em atmosfera de azoto.
A presença de H2O2 favorece fortemente a clivagem. O aumento da concentração de H2O2
tem um efeito muito menos significativo na degração do pADN do que o aumento da concentração de complexo.
A atividade nuclease dos derivados de oxidovanádio(V), 6-8, faz-se notar apenas na presença de oxona e em tampão fosfato. É improvável que o monovanadato (V1), o produto
mais comum da hidrólise e oxidação do vanádio(IV) em solução aquosa, seja a espécie responsável pela atividade nuclease de 1. Por si só, o V1 não exerce efeitos no pADN.
Embora na presença de oxona possa causar clivagem da cadeia simples, é muito menos eficiente do que 1.
A natureza e a concentração do tampão de pH são determinantes para a atividade nuclease. Demonstra-se que a extensão da clivagem do pADN causada por 1 depende grandemente do meio tampão, sendo maior em tampão fosfato do que em tampões orgânicos como HEPES, Tris e MOPS. A reação é sempre inibida na presença de MOPS, mesmo quando existe excesso de fosfato em solução, mas progride até à linearização do pADN na ausência daquele. O efeito do tampão foi estudado por electroforese em gel de agarose, espectroscopia de UV-Vis, voltametria cíclica e voltametria de onda quadrada e RMN de 1H e 51V.
Os resultados apontam para que as espécies responsáveis pela degradação observada no ADN em tampão fosfato sejam provavelmente espécies mistas contendo V(IV) e V(V), e os
espécies diferentes, possivelmente: VO(acac)2(H2PO4) 2 4 2 e VO(H2PO4)2.
A clivagem do ADN ocorre através de um mecanismo radicalar. A formação de radicais OH foi observada em ensaios de hidroxilação do ácido tereftálico (TPA), um método muito sensível para a sua detecção. Observa-se um aumento notável na intensidade de fluorescência, devida à formação de ácido hidroxitereftálico, ao misturar TPA com soluções aquosas de 1. Na presença de H2O2 a intensidade de fluorescência torna-se muito mais
alta do que na sua ausência, confirmando a libertação de OH. No entanto é possível que o radical superóxido ou radicais ligados ao complexo metálico sejam de fato as ROS que causam a clivagem oxidativa observada na ausência de agentes oxidantes.
Estudos por RMN de 1H e 51V, com modelos da ligação fosfodiéster mostram que o VO(acac)2 é capaz de clivar e promover a clivagem hidrolítica do ADN, e que as espécies
responsáveis são provavelmente tetravanadatos. No entanto, esta hidrólise é demasiado lenta (>24 h a 50 ºC) para competir com a reação radicalar que ocorre no tempo de incubação típico de 1 h a 37ºC.
A atividade nuclease de outros complexos de oxidovanádio(IV) e alguns complexos de cobre foi também avaliada e discutida.
Os complexos VO(acac-Naf)2 (10, acac-Naf = acetonaftalina), VO(tmh)2 (11, tmh =
2,2,6,6-tetrametil-3,5-heptanodiona), VO(pbd)2 (12, pbd = 1-Fenil-1,3-butadiona)), VO(acac-NH2)2
(13, acac-NH2 = acetoacetamida), VO(acac-NMe2)2 (14, N,N-dimetilacetoacetamida) são
outros derivados de 1 que foram estudados neste trabalho. Com a excepção de 10, que não induz qualquer clivaegem do ADN, 11-14 promovem a clivagem simples da dupla cadeia.
Cu(acac)2 (15) e Ni(acac)2 (16) foram testados como complexos com uma estrutura
quadrangular plana, com coordenação semelhante a 1. Ao contrário de 16, que não apresenta qualquer atividade nuclease, 15 induz “nicking”, mas aparentemente não dependente da concentração de complexo. A adição de agentes ativadores aumenta significativamente a atividade nuclease de 15, especialmente na presença de MPA, situação em que se observa a destruição completa do pADN. Este efeito do MP sugere um
Outro grupo de complexos estudados contém ácido picolínico na sua estrutura: VO(MPA)2
(17, MPA = ácido 6-metil-2-picolínico), VO(dmpp)2 (18, dmpp =
1-(3,4-dimetil-fenil)-piperazina) e VO(PA)2 (19, PA = ácido picolínico). O complexo 19 é o mais ativo, seguido
de 17 e 18. Tanto as bandas Nck como Lin aparecem para concentações de 25, 50 e 100 µM (ri 1.67, 3,3 e 6,7, respetivamente).
VO(oda) (20), VO(oda)phen (21) e VO(oda)bipy (23), onde “oda” é o ligando oxodiacetato e phen denota fenantrolina, são outros exemplos de nucleases eficientes. VO(phen)2 (22) foi
estudado como termo de comparação. Os quatro complexos interagem prontamente com o pADN, causando clivagem simples e dupla.
VO(morin)2 (24), VO(chrysin)2 (25), VO(clor) (26), e VO(silibinin)2 (27), complexos que
demonstaram efeitos antitumurais, não promovem qualquer clivagem significativa, mesmo quando ativados com oxona ou MPA.
Palavras-Chave: nucleases, Clivagem do ADN, acetilacetonato de vanádio, complexos de
Abbreviations
acac acetylacetone
AGE agarose gel electrophoresis
ADME adsorption, distribution, metabolism and excretion ATP adenosine 5´-triphosphate
BEOV bis(ethylmaltolato)oxidovanadium(IV) bipy 2,2'-bipyridine
chrysin 5,7-dihydroxyflavone Clor chlorogenic acid
Cl-acac 3-chloro-2,4-pentanedione
CD Circular dichroism
CV cyclic voltammetry
Cvs cyclic voltammograms
EDTA ethylenediaminetetraacetic acid Et-acac 3-ethyl-2,4-penthanedione
Gly glycine
GSH glutathione
HAS human serum albumin
hd 3,5-hepthanedione
HEPES 4-(2-hydroxyethyl)-1-piperazineethanesulfonic acid HTPA 2-hydroxyl-terephtalate
IR insulin receptor
Lin linear form of plasmid DNA L-Phe L-phenylalanine
Me-acac 3-methyl-2,4-penthanedione
MOPS 3-(N-morpholino)propanesulfonic acid
Naf naphthalene
MES 2-(N-morpholino)ethanesulfonic acid MPA mercaptopropionic acid
NMR nuclear magnetic resonance Nck open circular form of plasmid DNA
PBS phosphate buffered saline
pDNA plasmid DNA
phen 1,10-phenanthroline
PO4 phosphate buffer
PTP(s) protein tyrosine phosphatase(s) ROS reactive oxygen species
RT room temperature
Sal salicylic acid
Sc supercoiled form of plasmid DNA SDS sodium dodecyl sulfate
SWV square wave voltammetry SWvs square wave voltammograms
Tf transferrin
TPA terephthalic acid
Tris 2-amino-2-hydroxymethyl-propane-1,3-diol Trizma base tris(hydroxymethyl)aminomethane
UV-vis UV-visible V1 monovanadate V2 divanadate V4 tetravanadate V5 pentavanadate V10 decavanadate VC vanadium complex(es)
Contents
Acknowledgements……….………iv Abstract……….………....vi Resumo……….………..viii Abbreviations………..………….………..xiv Contents ……….…….………..xvi List of Tables……….……….…xx List of Figures………...xxii List of Publications………xxxiv List of Communications………....xxxvi I. Introduction ... 1 Objectives ... 1 I.1 General concerns on vanadium chemistry ... 5I.2 Chemical and physical properties ... 5
I.2.1 History, isolation and application ... 5
I.2.2 Occurrence ... 6
I.2.3 Aqueous oxidovanadium chemistry ... 7
I.2.4 Vanadium in biology ... 11
I.3 Vanadium in biological systems ... 12
I.3.1 Absorption ... 12
I.3.2 Vanadium in living organisms and life processes ... 12 I.3.3
Toxicity and hazard ... 20 I.3.5
Medicinal interest ... 21 I.4
Vanadium in diabetes treatment ... 22 I.4.1 Vanadium(IV) acetylacetonate ... 39 I.5 Inorganic nucleases ... 43 I.6 Vanadium nucleases... 45 I.6.1 Other nucleases ... 47 I.6.2
Methodologies for studying inorganic nucleases ... 51 I.6.3
DNA and DNA Cleavage ... 52 I.7
Briefly about DNA ... 52 I.7.1
DNA cleavage ... 55 I.7.2
II. Experimental techniques ... 67
Electrophoresis. Agarose gel electrophoresis (AGE) ... 67 II.1 Theoretical considerations ... 68 II.1.1 UV-vis spectroscopy ... 73 II.2 Theoretical considerations ... 74 II.2.1 UV–vis spectroscopy of VC ... 76 II.2.2 Circular Dichroism ... 78 II.3 Voltammetry ... 81 II.4 Theoretical considerations ... 82 II.4.1 Cyclic voltammetry ... 83 II.4.2
Square wave voltammetry ... 87 II.4.3
Fluorescence spectroscopy... 89 II.5
Nuclear magnetic resonance spectroscopy (NMR) ... 92 II.6
V NMR... 96 II.6.2
III. Experimental Part ... 101
Synthesis ... 101 III.1
Nuclease activity studies ... 104 III.2
DNA preparation ... 104 III.2.1
Agarose gel electrophoresis ... 110 III.3 Circular Dichroism ... 116 III.4 Solution studies ... 117 III.5 UV-vis spectroscopy ... 117 III.5.1 Electroanalytical methods ... 117 III.5.2 Mechanistic studies ... 118 III.6 Fluorescence spectroscopy ... 119 III.6.1 NMR studies ... 119 III.6.2
IV. DNA cleavage activity ... 123
Results ... 123 IV.1
Discussion ... 132 IV.2
Effect of complex concentration ... 132 IV.2.1
Effect of buffer media ... 152 IV.2.2
Effect of excess ligand ... 158 IV.2.3
Effect of time ... 159 IV.2.4
Effect of light ... 161 IV.2.5
Effect of activating agents ... 162 IV.2.6
Effect of radical scavengers and H2O2 ... 171 IV.2.7
Effect of atmosphere (air and nitrogen)... 175 IV.2.8
Variability of gels ... 178 IV.2.10
Circular Dichroism studies ... 181 IV.2.11 V. Solution Studies ... 185 Results ... 185 V.1 Stability studies ... 185 V.1.1 Redox chemistry ... 189 V.1.2 Discussion ... 195 V.2 Stability Studies ... 196 V.2.1 Redox chemistry ... 201 V.2.2
VI. Mechanistic Studies ... 213
Results ... 213 VI.1 Oxidative cleavage ... 213 VI.1.1 Hydrolytic cleavage ... 217 VI.1.2 Discussion ... 225 VI.2 Oxidative Cleavage ... 226 VI.2.1 Hydrolytic cleavage ... 231 VI.2.2 VII. Conclusions ... 237 Further considerations ... 239 VIII. Annex A ... 245 IX. Annex B ... 305 X. References ... 327
List of Tables
Chapter I:
Table I.1. Redox potentials for inorganic vanadium species.E (V) vs. normal hydrogen
electron (NHE) [9]... 10
Table I.2. Milestones in the history of development of vanadium biology and chemistry.
... 11
Table I.3. Development of vanadium and vanadium compounds as anti-diabetic agents,
presented chronologically. ... 23
Chapter II:
Table II.1. Typical ranges of vanadium bands in UV-Vis spectroscopy... 78
Chapter III:
Table III.1. Recommended culture volume for high-copy plasmids (adapted from 501).
... 107
Chapter IV:
Table IV.1. Studies of the nuclease activity of vanadium and copper complexes: effect
of 1 – complex concentration; 2 – incubation time; 3 – excess ligand; 4 – buffer media; 5 – light; 6 – H2O2; 7 – atmosphere (air vs. nitrogen); 8 –activating agents; 9 – radical scavengers; 10 – observation of phantom bands. Gel images are presented in Annex 1 numbered as A1, A2, A3…An. ... 124
Table IV.2. Values of ln (%Sc) corresponding to 0, 5, 10, 25, 50 and 100 µM complex
concentration under phosphate buffer. Sampe with complex concentration „0‟ is the the one with plasmid DNA and no complex added. ... 139
one with plasmid DNA and no complex added. ... 146
Table IV.5. Calculated slopes for ln (%Sc) vs. complex concentration for 20, 21 and 23
and 1 under phosphate buffer. Intervals for 95% confidence are presented. ... 147
Table IV.6. Values of ln (%Sc) corresponding to 0, 5, 10, 25, 50 and 100 µM complex
concentration under phosphate buffer. Sampe with complex concentration „0‟ is the the one with plasmid DNA and no complex added. ... 149
Table IV.7. Calculated slopes for –ln (%Sc) vs. complex concentration for 1-9, and 17-19 under phosphate buffer. Intervals for 95% confidence are presented. ... 149
Chapter V:
Table V.1. Bands in the electronic absorption spectra of 1-5 and 9 identified according
to the typical range. ... 189
Table V.2. Summary of electrochemical data for 1-5 and 9 at 20 µM concentration in
List of Figures
Chapter I:
Figure I.1. The Pourbaix diagram of vanadium, expressing the vanadium speciation as
a function of pH and potential at 25°ºC and an ionic strength of 1 M [16]. ... 8
Figure I.2. Schematic model of absorption, distribution, metabolism and excretion of
vanadium compounds of the general form VOL2 [63]. I.p. - intraperitoneal and i.v. – intravenous. ... 28
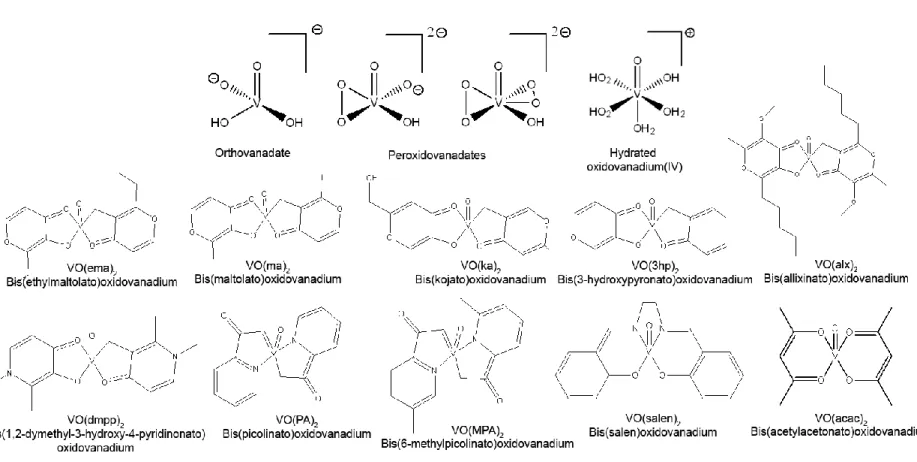
Figure I.3. Examples of potential anti-diabetic complexes. VO(ema)2, VO(ma)2, VO(ka)2, VO(3hp)2 and VO(alx)2 are BEOV derivatives. ... 30
Figure I.4. Examples of vanadium compounds with anti-tumour effect. ... 36 Figure I.5. Square pyramidal geometry of pentacoordinate VO(acac)2. ... 41
Figure I.6. Structure and possible isomers of oxobis(2,4-pentanedionato)vanadium(IV).
The trans (species A) and cis (species B) isomers have the H2O molecule coordinated respectively trans and cis to V=O; and the 1:1 hydrolysis product (species C) may contain two or three coordinated water molecules and have an overall charge of +1 or neutral. Species A is identified to be the major species upon dissolution of VO(acac)2. 42
Figure I.7. Orbital correlation diagram for the transformation of a square pyramid to a
trigonal bipyramid (C4ʋ → C2ʋ → D3h) and an octahedron to a trigonal prism (D3h ← C4v) under idealised local symmetries [9]. ... 43
Figure I.8. Methodologies used to study DNA cleavage activity of inorganic nucleases
(adapted from 247). ... 52
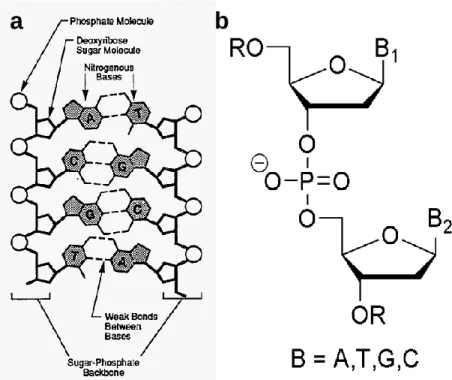
Figure I.9. Schematic DNA structure (a); chemical composition of DNA: deoxyribose
units connected via a phosphate group (b). ... 53
Figure I.10. Cleavage of the plasmid DNA, three form of the DNA molecule. ... 54 Figure I.11. Three different forms of DNA; A-DNA (left), B-DNA (center) and Z-DNA
(right). ... 54
Figure I.12. Reaction mechanism of the DNA hydrolysis by natural enzymes [417]. The
Figure I.13. Proposed mechanism of oxidative cleavage by bleomycin. ... 62 Figure I.14. Type I and II photochemical cleavage of DNA. ... 63
Chapter II:
Figure II.1. Principles of separation. ... 68 Figure II.2. Schematic representation of a beam of light passing (I0) through an absorbing medium, in a quartz cuvette, and being absorbed (I). The intensity of light is represented by thickness of the arrows. ... 74
Figure II.3. The components of typical absorption elements in a spectrophotometer. .. 75 Figure II.4. The orientation of d orbitals towards the faces and edges of a cube. ... 77 Figure II.5. Types of light polarization: linear (electric vector direction constant,
magnitude varies) and circular (electric vector direction varies, magnitude constant) [415]. ... 79
Figure II.6. Schematic representation of CD spectropolarimeter [476]. ... 81 Figure II.7. Potential time excitation signal in a cyclic voltammetric experiment [479]. . 84 Figure II.8. Typical cyclic voltammogram for a reversible O+ne-⇌R redox process [479].
... 84
Figure II.9. Schematic diagram of an electrochemical cell with a three-electrode setup.
... 87
Figure II.10. Square-wave waveform potential sweep [481]. ... 88 Figure II.11. Square-wave voltammograms for reversible electron transfer: (curve A)
forward current; (curve B) reverse current; (curve C) net current. ... 88
Figure II.12. One form of Jabłoński diagram illustrating the absorption and the emission
processes. The singlet ground state, first, and second electronic states are depicted by S0, S1, and S2, respectively. ... 91
Figure II.13. Schematic illustration of a spectrofluorometer. ... 92 Figure II.14. Schematic illustration of the possible alignment of magnetic nucleus in an
range 0.3 < V < 160 mM: decavanadate (for the three vanadium sites, Va, Vb and Vc), monovanadate [V1 = and, below pH ≈ 2, ], divanadate [V2=
], cyclic tetravanadate (c-V4 = ), linear tetravanadate (l-V4 = ) and pentavanadate ( ) [21]. ... 98
Chapter III:
Figure III.1. Example of lane densitometry. Nck (left) and Sc (right) bands of one
reaction mixture represented by a lane. Areas of each band are adjusted manually if necessary. ... 112
Figure III.2. Agarose gel image of the lanes “DNA” – pA1 (plasmid DNA control) and
“Lin” – pA1digested with HindIII. Bands Sc, Nck and Lin correspond to I (supercoiled), II (nicked) and III (linear) forms of DNA. ... 115
Chapter IV:
Figure IV.1. Circular dichroism spectra of pDNA in PBS at the time of reaction mixture
preparation, after 6 and 25 h incubating at 37 °C (A, numbers in the legend present hours) and after addition of 1 (B) at different ratios of metal:bp: 0.3, 0.75 and 1.5; „pA1‟ is pDNA with no complex in PBS. Incubation 25 h at ... 131
Figure IV.2. Agarose gel electrophoresis of the reaction mixtures used at CD
measurements (Figure III.1, B): pDNA in PBS, no complex (D), ri 0.3 (A), ri 0.75 (B), ri 1.5 (C), “DNA” and “Lin” – controls for native and linearized plasmid, respectively. Incubation 25 h at 37 ºC. ... 132
Figure IV.3. Cleavage of pA1 pDNA by 1-5, 9, 11 and 12 at 0 (DNA control), 3, 6, 12,
25, 50 and 100 µM (ri 0.2, 0.4, 0.8, 1.7, 3.3 and 6.7) under phosphate buffer. Percentage calculated from the areas of Sc, Nck and Lin bands vs. complex concentration. Data extracted from the gels in Figures A13-A18, A43 and A113. ... 134
corresponding to ri 0.4, 0.8, 1.67, 3.3, 6.7, 13.3 and 26.67) under phosphate buffer. „C‟ indicates concentration. Data extracted from the gel in Figure A113. ... 135
Figure IV.5. Comparison of the nuclease activity of 1-5, 11 (a) and 12 (b) under PBS
buffer at 50 and 100 µM (ri 3.3 and 6.7). “DNA” is the control for native DNA incubated in the absence of metal Solutions of 50 and 100 µM of 1, 2, 4, 5 were prepared by dilution from 200 µM stock solutions. Due to the scarce solubility of 3, 11 and 12 in water, 1:2 and 1:4 dilutions from a saturated solutions (<<200 µM) were used. Error bars represent Sr. Data extracted from the gel in Figure A11. ... 136
Figure IV.6. The extent of DNA cleavage promoted by 1 and 10 at 3, 6, 12 and 50 µM
under phosphate buffer, presented as the percentage of the Nck, Lin and Sc forms vs. complex concentration. Data extracted from the gel in Figure A6. ... 137
Figure IV.7. Comparison of the nuclease efficiencies of 1 and 2, 4 and 5 at 3, 6, 12, 25,
50 and 100 µM (ri 0.2, 0.4, 0.8, 1.7, 3.3 and 6.7) under phosphate buffer. Complexes-derivatives 3, 6-8 and 10-12 are not included for comparison since they do not dissolve completely in H2O, thus the concentration might be somewhat different from the expected value. ... 138
Figure IV.8. Comparison of the nuclease activity of 1 and 9 under phosphate buffer at
three concentration levels Left: Agarose gel image; samples 1-3 were digested with 1 and samples 4-6 with 9. Right: Percentage of three DNA forms calculated from the areas obtained by densitometry; 1 represents a solid line, while 9 – a dotted one. Data extracted from the gel in Figure A10, lanes 8-13. ... 140
Figure IV.9. Comparison of the nuclease activity of 9 (a) and VIVO(ClO4)2 (b) at 50 µM under MOPS buffer. Data extracted from the gels in Figure A32, lanes 8 and 9. ... 141
Figure IV.10. Comparison of the nuclease activity of 6-8 under phosphate buffer in the
presence of activating agents. The complexes did not dissolve completely in water. Their concentration is 1:4 of the stock solution, which was prepared to be 200 µM. “DNA” and “Lin” are the controls of the Sc (native plasmid DNA) and Lin (50 µM of 1 digested with pA1 pDNA under 10 mM phosphate buffer) forms, respectively. Complex
Figure IV.11. Extent of the DNA cleavage induced by V1 under phosphate (solid line) and MOPS (dashed line) buffers presented as the percentage of the Sc and Nck forms
vs. complex concentration. Data extracted from the gel in Figure A48... 143
Figure IV.12. Cleavage of pA1 pDNA by 20, 21 and 23 at 5, 10, 25, 50 and 100 µM
(ri 0.3, 0.7, 1.7, 3.3 and 6.7) under phosphate buffer. Data extracted from the gels in Figures A65, A70 and A80, respectively. ... 144
Figure IV.13. Comparison of the nuclease activity of 21 and 23 (black and grey lines,
respectively) at 5, 10, 25, 50 and 100 µM (ri 0.3, 0.7, 1.7, 3.3 and 6.7) under phosphate and MOPS buffers. Data extracted from the gels in Figures A69 and A80... 145
Figure IV.14. Comparison of the extent of pDNA cleavage by 20, 21 and 23 and
VO(oda)phen with the one of 1 under phosphate and MOPS buffers, ln (%Sc) vs. complex concentration. ... 146
Figure IV.15. Relation of the nuclease activity of 17-19 and 26 under phosphate buffer
with the metal:bp ratio presented as the percentage of each DNA form vs. complex concentration. The percentage was calculated from the areas measured by densitometry in the gels from Figures A60, A62 and A113. ... 147
Figure IV.16. Efficiencies in DNA degradation promoted by 17-19 compared with those
of 1 and 9 under at 25, 50 and 100 µM (ri 1.7, 3.3 and 6.7) phosphate and HEPES buffers. Data extracted from the gels in Figures A59, A60, A62 and A63. ... 148
Figure IV.17. DNA cleavage activity of 24, 25 and 27 under phosphate buffer related to
the complex concentration. Error bars represent Sr. Data extracted from the gels in Figures A92 and A98. ... 150
Figure IV.18. Cleavage of pA1 pDNA by 15 and 16 at 3, 6, 12, 25, 50 and 100 µM
(ri 0.2, 0.4, 0.8, 1.7, 3.3 and 6.7) under phosphate buffer presented as percentage of the Sc, Nck and Lin forms vs. complex concentration. Data extracted from the gels in Figures A51 and A52. ... 151
Figure IV.19. Cleavage of pA1 pDNA by 28-36 at 50 µM (ri 3.3) under phosphate buffer.
All complexes were dissolved in 5% EtOH. Error bars represent Sr. Data extracted from the gels in Figures A101 and A110. ... 152
corresponding complexes. Complex concentration for 1, 2, 4, 5 was 50 µM (ri 3.3), prepared from stock solutions of 100 µM; 3 was diluted 1:2 from a saturated solution at room temperature. Right: Percentage calculated by densitometry. Error bars represent Sr. ... 154
Figure IV.21. Comparison of the extent of pDNA cleavage by 1 under phosphate,
MOPS, HEPES and TRIS buffers, expressed as ln (%Sc) vs. complex concentration. There is no Sc at 100 µM under phosphate buffer as pDNA was linearized completely. ... 155
Figure IV.22. Comparison of the extent of pDNA cleavage by 9 under phosphate,
MOPS, HEPES and TRIS buffers, expressed as ln (%Sc) vs. complex concentration. Data extracted from the gels in Figures A44 and A45. ... 155
Figure IV.23. Effect of mixtures incubation with DNA buffered with mixtures of MOPS
and phosphate buffer on the DNA cleavage activity of 1 (50 µM). Left: Agarose gel electrophoresis image. “Lin” and “DNA” are the controls for linearized and native DNA. Right: Results obtained from densitometry measurements. Error bars represent Sr. .. 156
Figure IV.24. Relation of the nuclease activity of 1 and the time of its digestion with
pDNA. Complex concentrations are 3 (left) and 25 mM (right) under phosphate buffer. Data extracted from the gels in Figures A21 and A22, respectively. ... 160
Figure IV.25. Effect of incubation time on the nuclease activity of 1 (25 µM, ri 1.67)
under phosphate buffer expressed as the percentage of Sc, Nck and Lin DNA forms vs. time. Data extracted from the gel in Figure A23. ... 161
Figure IV.26. Nuclease activity of 1 at 3, 6, 12, 25, 50 and 100 µM (ri 0.2, 0.4, 0.8, 1.67,
3.3 and 6.7, respectively) under phosphate buffer. Left: samples were incubated wrapped in aluminium foil to ensure the protection from light. Right: samples were incubated under a 370 nm UV lamp. Data extracted from the gels in Figures A38 and A39. ... 162
Figure IV.27. DNA cleavage activity of monovanadate at 25, 50 and 100 µM in the
presence of activating agents under phosphate and MOPS buffers. Data extracted from the gels in Figure A49 and A50. The columns “DNA” compare two samples of DNA
represent phosphate (black) and MOPS (grey). As reactions mixtures for the Lin controls are always prepared with phosphate buffer, both columns “Lin” are shown in black. ... 165
Figure IV.28. Percentage of the Sc, Nck and Lin forms of pDNA after incubating 9 with
oxone and MPA under phosphate and MOPS buffers. Data extracted from the gels in Figure A98 (lanes 12-14) and A99 (lanes 7-9). ... 167
Figure IV.29. Effect of oxone and MPA on the nuclease activity of of 20, 21 and 23 at
50 µM (ri 3.3) under phosphate and MOPS buffers. Data extracted from the gels in Figures A90 and A91. Error bars represent Sr. ... 167
Figure IV.30. Effect of the reductant on the nuclease activity of 28-32 under PBS.
Example of the complete breakage of pDNA by copper complexes with MPA. The snip of the gel image is from Figure A105... 169
Figure IV.31. Extracted from Figure A54. ... 170 Figure IV.32. Extracted from Figure A56. ... 170 Figure IV.33. Effect of H2O2 on the nuclease activity of 1. (A) Effect of complex concentration with constant peroxide content: (♦) no added H2O2 (■) 1 µM (▲) 10 µM (●) 100 µM H2O2. (B) Effect of H2O2 with constant complex concentration: (▲) 3 µM (■) 6 µM (♦) 12 µM VO(acac)2. ... 173
Figure IV.34. DNA cleavage activity of 21 at 100 µM (ri 6.7), under MOPS and
phosphate buffers in the presence of scavengers. NaN3, NaBz and DMSO are the controls of the scavengers. The data are extracted from Figures A77 and A79, respectively. Error bars represent Sr. ... 174
Figure IV.35. Percentage of the Sc and Nck forms obtained after pDNA cleavage by 20,
21 and 23 at 50 and 100 µM under phosphate and MOPS buffers. Error bars represent Sr. Data extracted from Figure A90. ... 174
Figure IV.36. DNA degradation induced by 9 in phosphate (black lines) and HEPES
buffers (grey lines), increasing the concentration of the complex. Samples were prepared and incubated under air (A) and nitrogen (B). The percentage of the DNA
from Figure A42 and A43. ... 175
Figure IV.37. Change in the percentage of the Sc, Nck and Lin DNA forms (left) and A1,
A2, A3, B1 (phantom bands; right) vs. concentration of 1. Data extracted from Figure A110. ... 177
Figure IV.38. Example of a gel contaminated with some external material, small dots
are probably undissolved particles of agarose. ... 179
Figure IV.39. Example of the gel with a poor image resolution. ... 179 Figure IV.40. Example of the gel with distorted bands, low sharpness. ... 179 Figure IV.41. Example of the gel with a poor separation of the bands. ... 180 Figure IV.42. Example of the gel with a poor separation of the Lin and Sc bands. ... 180 Figure IV.43. Example of the gel, where all the samples, including both references of
the pDNA (first and last lanes), contain a Lin band. ... 180
Figure IV.44. Example of the gel in which the percentage of the Sc form differs
significantly in the samples-controls of native pDNA (lanes 1 and 14). ... 181
Figure IV.45. Correlation of the “asymmetry” (Δε (+) + Δε (-)) of the DNA bands with the
degradation of pDNA presented as percentage of the Sc form (A) and as area of the Lin form (B). Data extracted from Figure IV.2. ... 182
Figure IV.46. Effect of the incubation time on the CD intensity of 274 nm (positive band,
A) and 246 nm (negative band, B), with increasing metal:bp ratio. Plasmid DNA at 274 nm(+)/246 nm(-) (solid line), ri 0.3 (dashed), ri 0.75 (dot-dashed), ri 1.5 (dotted)... 182
Chapter V:
Figure V.1. Time evolution of the UV-vis absorbance spectra of aqueous solutions of 1
(2 mM in PBS/1% DMSO; 1.2 mM in HEPES), 2 (1.2 mM) and 3 (1.2 mM in 100% DMSO). Numbers indicate time (h) after dissolution: 0, (a spectrum taken immediately after solution preparation) 2, 4 and 24 h are presented as black, grey, light grey and black dashed lines, respectively. ... 187
dissolution. ... 188
Figure V.3. Effect of the scan rate on the electrochemical response of 1 (20 µM) in
100 mM phosphate buffer. ... 190
Figure V.4. Evolution of Cvs with increasing concentration of 1, 2 (0, 5, 10 and 20 µM)
and 3 in phosphate and MOPS buffers (100 mM). Due to a poor solubility, the exact concentrations of 3 are unknown but lower than the other complexes. ... 191
Figure V.5. Evolution of Cvs with increasing concentration of 4, 5 and 9 aqueous
solutions at 0, 5, 10 and 20 µM in phosphate and MOPS buffers (100 mM). ... 192
Figure V.6. Studies of the electrochemical response and the nuclease activity of 1
under increasing concentration of phosphate buffer: 1, 2, 3, 4, 6, 10, 15 and 20 mM. Left: Direct and revers SWvs. Top right: Cvs of the same solutions. Bottom right: Results of AGE represented as percentage of each DNA vs. buffer concentration extracted from Figure A34. ... 194
Figure V.7. Square wave voltammetry results of the electrochemical behaviour of 1
changing concentration of phosphate buffer: 1, 2, 4, 6, 10, and 15 mM with increased ionic strength controlled by KClO4. ... 195
Figure V.8. Comparison of the absorption spectra of freshly dissolved 1 and 2 in
phosphate and HEPES buffers. Spectra have been normalized to the relative maxima at band II (ca. 565 nm). ... 198
Figure V.9. Comparison of the electronic absorption spectra of 1 and 2 under PBS and
HEPES buffers along time (0, 2, 4 and 24 h). The spectra are normalized to the relative maxima at band I (ca. 820 and 840 nm for 1 for 2, correspondingly). ... 198
Figure V.10. 51V NMR spectrum of 1 (2 mM) under 10 mM of PBS. ... 199
Figure V.11. 51V NMR spectrum of saturated solutions of 6-8 in 10 mM PBS buffer. . 199
Figure V.12. Comparison the absorption spectra of 1 and 2 in phosphate (left) and
HEPES (right) buffers. Spectra have been normalized to the relative maxima at band I (ca. 820 and 840 nm for 1 for 2, respectively). ... 200
Figure V.13. Electronic spectra of 1-5 and 9 at the time of mixing in PBS, normalized to
the subsequent ones are similar to the direct scans. ... 204
Figure V.15. Comparison of Cvs of 4 and 6 at 20 µM in 100 mM phosphate buffer. .. 205 Figure V.16. Cvs of 1 at 20 µM in 10, 30 and 100 mM phosphate (left) and MOPS
(right) buffers. ... 206
Figure V.17. Electrochemical behaviour of 1 and 4 at 0, 5, 10 and 20 µM in 10 mM
phosphate (left) and MOPS (right) buffers. ... 207
Figure V.18. Comparison of the Cvs of 1 and 4 at 20 µM in 10 mM phosphate (left) and
MOPS (right) buffers. ... 207
Figure V.19. Change in DNA degradation by 1 at 50 µM with increasing concentration
of phosphate buffer (1, 3, 6, 10 and 15 mM). The right graphic is the replicate with three more concentrations, i.e., 2, 4 and 20 mM. Percentage of Sc, Nck and Lin forms is calculated from Figure A32 and A33. ... 209
Figure V.20. Changes in redox behaviour of 1 at 20 µM in MOPS buffer (left) with
addition of phosphate and in vice versa. Numbers indicate concentration (mM). ... 210
Chapter VI:
Figure VI.1. Fluorescence spectra of HTPA resulted from the reaction mixture of TPA
(200 μM) and 1 (50 μM) under phosphate and MOPS buffers (5 mM) at the time of mixing, after 1, 3, 5 and 25 h. Excitation spectra (a) were scanned at emission of 435 nm, and emission spectra (b) - at 323 nm of excitation. ... 214
Figure VI.2. Fluorescence spectra of the reaction mixture of TPA (200 μM), 1 (50 μM)
and excess of H2O2 under phosphate and MOPS buffers (5 mM) at the time of mixing, after 1, 3, 5 and 25 h. ... 215
Figure VI.3. Fluorescence intensity vs. time. Reaction mixtures containing 200 µM TPA
prepared in phosphate (black lines) or MOPS (grey) buffers with 1, 4 and 9 (50 µM). Measurements were taken at the time of mixing, after 1, 3, 5 and 25 h. ... 216
Figure VI.4. Change in the fluorescence intensity of the reaction mixtures with time (0,
10/10, 10/5. The inset is the same graph with increased X and Y scales. ... 217
Figure VI.5. 1H NMR spectrum of NPP hydrolysis in the presence of 1 under PBS buffer. Peak at 4.79 ppm is the reference peak of DSS. ... 218
Figure VI.6. 1H NMR spectra of 1 in D2O along time. Numbers indicate hours after dissolution. ... 218
Figure VI.7. 1H NMR spectra of NPP and BNPP under PBS and MOPS buffers (control samples) measured at different times (numbers indicate hours). ... 220
Figure VI.8. 1H NMR spectra of the reaction of NPP (a) and BNPP (b) with 1 (d) measured at different times (numbers indicate hours) under PBS and MOPS buffers. NP (c) is the main product of the hydrolysis; „e‟ is acac ligand. ... 222
Figure VI.9. 1H NMR spectra of the reaction of BNPP (b) with 1 measured at different times (numbers indicate hours) under PBS buffer. Zoomed version of the spectra shown in Figure VI.8. ... 223
Figure VI.10. 1H NMR spectra of the reaction of NPP (a) and BNPP (b) with 1 measured at different times (numbers indicate hours) under MOPS buffer. Zoomed version of the spectra shown in Figure VI.8. ... 224
Figure VI.11. 51V NMR spectra of the same solutions presented in Figure VI.7 and Figure VI.8 for the reaction of NPP and BNPP in solution of 1 under PBS and MOPS buffers. ... 225
Figure VI.12. Fluorescence spectra for (a) excitation and (b) emission of HTPA formed
in the reaction of TPA and 1 in freshly prepared reaction mixture and after 25 h, at neutral pH under phosphate or MOPS. ... 227
Figure VI.13. Fluorescence spectra of TPA (200 μM) in phosphate and MOPS buffers
(5 mM) in the presence of 1 (50 μM) and excess of H2O2. Excitation spectra (a) were scanned at emission of 435 nm, and emission spectra (b) - at 323 nm of excitation. . 228
Figure VI.14. 1H NMR spectra of BNPP in MOPS in the absence (1) and presence (2) of 1, incubated at 50 ºC for 168 h. On the left side are the aromatic resonance peaks of BNPP, NPP and NP, while the right side are the chemical shifts of MOPS buffer. ... 232
List of Publications
Present work has originated the following publications:
PAPERS IN INTERNATIONAL SCIENTIFIC PERIODICALS WITH REFEREES:
1) "The effect of phosphate on the nuclease activity of vanadium compounds", N. Butenko, J.P. Pinheiro, A.I. Tomaz, I. Correia, V. Ribeiro, J. Costa Pessoa, I. Cavaco. Manuscript under preparation;
2) "Vanadium and copper Schiff base complexes: evaluation of the interaction with HSA and DNA and its cytoxicity", S. Roy, S. Borovic, I. Correia, A.I. Tomaz, N. Butenko, I. Cavaco, R.F.M. Almeida, S. Mehtab, M.H.V. Garcia, F. Marques, V. Moreno, J. Costa Pessoa. Manuscript under preparation;
3) "Vanadium and cancer treatment: antitumoral mechanisms of three oxidovanadium(IV) complexes on a human osteosarcoma cell line", I. León, N. Butenko, A. Di Virgilio, C. Muglia, E. Baran, I. Cavaco, S. Etcheverry. Accepted for publication in Journal of Inorganic Biochemistry, DOI 10.1016/j/jinorgbio.2013.10.009;
4) "Application of VIVO(acac)2 type complexes in the desulfurization of fuels with ionic
liquids", A. Mota, N. Butenko, J.P. Hallett, I. Correia. Catalysis Today 2012, 196, 119-125;
5) "Plasmid DNA cleavage and cytotoxicity of VO(oda)phen complex on normal and tumour lines in culture”, I.E. León, N. Butenko, E. Baran, I. Cavaco, S.B. Etcheverry. Biocell 2011, 35 (Suppl – CB-P46): S70;
6) "Antioxidant, DNA cleavage, and cellular effects of silibinin and a new oxidovanadium(IV)/silibinin complex”, L.G. Naso, E.G. Ferrer, N. Butenko, I. Cavaco, L. Lezama, T. Rojo, S.B. Etcheverry, P.A.M. Williams. J. Biol. Inorg. Chem. 2011, 16, 653– 668;
Rivadeneira, C.I. Muglia, M.A. Reigosa, N. Butenko, I. Cavaco, S.B. Etcheverry.
BioMetals 2011, 24, 1153–1168;
8) "DNA Cleavage Activity of VIVO(acac)2 and Derivatives", N. Butenko, A.I. Tomaz, O.
Nouri, E. Escribano, V. Moreno, S. Gama, V. Ribeiro, J.P. Telo, J. Costa Pessoa, I. Cavaco. J. Inorg. Biochem. 2009, 103, 622-632.
PAPERS IN CONFERENCE PROCEEDINGS:
1) "Nuclease Activity Of VIVO(acac)2derivatives", I. Cavaco, N. Butenko, A.I. Tomaz, J.P.
Pinheiro, V. Ribeiro, J. Costa Pessoa, Book of abstracts, FIGIPAS10th 2009 (PO 33);
2) "Cytotoxicity and oxidative stress induced by a complex of Cu (II)-valsartan in osteoblast cell lines", A.L Di Virgilio, P.A.M. Williams, M.A. Reigosa, N. Butenko, I. Cavaco, S.B. Etcheverry. Biocell 34 (Suppl.) 2010 (CB-P11);
3) "Studies on the Mechanism of Action of an Efficient Vanadium Inorganic Nuclease, VIVO(acac)2" I. Cavaco, N. Butenko, A.I. Tomaz, V. Ribeiro, J. Costa Pessoa. J. Biol.
List of Communications
Present work was presented on the following scientific meetings:
ORAL COMMUNICATIONS:1) "Nuclease Activity Of VIVO(acac)2 and its derivatives", N. Butenko, A. I. Tomaz, J.P.
Pinheiro, J. Costa Pessoa, I. Cavaco, Workshop on Metal Containing Drugs, Meeting of the Inorganic Chemistry Committee of the Szeged Branch of HAS, 30-31st August 2011, Szeged, Hungary (Speaker: I. Cavaco);
2) “DNA Cleavage activity of VIVO(acac)
2 and derivatives”, N. Butenko, A.I. Tomaz, O. Nouri, E.
Escribano, V. Moreno, S. Gama, V. Ribeiro, J.P. Telo, J. Costa Pessoa, I. Cavaco, 6th
International Symposium on the Chemistry and Biochemistry of Vanadium, 17-19th July 2008, Lisbon, Portugal (Speaker: I. Cavaco).
POSTER COMMUNICATIONS:
1) N. Butenko, J.P. Pinheiro, A.I. Tomaz, I. Correia, V. Ribeiro, J. Costa Pessoa, I. Cavaco "The Effect of Phosphate on the Nuclease activity of Vanadium Compounds", 11th European Biological Inorganic Chemistry Conference (EUROBIC11) 12-16th of September 2012, Granada, Spain (Poster presentation: N. Butenko);
2) N. Butenko, I. Correia, J. Costa Pessoa, I. Cavaco "Studies of hydrolytic DNA cleavage activity of VIVO(acac)2", International Symposium on Metal Complexes 2012 (ISMEC2012), also
the XXIII Italian-Spanish Congress on Thermodynamics of Metal Complexes, 18-22nd of June 2012, Lisbon, Portugal (Poster presentation: N. Butenko);
3) I. E. León, N. Butenko, E.J. Baran, I. Cavaco, S.B. Etcheverry "Cytotoxicity and plasmid DNA cleavage of three vanadyl(IV) complexes containing the oxodiacetate ligand on a human osteosarcoma cell line in culture", International Symposium on Metal Complexes 2012
(ISMEC2012), also the XXIII Italian-Spanish Congress on Thermodynamics of Metal
base complexes: evaluation of the interaction with HSA and DNA and its cytoxicity",
International Symposium on Metal Complexes 2012 (ISMEC2012), also the XXIII
Italian-Spanish Congress on Thermodynamics of Metal Complexes, 18-22nd of June 2012, Lisbon, Portugal (Poster presentation: I. Correia);
5) I. E. León, N. Butenko, E. Baran, I. Cavaco, S. B. Etcheverry “Plasmid DNA cleavage and cytotoxicity of VO(oda)phen complex on normal and tumour lines in culture”, 47th
Annual Meeting Argentine Society for Biochemistry and Molecular Biology, 30th of October–2nd
November 2011, San Luis, República Argentina (Poster presentation: I.E. León);
6) N. Butenko, A. I. Tomaz, J.P. Pinheiro, J. Costa Pessoa, I. Cavaco "DNA cleavage activity of VOIV(acac)2 and derivatives", 4th European Conference on Chemistry for Life Science, 31st
August-3rd September 2011, Budapest, Hungary (Poster presentation: N. Butenko);
7) S. Nigam, N. Butenko, I. Cavaco "Uncertainty in measuring the efficiency of inorganic nucleases", 4th European Conference on Chemistry for Life Science, 31st of August-3rd of September 2011, Budapest, Hungary (Poster presentation: I. Cavaco);
8) P.A.M. Williams, M.A. Reigosa, N. Butenko, I. Cavaco, S.B. Etcheverry “Cytotoxicity and oxidative stress induced by a complex of Cu (II)-valsartan in osteoblast cell lines”, SAIB – 46th Annual Meeting Argentine Society for Biochemistry and Molecular Biology, 30th of November- 3rd of December, 2010; Puerto Madryn, Chubut, Argentina (Poster presentation: Di Virgilio A.L.); 9) N. Butenko, A. I. Tomaz, J. P. Pinheiro, J. Costa Pessoa, I. Cavaco ''Searching for the culprit species in VIVO(acac)2 nuclease activity'', 7th International Symposium on the Chemistry and
Biochemistry of Vanadium, 6-9th October 2010, Toyama, Japan (Poster presentation: I. Cavaco);
10) N. Butenko, A. I. Tomaz, J. P. Pinheiro, J. Costa Pessoa, I. Cavaco “Voltammetric studies of micromolar aqueous solutions of VIVO(acac)2 and derivatives, in relation to their nuclease
activity”, 7th
International Symposium on the Chemistry and Biochemistry of Vanadium, 6-9th
Biochemistry of Vanadium, 6-9th October 2010, Toyama, Japan (Poster presentation: I. Correia); 12) N. Butenko, A. I. Tomaz, V. Ribeiro, J. P. Pinheiro, I. Cavaco, J. Costa Pessoa “DNA cleavage by oxidovanadium(IV) complexes of acac derivatives”, 4th SPB Clinical Biochemistry Workshop, 29th of January 2010, University of Algarve, Faro, Portugal (Poster Presentation: N. Butenko);
13) N. Butenko, A. I. Tomaz, V. Ribeiro, J. P. Pinheiro, I. Cavaco, J. Costa Pessoa " VIVO(acac)2 derivatives as efficient Inorganic Nucleases", 10th International Symposium on
Applied Bioinorganic Chemistry (ISABC10), 25-28th September, 2009 Debrecen, Hungary (Poster Presentation: J. Costa Pessoa);
14) N. Butenko, A. I. Tomaz, V. Ribeiro, J. P. Pinheiro, J. Costa Pessoa, I. Cavaco ''Studies on the Mechanism of Action of an Efficient Vanadium Inorganic Nuclease, VIVO(acac)2'',
International Conference on Biological Inorganic Chemistry (ICBIC 14), 25-30th July, 2009 Nagoya, Japan (Poster Presentation: I. Cavaco);
15) N. Butenko, I. Cavaco, A. I. Tomaz, J. P. Pinheiro, V. Ribeiro, J. Costa Pessoa "Nuclease Activity Of VIVO(acac)2 derivatives", 10th Meeting In Inorganic Chemistry (FIGIPAS), 1-4th July
Objectives
I.1
Current interest in biochemistry of vanadium-containing compounds (VC) falls into four fields: (1) study of its natural occurrence in biological system; (2) insulin-enhancing properties in the treatment of diabetes mellitus [1-4]; (3) potent artificial enzymes in gene manipulation procedures; (4) antitumor effect in cancer therapy [5,6].
When considering the therapeutic applications of VC many questions arise, namely whether and how VC can enter cells. Considering they do, an important question must be addressed: will they interact with DNA and, if so, how harmful (or beneficial, in case of anticancer drugs) will this interaction be? The effects over DNA may be dramatic (resulting in cytotoxicity) or subtle, and may not be detected within the timeframe of traditional clinical trials. A thorough understanding of these possible effects is essential to assure the safety of metallodrugs.
The central aim of this work is to evaluate the nuclease activity of vanadium compounds, and to establish which is/are the active species in the DNA cleavage. Our particular focus are oxidovanadium(IV) complexes containing acetylacetonate ligands, primarily VIVO(acac)2, which have been considered as good candidates for the anti-diabetic drugs. Many diverse studies have been conducted with this family of compounds, however, little is known about its structure and chemistry in an aqueous solution at biologically relevant concentrations capable of cleaving DNA.
The main objective of this work is to understand how VC can cleave DNA, and which are the most active species involved. With this in mind, the work is divided into: (a) the synthesis and characterization of VC, (b) aqueous solution speciation via electrochemical and stability studies, (c) understanding of the role of buffer media and (d) determination of the mechanism of DNA cleavage action.
General concerns on vanadium chemistry
I.2
Chemical and physical properties
I.2.1
Vanadium is a transition metal, member of the first transition series of group 5 (VB), d-block of the periodic table. The atomic number and mass are 23 and 50.9415, respectively, and symbol is V. The ground state electron configuration is [Ar] 3d3 4s2, and the main oxidation states are +2, +3, +4 and +5. Oxovandium(V) is diamagnetic d0, metal can be present in tetrahedral (VO4), pentahedral (VO5) and octahedral (VO6) coordination environment and tends to form polyoxoanions [7]. Oxidovanadium(IV) (d1, paramagnetic) is also stable and mostly present in square pyramidal or pseudo-octahedral coordination as an isolated cation. Other oxidation states such as oxidovanadium(III) (d2, paramagnetic) and oxidovanadium(II) (d3) are less stable and only present under reducing conditions [8,9].
History, isolation and application
I.2.2
Discovered in Mexican lead ore in 1801 by Spanish-Mexican mineralogist A. M. del Rio, vanadium was initially named panchromium, meaning "all colours”. The element was re-named later to erythronium (erytho- means "red") as most of its alkaline salts became red upon heating (forming V2O5) or treating with acids (decavanadates, namely [H4V4O28]4−). Del Rio‟s claim of the new element was rejected in 1805 by French chemist H.V. Collet-Descotils, who erroneously concluded that “the new element” was nothing but impure chromium. The element was re-discovered nearly 30 years later (1830) by Swedish chemist N. G. Sefström, who named it vanadium in honour of the goddess of beauty and fertility, Vanadis (old Norse name for Freya in Scandinavian mythology) [9]. Until 1869, when English chemist H.E. Roscoe obtained for the first time pure (metallic) vanadium by reduction of VCl2 with hydrogen, it was used in the form of V2O5. The first major synthesis of pure vanadium (99.9%) was carried out in 1927 by the Westinghouse Lamp Co by heating a mixture of oxidovanadium(III), Ca and CaCl2 at 760 ºC.
Most of the pure vanadium metal produced these days is obtained by reduction of V2O5 with calcium in a pressure vessel using iodide process (thermolysis of VI3, van Arkel-de Boer process) [9]. The metal is relatively inert toward oxygen, nitrogen, and hydrogen at room temperature. However, when heated in air at different temperatures, it oxidizes to a brownish black trioxide, a blue black tetraoxide, or a reddish orange pentoxide. It reacts with chlorine at fairly low temperatures (180 ºC) forming vanadium tetrachloride; with carbon and nitrogen at high temperatures forming respectively VC and VN. The most common commercially available vanadium compounds are V2O5, VOSO4, NaVO3, Na3VO4, NH4VO3.
Industrially, almost 80% of the annual world production of vanadium (~38 000 tons) is used in ferrovanadium alloy (reduction of the crude vanadium and iron oxides with coal, ~1:1) for fabrication of particularly strong and durable steels as it makes steel shock- rust- and vibration-resistant. For this reason vanadium is considered a strategic metal, since a part of the steel production goes into the weapon manufactory. Vanadium alloys are used in aerospace industry also, e.g. titanium–aluminium–vanadium alloys for aero-engine gas turbines and undercarriages of planes. Vanadium finds use in nuclear applications because of its low fission neutron cross section; as well as in ceramics, electronics, dyes for textiles and leather [7], vanadium redox batteries [10].
Certain vanadium compounds have a specific use in industry. Vanadium sulphate and vanadium tetrachloride, for example, are used as mordants in the dyeing industry. Vanadium silicates are used as catalysts. Vanadium dioxide and vanadium trioxide are employed in metallurgy. However, the most significant compounds in terms of industrial health hazards are vanadium pentoxide and ammonium metavanadate [11].
Occurrence
I.2.3
Vanadium is a trace element, the most abundant in marine environment (after molybdenum), where it exists as monomeric vanadate, vanadate oxoanion, and most commonly, in the form of ion pairs Na+H2VO4 at the average concentration of ca. 0.03 µM. Its amount in the fresh waters is significantly higher than in the ocean [12]. The
cosmic abundance (0.0001%) is similar to that of zinc and copper. In the earth's crust, it is the 18th most abundant element (0.0019% w/w) [13], similar to zinc and nickel (~0.008%). Vanadium is found in about 152 minerals, among which the important sources are vanadinite, carnotite, roscoelite and patronite. In most minerals vanadium is present at II, IV and V oxidation states in the form of oxide and seldom in as metal cation. Shales are especially rich in vanadium, contain 0.012% w/w [9]. Vanadium is also present in phosphate rock, certain iron ores, some crude oils in the form of organic complexes, e.g. V–porphyrin complexes [14]. The major sources of vanadium are titaniferrous magnetite ores from mines in Australia, China, Russia and South Africa (98% world‟s production) [7,15].
Aqueous oxidovanadium chemistry
I.2.4
Water is a constituent essential for the processes of life, participates in all essential reaction in biological system, act as a solvent, reaction medium and reactant. When studying physiological action of transition metals, solution chemistry recognition is of high importance. Understanding the behaviour of metal compound in aqueous environment allows predicting possible redox reactions and forming species in order to assure a successful implementation in vivo.
The aqueous oxidovanadium chemistry is very complex. With a variety of oxidation states, +2 (VII), +3 (VIII), +4 (VIV) and +5 (VV), the metal can undergo hydrolytic, acid-base, condensation and redox reactions. These reactions are highly affected by the pH of a solution (Figure I.1), and the presence of potential ligands, which upon coordination with vanadium, can form stable complexes with different coordination geometries [12]. Depending on the oxidation state, vanadium acidic solutions have different colouring: V2+ (violet), V3+ (green), VIVO2+ (blue) and VVO42
(yellow). Except the last one, all ions exist in the form of cations. Vanadium(II) compounds are reducing agents, whereas those of vanadium(V) are oxidizing. Vanadium(IV) compounds often exist as oxidovanadium derivatives which contain the VO2+ center. Biological relevance is found
for all four oxidation states, i.e., II/III/IV (nitrogenases), III/IV (ascidians), IV (amavadin), IV/V (bacterial respiration), V (haloperoxidases) [9,13].
Figure I.1. The Pourbaix diagram of vanadium, expressing the vanadium speciation as a function of pH and potential at 25°ºC and an ionic strength of 1 M [16].
Due to the rapid oxidation of vanadium(II) and (III) in aqua media, unless prevented by complexation with sufficiently reducing ligands, the studies of aqueous vanadium chemistry are mainly focused on vanadium(IV) and (V). Much is known about the redox properties and reactions of both vanadium(IV) and (V) in organic solvents, however, little knowledge is obtained in aqueous system [12,17]. The chemistry of these two oxidation states, in the forms of oxidovanadium(IV) and (V) (VIVOSO4, vanadate(V), peroxidovanadates(V)), is particularly relevant since these compounds are typically employed in classical treatment of diabetic animals and seldom in humans [13,18]. However, biological studies with vanadium are complicated by the aqueous chemistry of vanadium(IV) and (V), and the facility with which these oxidation states convert in aqua media.
In the physiological pH range, vanadate(V) is readily dissolved in water and is more stable as free vanadate, (~90% [H2VO4]− + 10% [HVO4]2− hereinafter referred to as Vi,

![Figure I.2. Schematic model of absorption, distribution, metabolism and excretion of vanadium compounds of the general form VOL 2 [63]](https://thumb-eu.123doks.com/thumbv2/123dok_br/18725312.919154/72.918.216.708.333.699/figure-schematic-absorption-distribution-metabolism-excretion-vanadium-compounds.webp)

![Figure I.7. Orbital correlation diagram for the transformation of a square pyramid to a trigonal bipyramid (C 4ʋ C 2ʋ D 3h ) and an octahedron to a trigonal prism (D 3h ← C 4v ) under idealised local symmetries [9]](https://thumb-eu.123doks.com/thumbv2/123dok_br/18725312.919154/87.918.295.624.118.462/orbital-correlation-transformation-trigonal-bipyramid-octahedron-idealised-symmetries.webp)


![Figure I.12. Reaction mechanism of the DNA hydrolysis by natural enzymes [416]. The scission is shown via activation of water or hydroxide as nucleophile (left), activation the phosphate group to facilitate nucleophilic attack (centre)](https://thumb-eu.123doks.com/thumbv2/123dok_br/18725312.919154/100.918.113.805.534.747/reaction-mechanism-hydrolysis-activation-nucleophile-activation-facilitate-nucleophilic.webp)

