ÁE RE A DE PSIC O LO G IA SO C IAL E DAS O RG ANIZAÇ Õ E S
DISSERTAÇÃO DE MESTRADO
Human Resources Management Strength: Preliminary measure
Maria da Graça da Silveira Pinto– Nº 983
O RIE NT ADO R: Professor Doutor J orge G omes
Instituto Superior de Psicologia Aplicada
SE MINÁRIO DIRIG IDO PO R: Professor Doutor J orge G omes
Instituto Superior de Psicologia Aplicada
ACKNOWLEDGES
The present work wouldn’t have been accomplished without the precious help and contribution of several people, and this is a way to express my gratitude.
To my guide, tutor, mentor, Professor Jorge Gomes, for the experienced advices, attention and effort I demanded from him, thank you very much.
To all people that answered the questionnaire and provided the data that support this research.
To my co-workers and students at Universidade Lusófona and AidLearn, who helped me to develop research skills, necessary for this study.
To my friends, especially to Márcia Silva and Paula Matos, for incentive me to go on with the dissertation and reading the papers I produced in order to be sure that were understandable.
To my family, my husband João Gonçalves, my daughters Júlia and Laura, my parents António Pinto da Silva e Gracinda Pinto da Silva, and my brother Rui Pinto, for the support, for helping me to reach the participants who answered the questionnaire, and for all the times that I had no time to enjoy their company and they let me alone to work in peace.
CONTENTS
Introduction……… 2
Strategic Human Resources Management……… 3
Organisational Climate………. 4
Organisational Culture……….. 7
Human Resources Management Strength………. 10
Studies on Human Resource Management Strength……… 14
Model……… 16 Methodology………. 18 Participants………... 20 Instruments………... 21 Procedure……….. 23 Results……… 24 Reliability………. 24
Organisational climate scale……….. 24
Organisational culture scale... 25
Human Resources Management Strength scale………. 25
Sensitivity………. 26
Organisational climate scale……….. 27
Organisational culture scale... 27
Human Resources Management Strength scale………. 28
Validity………. 29
Content validity to HRM Strength scale……… 29
Construct validity to HRM Strength scale………. 32
Discussion……… 42
Bibliographical references………... 45
Annexes………... 51
Annex A – SPSS output – frequencies of participants characteristics……… 52
Annex B – Questionnaire………. 55
Annex C - SPSS output – Cronbach’s alpha for Organisational Climate Scale… 63 Annex D - SPSS output – Cronbach’s alpha for Organisational Culture Scale….. 69
Annex E - SPSS output – Cronbach’s alpha for HRM Strength Scale……… 74
Annex F – SPSS output – Normality tests to Organisational Climate Scale……... 93
Annex G – SPSS output – Normality tests to Organisational Culture Scale……... 95
Annex H – SPSS output – Normality tests to HRM Strength Scale……….... 97
Annex I - SPSS output – Factor Analysis to HRM Strength Scale attributes……. 99
Annex J – SPSS output – Factor Analysis to HRM Strength Scale……… 105
Annex K SPSS output – Factor Analysis to HRM Strength Scale with 9 factors………… 108
Annex L SPSS output – Factor Analysis to HRM Strength Scale with 3 factors………… 112
Annex M – SPSS output – Pearson correlation………... 116
Annex N – SPSS output – Descriptives per scale……… 118
TABLE OF TABLES
Table 1 – Dimensions and Cronbach’s Alpha of Climate scale……….. 24
Table 2 – Dimensions and Cronbach’s Alpha of Organisational Culture scale….. 25
Table 3 – Dimensions and Cronbach’s Alpha of HRM Strength scale…………... 26
Table 4 – Kolmogorov-Smirnov test to Climate scale……… 27
Table 5 – Kurtosis and Skewness indices to Climate scale………. 27
Table 6 – Kolmogorov-Smirnov test to Culture scale………. 28
Table 7 – Kurtosis and Skewness indices to Culture scale……….. 28
Table 8 – Kolmogorov-Smirnov test to HRM Strength scale………. 28
Table 9 – Kurtosis and Skewness indices to HRM Strength scale……….. 29
Table 10 – Features and items of Human Resources Management Strength…….. 29
Table 11 – Factor analysis, Varimax method, of HRM Strength attributes……… 33
Table 12 – KMO and Bartlett’s Test to HRM Strength scale………..33
Table 13 – Factor analysis in principal components, initial eigenvalues………. 34
Table 14 – Rotated component matrix, factor analysis in principal components, using Varimax with Kaiser normalization rotation method forced to 9 factors………... 35
Table 15 - Rotated component matrix, factor analysis in principal components, using Varimax with Kaiser normalization rotation method forced to 3 factors………... 37
Table 16 – Pearson correlations between HRM Strength attributes and total scale, and dimensions of climate scale……… 39
Table 17 – Pearson correlations between HRM Strength attributes and total scales, and dimensions of organisational culture scale………. 39
Table 18 – Means per group of climate, culture and HRM Strength scales……… 40
TABLE OF FIGURES
Figure 1 - Quadrants and cultures, according to Competing Values Model……... 9 Figure 2 – Overall research model………... 16 Figure 3 – Scree plot of HRM Strength scale……….. 34
ABSTRACT
The main goal of this study is to develop and test operational measures of HRM strength. This is a concept presented by Bowen and Ostroff in 2004. The proposed scale included 6 items per each of the nine attributes suggested by theoretical model. This scale was applied, along with a Organisational Climate scale (Brown & Leigh, 1996) and a Organisational Culture scale (adapted from Desphandé, Farley & Webster, 1993), to 117 employees from different organisations, one public and two private ones, all at the same time. The results are analysed related to the psychometric characteristics of the tests used. The HRM Strength scale presented good sensitivity and reliability, but validity results were weak: the factor analysis showed no relation with theoretical model, although the correlation with organisational climate and organisational culture scales was positive and significant. The present HRM Strength scale is not a valid measure of this construct as presented by theoretical model, but this study adds useful information on this regard.
Human Resources Management Strength
INTRODUCTION
Human Resources Management (HRM) strength is a concept proposed by Bowen and Ostroff in 2004, who were interested on explaining how HRM is linked to individual and organisational results. This problem of linking HRM and results is at the core of the strategic HRM literature, and Bowen and Ostroff came up with the idea that HRM can help people develop convergent or divergent views (called strong or weak situations, respectively) of the company, depending on how strong is the HRM system, and that it is this consensual or disperse views which affect behaviour, and consequently results.
The present work will address the HRM strength concept in detailed, how important is this concept to Organizational Behaviour research and practice, and to propose a meaningful way to measure this process.
We will start to present an overview of strategic HRM research and publications. In this section we will discuss the main approaches to HRM studies and theories, main elements of HRM, the role of HRM in the organisation, and the link between HRM and organisation results such as productivity and clients’ satisfaction. We will show that using the strategic approach to HRM we can establish a relation between organisational goals, HRM strategy and organisational success.
There is a section dedicated to organisational climate. In here we will present some studies referring the influence that climate can have on the behaviour of workers, the possibility of different climates within an organisation, and how we can define a strong or weak climate. In close relation with this subject, we will make a link between climate and situation, which characteristics are present at a strong situation and which
mechanism can be responsible for influencing the workers behaviour when we identify a strong situation. The basis to this link is Kelley’s Attribution Theory (1967) and also Mischel theory of personality (Mischel & Shoda, 1995; Mischel, 2004), in order to better understand the former influence.
The organisational situation is also linked to the organisational culture. Some authors consider that it is the organisational culture that is the basis for processing or creation of the organisational climate. In this section we will present in detail the Competing Values Model (Quinn & Cameron, 1998).
Then, we will present the concept of HRM strength, as presented by Bowen and Ostroff (2004). In this section it will be clear the link between a strong HRM and organisational results, what are the characteristics of HRM strength and possible ways to measure this phenomenon.
The main goal of this study is to develop and test operational measures of HRM strength. Therefore, the subsequent sections will include description of how the HRM Strength measure was built and applied, the results obtained, discussion and conclusions of this study.
Strategic Human Resources Management
There are some empirical evidence stating that HRM system is a key component in helping an organisation to be more competitive by becoming more effective (Becker & Huselid, 1998). Usually there are two main perspectives used by researchers when studying the relationship between HRM and firm performance: system approach and strategic perspective. The system approach produced more studies, and considers the overall configuration or aggregation of HRM practices (Ferris, Arthur, Berkson, Kaplan, Harrell-Cook & Frink, 1998). The strategic approach states that organisations
must align all HRM practices, at horizontal level, aiming their strategic goals, and all HRM practices should complement each other to achieve the firm’s business strategy (Schuler & Jackson, 1987a, b; Wright & Snell, 1991; Wright, McMahan, & McWilliams, 1994; cit. in Bowen & Ostroff, 2004). Within this approach there is a research area interested in determining how the overall HRM practices are associated with firm performance and competitive advantage (Ferris et al., 1998). According to Boxall (1996, cit. in Bowen & Ostroff, 2004), HRM practices are so socially complex and intricately linked that it is very difficult if competitors want to copy them.
Although the research under these two perspectives have been helping to determine how HRM practices and their influence on employee attributes can lead main goals at firm level, namely productivity, financial performance or competitive advantage, the process through which this occurs is still unknown. Bowen and Ostroff (2004), based also on the notions of climate and strength of situation, propose the concept of HRM Strength.
Organisational Climate
Based on the contingency perspective of strategic human resources management (Schuler & Jackson, cit in Bowen & Ostroff, 2004), we can state that different business strategies lead to different sets of HRM strategies. This means that a business with a strategy focused on customer service should present HRM practices centred on service, or a business aiming creativity should have its HRM practices focused on enhancing personal innovation.
The HRM research has been historically dominated by the technical subsystem perspective which focuses on task requirements and task accomplishment (Katz & Kahn, cit in Bowen & Ostroff, 2004). According to Schuler and Jackson (Bowen &
Ostroff, 2004), the research indicates that HRM practices lead to employees knowledge, skills and abilities (KSAs), and these individual KSAs influence firm performance at group level. There are also some perspectives, such as social context theory (Ferris et al, 1998), which focus on higher-order socially constructs, that is social structures defined as a gestalt, representing more than the aggregation of the perceptions of the individuals who composes the organisation.
Bowen and Ostroff (2004) are interested in multilevel relationships, and since research publications (Kopelman et al., 1990; Ostroff & Bowen, 2000; cit in Bowen & Ostroff, 2004) indicate that psychological climate (perceptions of individuals) and organisational climate (perception shared at firm level) can be mediators between HRM practices and firm performance, they focused their attention on climate. In order to make sense of their environment, people create an experiential-based perception of what they see and report happening to them, and this is what we call psychological climate (Schneider, 1990, 2000; cit in Bowen & Ostroff, 2004). When we refer to the shared perceptions of employees integrating a formal organisational unit, perceptions of what is important (practices, policies, procedures and routines), which behaviours are expected and rewarded, that shared perception of what the organisation is, we are talking about organisational climate (Schneider, 2000; cit in Bowen & Ostroff, 2004).
According to Kahn (1990, cit. in Brown & Leigh, 1996), we can operationalize the psychological climate as the individual perception of co-workers of their work environment as a safe and meaningful organization. Brown and Leigh (1996) based their model in this climate concept, and were able to build a scale containing 6 dimensions, each of them able to measure the co-workers perception of their organisation as a safe and meaningful environment: the extent to which management is perceived as flexible and supportive, role clarity, freedom of self-expression, the
employee's perceived contribution toward organizational goals, adequacy of recognition received from the organization, and job challenge. A supportive management means that the management provides autonomy and trust that co-workers can find the best way to achieve the results, and doesn’t need to have too many control procedures to their performance; that way it improves motivation and job involvement. Role clarity is related to the safety feeling one develops when knows, in advance, what to expect from their job. Self expression able co-workers to be themselves at work place, and contribute with their own creativity to job performance. Contribution refers to the perception that each co-worker has that his/hers own work contributes to organizational success, which leads to them feeling more involved with their work. Also the recognition of the organisation towards the individual work and effort produces a greater feeling of job involvement. Finally, if their job is challenging they will feel more involved too.
How can climate be a mediator between HRM practices and firm performance? If climate is defined as the perceptions upon organisational practices, procedures and policies (formal and informal), then HRM practices have an important role in determining the climate. The psychological climate, at personal level, can become organisational climate when people from the same unit share their perception among each other and, by doing it, that shared perception becomes only one perception. On the other hand, research (e.g., Borucki & Burke, 1999; Johnson, 1996; Ostroff & Schmitt, 1993; Schneider & Bowen, 1985; cit. in Bowen & Ostroff, 2004) has presented some evidence that organisational climate has an important role in customer satisfaction, customer service quality, financial performance, organisational effectiveness, and total quality management outcomes, which means that organisational climate is related to organisational performance.
Organisational Culture
Organizational climate is a situational characteristic that can influence the members’ perceptions about their organization in terms of autonomy, trust, support, recognition, and also influences the interpretation of the situation, acting as a source of influence to shape the behaviour. The organizational climate is produced by member interaction and reflects the norms, values and attitudes that constitute the organizational culture (Moran & Volkein, 1992). The concept of organisational culture became very popular when was published a Business Week article on corporate cultures, in 1980, followed by the publication of several books on the topic (Allaire & Firsirotu, 1984). The idea that an organisation can have culture characteristics such as values, beliefs, legends, myths, rituals and ceremonies was rapidly accepted, and produced several researches on the subject.
Moran and Volkein (1992) proposed that the organisational culture is responsible for the process of creating the organisational climate. They consider that culture is the foundation of social relations. Organisational culture is processed through the interaction of members, which occurs along the time and allows them to share a view of the organisation. That view is not immediately grasped by an outsider, but once you interact with other members for a period of time, you will take for granted the values, rituals and ceremonies that constitute the organisational culture.
“One of the most accepted definition of organisational culture is presented by Schein:
Organizational culture is the pattern of basic assumptions that a given group has invented, discovered, or developed in learning to cope with its problem of external adaptation and internal integration, and that have worked well enough to be considered
valid, and, therefore, to be taught to new members as the correct way to perceive, think, and feel as related to those problems” (1985, p. 3).
According to Schein (Gomes, Marques & Cunha, 1996), it is important to consider three levels of culture: the artefacts, which is the most visible part of culture and includes verbal artefacts (language, myths, stories), behaviours (like rituals and ceremonies), and physics (decoration, technology, physical environment); values, which are present in the organisational mission and identity, and are used to evaluate people, situations and actions taken; assumptions, which are hypothesis or implicit theories underlying the previous levels, usually unconscious and shared by organisation members.
Organizational culture is considered an attribute of the organisation, and not a metaphor (Quinn &Cameron, 1998).
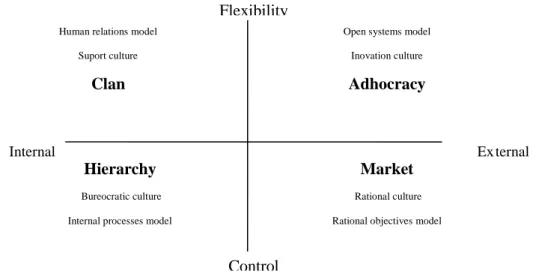
Quinn and Rorbaugh (1981, cit. in Quinn & Cameron, 1998) presented the Competing Values Model in order to define the main aspects to make the organisations efficacies. Underlying this multidimensional model are the individual values about organizational development, in three dimensions: control vs. flexibility, internal focus vs. external focus, means vs. ends. These dimensions are projected in three axis: vertical, conflict between control and flexibility; horizontal, conflict between internal and external orientation; and diagonal (not visible), conflict between the ends and the means. The first two axes create the quadrants representing four types of culture, and each possesses an opposite, but this model assumes that one organization can present the four types, although some values are more dominant than others. The four
Flexibility
Control
Human relations model Suport culture
Clan
Open systems model Inovation culture
Adhocracy
Market
Rational culture
Rational objectives model
Hierarchy
Bureocratic culture
Internal processes model
organisational cultures are Clan, Adhocracy, Hierarchy and Market, as shown in figure 1.
Internal Ex ternal
Figure 1 – Quadrants and cultures, according to Competing Values Model
In the support or Clan culture, members perceive the working place as a familiar and friendly one, where they can share personal issues. The leaders are seen as mentors or parental figures. The organisation keeps the members on loyalty and tradition, and have high commitment. The success is measured by the attention o the clients and people. What is more valued is cohesion, team work, human resources development and high levels of job satisfaction and motivation. The underlined belief is that participation and satisfaction lead to empowerment, becoming efficacy agents.
In Adhocracy, the working place is dynamic and entrepreneurship. The organisation promotes individual initiative, autonomy, and risk taking. The leaders are mainly innovative and daring. The organisation is driven by experimentation and innovation. At long term, they value innovation and resources acquisition. The most valued are new products or services, creative solutions, innovation and growing in new markets. The belief is that innovation leads to new markets, new clients and new opportunities.
In Market culture, the major concern is fulfilling the objectives proposed. People are competitive. The leaders are tough and demanding, leadership is guiding, operational and fighting. The motivation is wanting to win. The major concerns are the reputation and success, and in long run they want to conquer operational aims and targets. Underlining is the fulfilment of the objectives, be better than the competition, to increase is market, and high levels of financial return. To have success they promote competition and high production.
The Hierarchy culture is characteristic in organisations highly structured and formalized, and the procedures guide the people. Leaders are good coordinators and organizers; they value efficiency and job security, predictability, so the organisation can fully work. There are formal rules and politics to keep the workers together. In long run, they promote stability and efficient performance. The most valued is efficiency, predictability and subsistence. The success relies on balanced resources management.
Each organisation presents values that can be in different quadrants, but some are more dominant and therefore influence the organisational culture. The dominant culture will allow the creation of the situation, and organisational climate; and these two constructs have effect on Human Resources Management Strength.
Human Resources Management Strength
In order to understand the relation between HRM and firm performance, we have to “dissect” the HRM system. We can divide it into content and process. The content refers to the policies and practices that HRM performs, in order to achieve the organisational goals and practice the organisational values. The same organisational goal can be achieved through different sets of practices since they can develop a climate to reach the strategic objective (Klein & Sorra, 1996, cit in Bowen & Ostroff, 2004).
The process is the way that HRM system is designed and administrated, that is the definition of an overall HRM system metafeatures, which can create a strong situation by sharing the content meaning.
Both HRM system content and process communicate messages to employees, all the time, and these messages could be perceived differently, personally. So, we can say that a HRM system is strong when those messages are understood the same way by employees, in other words “the strength of the HRM system is a linking mechanism that builds shared, collective perceptions, attitudes, and behaviors among employees” (Bowen & Ostroff, 2004, p. 206).
There are some recent research presenting the notion of strong (or weak) climate (Jackofsky & Slocum, 1988; Payne, 2000; Schneider et al., 2002), based on how employees interpret the situation the same way: low variance among them, we have a strong situation or climate, but if there is high variance then we have a weak situation or climate. A strong climate is a strong situation in a way that allows employees to share the same interpretation of policies, practices and procedures of HRM system, and also to share the knowledge of what behaviours are expected and would be rewarded, in order to achieve the organisational goals.
How can we measure the strength of HRM system? As presented before, HRM practices are, in fact, communication from top to bottom in the organisation; we need to measure how the message communicated is understood the same by the different employees. Using the knowledge from social cognitive psychology and social influence theories, Bowen and Ostroff (2004) propose a set of characteristics referring to the process through which a consistent message can be sent to employees, about HRM content. Only in possession of adequate and unambiguous information can an employee function effectively in a social context and make accurate attributions about a situation.
In order to make confident attributions about cause-effect relationships (Kelley, 1967), the situation should present high degree of distinctiveness (very clearly observable), consistency (displays the same relation over time), and consensus (the different observers interpret the cause-effect relation in the same way). Also, according to Mischel (1977, cit. in Bowen & Ostroff, 2004; Mischel & Shoda, 1995; Mischel, 2004), a strong situation is the one presenting high distinctiveness, consistency and consensus. Therefore, we can have a strong situation when the HRM system is perceived, by all employees, highly distinct, consistent and consensus. We can use these attributes to determine the concept of HRM Strength.
According to Bowen and Ostroff (2004), the concept of HRM Strength comprises three dimensions and nine attributes, which are:
Distinctiveness: when a particular situation stands out in the environment, thereby capturing attention and arousing interest. It has four attributes: visibility, understandability, legitimacy of authority, and relevance.
Consistency: it refers to establishing consistent relationships over time, people and contexts. It is composed of three attributes: instrumentality, validity, and consistent HRM messages.
Consensus: agreement among employees in their view of the cause-effect relationship. It consists of two factors: agreement among principal HRM decision makers, and fairness.
Regarding Distinctiveness, we can state that visibility of HRM consists in the feature of HRM practices being salient and readily observable; the HRM practices should be clear to all workers, and visible in daily activities, allowing workers to perceive the meaning of HRM practices. Understandability refers to the way that different workers categorize the information gathered about each HRM practices; if the
information provided on each HRM practices is visible and clear, the categorization undertook by each worker should be equivalent. Legitimacy of authority is related to the perceived power of HRM in the organisation, namely the prestige of top HR Managers and the influence of HRM in determining the mission and aims of the organisation. About relevance we can state that when a HRM practice contributes to achieve organisational goals and personal goals, that practice is relevant; a situation is considered relevant when perceived in strong connection to obtain an important goal.
The first attribute included in consistency is instrumentality which means that it is clear a cause-effect relation between personal behaviours and rewards, established by HRM practices. When HRM sates that it is important to present a specific behaviour (e.g. be on time) and that specific behaviour is rewarded, we are talking about validity. The messages from HRM must be consistent: they should be compatible with each other and present stability over time. With that in mind, there are three ways to keep HRM messages consistent: the organisational goals set by top managers should be the same goals perceived by workers as organisational goals; all HRM practices should be aligned to obtain the organisational goals, be consistent with each other; and HRM practices should have some stability over time.
Finally, we focus on the third dimension, the consensus. The agreement among principal HRM decision makers is one of the factors in consensus: workers must perceive that HM top decision makers agree with each other, and that the managers agree with them (regarding HRM practices). To obtain consensus in HRM is also important to have fairness, considering the three types of perception of justice: distributive, the way that the rewards / results are distributed among workers; procedural, how the different HRM practices are performed, with the participation of workers; and interactional, the way that HR managers interacts and deals with workers.
These nine attributes can be set as a measure of HRM Strength. Since to obtain a measure of strength we need to know the individuals perceptions, it is the individual perceptions of these attributes that should be collected among the employees of the same organisation.
But if we measure the individual perceptions of employees of the same organisation, it is possible to obtain different interpretations in different departments; in fact there are evidences (Schneider, 1990, cit. in Bowen & Ostroff, 2004) that it is possible, due to the multidimensional nature of climate, to co-exist multiple types of organisational climate within the same organisation. Bowen and Ostroff (2004) acknowledge that, and propose that
“… if the process of the HRM system is strong, a shared perception of the climate will emerge in organizational subunits, albeit with some differences in content or strategic focus across groups. (…) the process of the HRM system can create a strong climate adaptable to change, if the content of the climate includes elements that focus on flexibility and innovation.” (Bowen & Ostroff, 2004, p. 215).
That way, we can obtain different content organisational climates, but a consistent process will emerge in strong HRM system.
Studies on Human Resource Management Strength
One study which already used a measure of HRM strength was performed by Cunha and Cunha (2004), and aimed to research the Impact of strategy, HRM Strength and HRM bundles on innovation performance and organizational performance. Two of their hypotheses were “a strong HRM system will lead to better innovation
performance” and “a strong HRM system will lead to better organizational performance” (Cunha & Cunha, 2004, p.8), which were strongly supported by the results. In this research they used the 1999/2000 survey on strategic HRM, developed by the CRANET-E Network, an international survey containing organizational information on the strategic human resource management of companies in 28 countries, mostly European. They used 17 indicators to assess HRM strength. The first 14 indicators were the transformation in two dummy variables: existence (0 – no; 1 – yes) and formalization (0 – unwritten; 1 – written) of 7 questions regarding if there was a HRM policy on: salary and benefits, recruitment and selection, training and development, communication with employees, equal opportunity/diversity, flexible work practices and management development. The 15th indicator was to determine the existence, or not, of systematic evaluation of HR department’s performance. The 16th indicator is the criteria used for the evaluation of the HR department’s performance and results from the sum of the answers (yes=1 and no=0) of three questions: internal cost efficacy measures, cost benchmarking and performance versus objectives. The 17th indicator concerns the involvement of the HR manager or director in strategic development, on a 0 to three scale, where 0 is not involved, 1 means involvement in implementation only, 2, involvement by consultation and 3 means involvement from the outset. This survey was applied only to the senior HR manager of each organisation, and the final sample used 1822 organisations.
The problem with this measure of HRM strength, regarding the concept proposed by Bowen and Ostroff (2004), is that relies solely on the Visibility on HRM practices, assuming that if a practice exists is more visible when written then when unwritten. Probably, if a HRM practice is written is better understood, has high instrumentality and consistency, but all other features are not measured. Also, for each
organisation they obtained only one measure, which makes it particularly difficult to assess the consensus, fairness and legitimacy of authority.
Model
The 21st century represents a great challenge to both individuals and organisations: we live in Information Society, everybody can access information about everything in no time at all, the technology is progressing exponentially, and the performance must be the best or you will probably perish. How to enhance organisational performance is at core of any organisation which intends to act for several years. Research on this matter has been increasing in last decades, and every factor responsible for better performance is greatly studied. As shown previously, there are studies that lead us to conclude that there is a relation between HRM and organisational performance. This relation can be mediated by the HRM Strength concept: a strong HRM leads to a strong situation which at organisational level can be seen as strong climate and culture; which in turn influence the workers behaviour, namely motivation and performance, leading to enhancing the organisational performance – the goal of any organisation. We can present this in the next schema:
Figure 2 – Overall research model Strength of the
A quantitative measure of HRM strength will allow not only to assess how strong the HRM system within an organisation is, but also to determine what elements should be improved in order to obtain better performance, ending with greater organisational results. That is the main goal of the present study: to conceive a useful and reliable quantitative instrument to assess HRM strength.
METHODOLOGY
This research aims to develop a quantitative measure of HRM Strength, based on the nine attributes proposed by Bowen and Ostroff (2004). This measure takes the form of a questionnaire, applied to several employees of different organisations; from two types of organisations: private and public.
In order to determine if an instrument is adequate to measure a variable, there are some statistic tests to do, namely the reliability and validity.
The reliability of a test is the consistency of the results a person gets when applying the test in different dates; is the extent to which the measurements of a test remain consistent over repeated tests of the same subject under identical conditions (Anastasi & Urbina, 2000). The reliability of a test can be determined by several ways. We can use the test-retest technique, meaning we apply the same test at the same participants group in two different moments, not too much apart so the variable doesn’t change, and correlate the results. The problem with this technique is that we can’t control learning or memory factors.
To overcome those problems we can use another technique which is to apply two alternatives forms of the same test, and correlate them. We can control memory and learning factors, but in this regard we can’t control the items content since these will be different in each form (Anastasi & Urbina, 2000). Or instead of two different forms of the same test we can apply one test and then split-half to correlate, but we continue to not control the items content.
The method most used is to calculate the internal consistency: we can apply one test just one time and calculate the variability proportion of the answers which result from the differences in participants, meaning we determine if all test is measuring the same variable (Pestana & Gageiro, 2005). More specifically, reliability is calculated
based on the correlation between each item and the mean total test. The measures most used to the reliability are the Cronbach alpha, and KR20 by Kuder-Richardson (dichotomy variables), but we can also use the parallel and strictly parallel models, the Guttman inferior limits and the intraclass correlation coefficients (Pestana & Gageiro, 2005). Whatever the method used, the minimum coefficient for the reliability should be 0.80 for any test (Anastasi & Urbina, 2000).
Validity is the degree in which a test measures what it really means to measure, in other words the degree in which fulfils its aim (Anastasi & Urbina, 2000). There is three different ways to assess test validity: construct validity, content validity and criterion validity. Construct validity is a way to measure the scientific usefulness of an instrument, and we can do that in different ways: correlation studies with other test that aims to measure a variable highly correlated to the one that interest us (convergent validity) or that shouldn’t be related to (discriminant validity); factor analysis to identify the function units of the test and correspondent contribution to the total result; components of the variance analysis, focused on the difference between groups in the same test; experimental trials to change the test grade, applied in two different moments. Content validity is a non-statistical kind of validity since it consists in examining systematically the items content to determine that they cover a representative sample of the variable to be measured (Anastasi & Urbina, 2000). Criterion validity involves the correlation of the test with other tests considered good measures of the construct (criterion variable) that we intend to measure; could be concurrent validity if the two measures are collected at same time, or predictive validity when the data collected with the test is prior and predicts the results on the criterion variable measure (Anastasi & Urbina, 2000).
In the present research we studied the reliability through the Cronbach alpha method; the construct validity was determined using factor analysis and the correlation with a Climate scale and Culture scale (convergent validity), the content validity was a major factor influencing the construction of HRM Strength scale items, and the criterion validity was not performed since HR Strength is a new construct with no other measures available.
Participants
In this research participated 117 employees (see Annex A) from different organisations, 63.2% working in a public organisation (Ministry of Finance) and 36.8% in a private one (Communication Technology Development Company and Vocational Training Organisation). The sample was not randomly constituted but was a used the convenience sampling method, using the participants more available (Hill & Hill, 2002) which is a useful method to test a questionnaire first version.
Of the respondents, 58.1% are female and 41.9% are male. Two participants are under age of 20, and one is over 60 years old; most of them vary their age from 31 to 40 years old (47%) and from 41 to 50 years old (23.1%). Regarding the participants’ educational level 66.7% achieved university degree; this is important to understand that 55.6% are superior technicians (need a university degree in order to get that position) and 5.1% are in a management position within the organisation.
The participants’ majority work in the same organisation over than 6 years (35% between 6 and 10 years, 23.1% between 11 and 20 years and 21.4% over than 21 years). Concerning the tenure in the same functional category, the majority is in the same category from 1 to 10 years (27.4% between 1 and 3 years, 20.5% for 4 or 5 years long,
and 25.6% between 6 and 10 years). These are not surprising numbers if we take into account that most respondents work in a public organisation.
Instruments
The questionnaire (Annex B) is divided into four parts: the first one aims to collect demographic data such as gender, age, department, function and organisation tenure; the second part is designed to collect information about the organisational climate, containing 21 items; the next 16 items aim to collect data about organisational culture; and the fourth part measures HRM strength regarding the human resources management practices in the organisation, containing 54 items, 6 items per feature, and was developed by the Portuguese investigators team in this project.
The organisational climate, or psychological climate, is the measure used by Brown and Leigh (1996) in their study to test a model relating psychological climate with performance, mediated by job involvement and effort. The 21 items measures 6 dimensions: supportive management (5 items), role clarity (3 items), contribution (4 items), recognition (3 items), self-expression (4 items) and challenge (2 items).
The third part of the questionnaire aims to measure the organisational culture, according to Quinn theory. It is constituted by 16 items, 4 items to each dimension: clan, adhocracy, hierarchy and market, and each item is answered in a 7 points scale, from 1-totally disagree to 7-totally agree, like the previous scale to measure climate. This scale is adapted from the one used by Desphandé, Farley and Webster (1993).
The Portuguese investigators team built the forth part of questionnaire by creating items based on the description of the HRM strength features presented by Bowen and Ostroff (2004). For Visibility we created items like “The HRM practices in this company are known to everyone working here” and “HRM practices are quite
visible when compared to other organisational practices”. Regarding Understandability, items like “The HRM practices are very clear in this company” and “Trough the guidance set by HRM, I know exactly what, how and when to do” are included. To measure Legitimacy of Authority we designed items such as “I trust the guidance provided by HRM” and “The company’s board of directors thinks that HRM practices are important”. The last feature of Distinctiveness, Relevance, is assessed by “HRM practices contribute to this company achieve its goals” and “The HRM practices contribute to co-workers achieve their personal goals” items, for example. Instrumentality, the first feature included in Consistency metafeature, has items like “Everybody working in this organisation knows that HRM practices lead to positive performance appraisal” and “If I perform according to organisational culture, I know that I will be acknowledged”. Regarding Validity, we created items such as “HRM practices contribute to reinforce adequate behaviours in this organisation” and “Performance appraisal criteria are congruent with what is requested to us in our daily work”. “The HRM practices are consistent along the time” and “The messages communicated by HRM are aligned to the company’s strategy” are examples of items created to measure the Consistency of HRM messages. Examples of items to assess Consensus are, for Agreement among principal HRM decision makers, “The HRM directors shares the same vision than the board of directors of this company” and “There is agreement among the different directors regarding HRM practices”, and for Fairness, “The procedures in my organisation insure that the decisions are agreed without personal favouritism” and “In our organisation we firmly believe that the co-workers rewarded are the ones who deserve it”. All items are answered in a 7 points scale, from 1 – Totally disagree, to 7 – Totally agree.
Procedure
The questionnaire is presented in digital format: excel form, by mail, and return to investigator; or on-line on a website, built with specific software. Either form is presented to the participant by mail, with a small introduction to the study / questionnaire, and requested to answer and to pass the message to co-workers. The questionnaire takes about 10-15 minutes to fulfil.
RESULTS
The results are analysed related to the psychometric characteristics of the tests used, and some exploratory studies concerning type of organisation, gender, organisation and function tenure.
Reliability
To assess the reliability of the tests we calculated the Cronbach’s alpha of each dimension in each scale.
Organisational climate scale (Brown & Leigh, 1996)
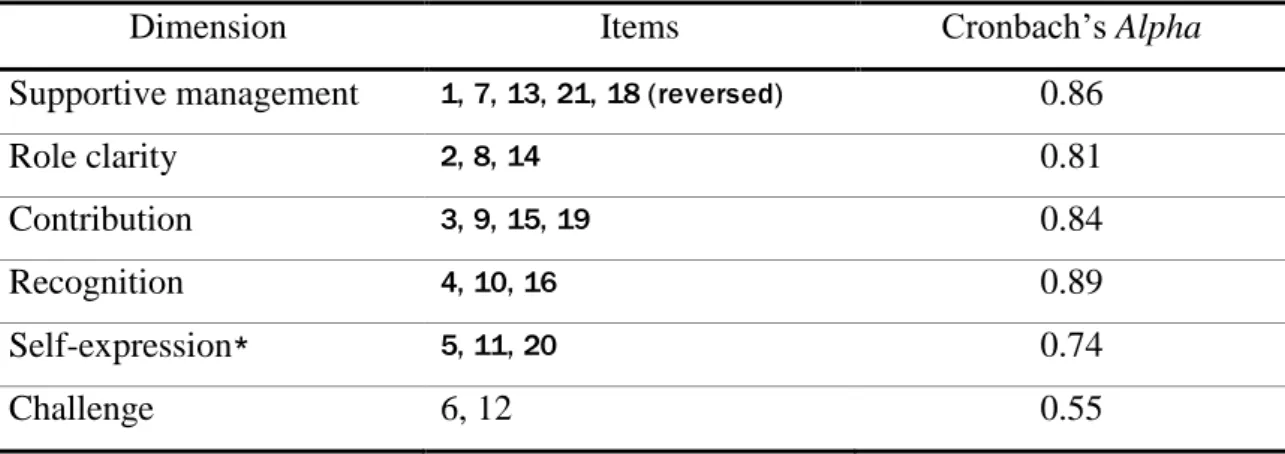
Related to Climate scale, the scale presented six dimensions. The items measuring the same dimension must be categorized in the same direction (Pestana & Gageiro, 2005), so we had to reverse the score of items 17 and 18 before the calculation of the Cronbach’s Alpha. We can consider this scale presented a good / reasonable measure of organisational climate since each Alpha is greater than 0.7 to all dimensions except Challenge. The items included in each climate dimension and correspondent Cronbach’s Alphas are presented in table 1 (see also Annex C).
Table 1 – Dimensions and Cronbach’s Alpha of Climate scale
Dimension Items Cronbach’s Alpha
Supportive management 1, 7, 13, 21, 18 (reversed) 0.86
Role clarity 2, 8, 14 0.81
Contribution 3, 9, 15, 19 0.84
Recognition 4, 10, 16 0.89
Self-expression* 5, 11, 20 0.74
Challenge 6, 12 0.55
Organisational culture scale (Desphandé, Farley & Webster, 1993)
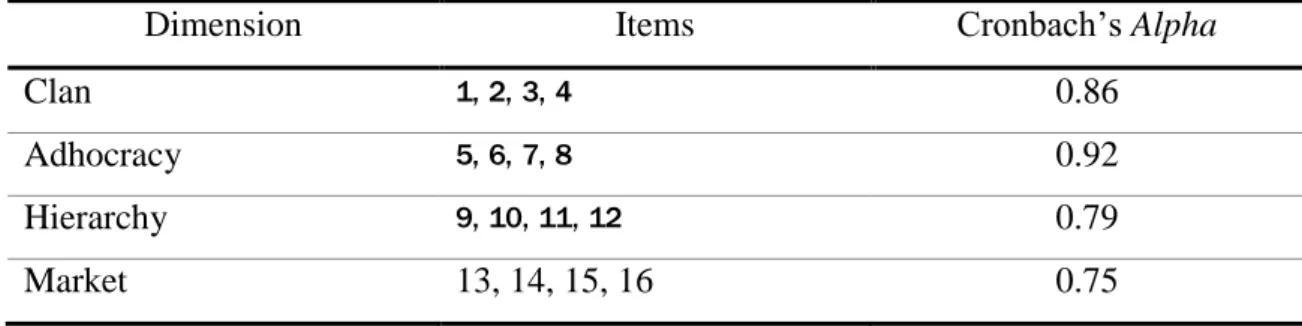
The reliability measures of organisational culture scale are presented in table 2 (see also Annex D). All values of Cronbach’s Alpha are greater than 0.7, which means that all dimensions present good / reasonable reliability.
Table 2 – Dimensions and Cronbach’s Alpha of Organisational Culture scale
Dimension Items Cronbach’s Alpha
Clan 1, 2, 3, 4 0.86
Adhocracy 5, 6, 7, 8 0.92
Hierarchy 9, 10, 11, 12 0.79
Market 13, 14, 15, 16 0.75
Human Resources Management Strength scale
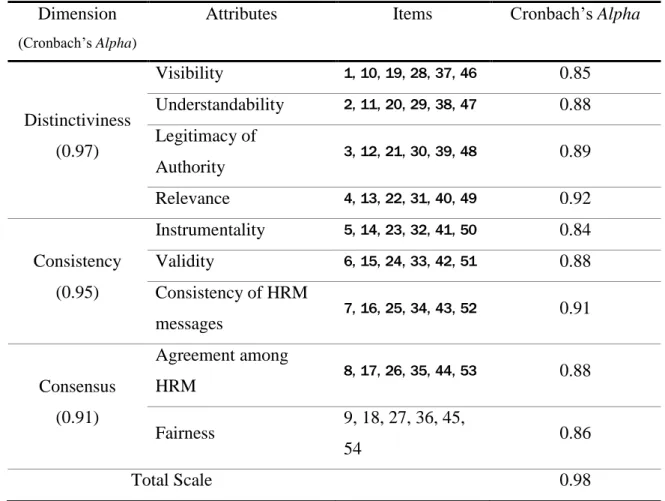
We calculated the Cronbach’s Alpha values for each dimension and attributes of HRM strength, which are all good reliability values, as presented in table 3 (see also Annex E), and since each Cronbach’s Alpha presents a value of at least 0.84. The total scale presents also a very good reliability value (0.98).
Table 3 – Dimensions and Cronbach’s Alpha of HRM Strength scale Dimension
(Cronbach’s Alpha)
Attributes Items Cronbach’s Alpha
Distinctiviness (0.97) Visibility 1, 10, 19, 28, 37, 46 0.85 Understandability 2, 11, 20, 29, 38, 47 0.88 Legitimacy of Authority 3, 12, 21, 30, 39, 48 0.89 Relevance 4, 13, 22, 31, 40, 49 0.92 Consistency (0.95) Instrumentality 5, 14, 23, 32, 41, 50 0.84 Validity 6, 15, 24, 33, 42, 51 0.88 Consistency of HRM messages 7, 16, 25, 34, 43, 52 0.91 Consensus (0.91) Agreement among HRM 8, 17, 26, 35, 44, 53 0.88 Fairness 9, 18, 27, 36, 45, 54 0.86 Total Scale 0.98 Sensitivity
The sensitivity is the capacity of a test to discriminate the subjects in the variable being measured, which means that if a person presents more characteristics of that variable should score more in the test. If a test has a good sensitivity, than we can order the subjects regarding that variable, according to the test results. When the test results are distributed similarly to a Normal distribution, we can say that the test is sensitive.
Organisational climate scale (Brown & Leigh, 1996)
According to the results of the Kolmogorov-Smirnov test (Table 4 and Annex F), we can say that the climate scale results are distributed similarly to a Normal distribution, since p=0.391 which is greater than 0.05.
Table 4 – Kolmogorov-Smirnov test to Climate scale Climate scale Kolmogorov-Smirnov Z 0.902 Asymp. Sig (2-tailed) 0.391
When we calculated the kurtosis and skewness indices, we obtained confirmation that the results from climate scale are close to a Normal distribution, as shown in table 5.
Table 5 – Kurtosis and Skewness indices to Climate scale Climate scale
Skewness -0.524
Kurtosis 0.044
Organisational culture scale (Desphandé, Farley & Webster, 1993)
According to the results of the Kolmogorov-Smirnov test (Table 6 and Annex G), we can say that the culture scale results are distributed similarly to a Normal distribution, since p=0.997 which is greater than 0.05.
Table 6 – Kolmogorov-Smirnov test to Culture scale Culture scale Kolmogorov-Smirnov Z 0.400 Asymp. Sig (2-tailed) 0.997
When we calculated the kurtosis and skewness indices, we obtained confirmation that the results from culture scale are close to a Normal distribution, as shown in table 7.
Table 7 – Kurtosis and Skewness indices to Culture scale Culture scale
Skewness 0.033
Kurtosis -0.402
Human Resources Management Strength scale
The HRM Strength scale results are close to a Normal distribution, according to the results of the Kolmogorov-Smirnov test (Table 8 and Annex H), since p=0.827 which is greater than 0.05.
Table 8 – Kolmogorov-Smirnov test to HRM Strength scale HRM Strength scale Kolmogorov-Smirnov Z 0.626
Asymp. Sig (2-tailed) 0.827
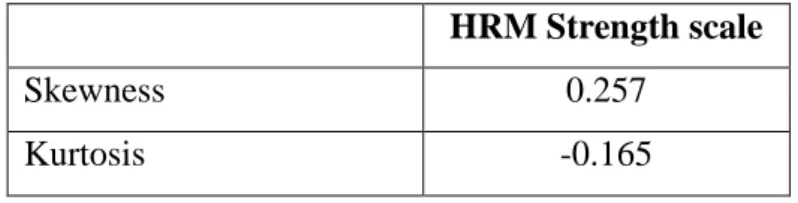
We could confirm these results when we calculated the kurtosis and skewness indices, and obtained data close to a Normal distribution, as shown in table 9.
Table 9 – Kurtosis and Skewness indices to HRM Strength scale HRM Strength scale
Skewness 0.257
Kurtosis -0.165
Validity
This research aims to develop a valid measure to HRM Strength construct so we performed two types of validity to HRM Strength scale: the construct validity was determined using factor analysis and the correlation with a Climate scale and Culture scale (convergent validity), the content validity was a major factor influencing the construction of HRM Strength scale items.
Content validity to HRM Strength scale
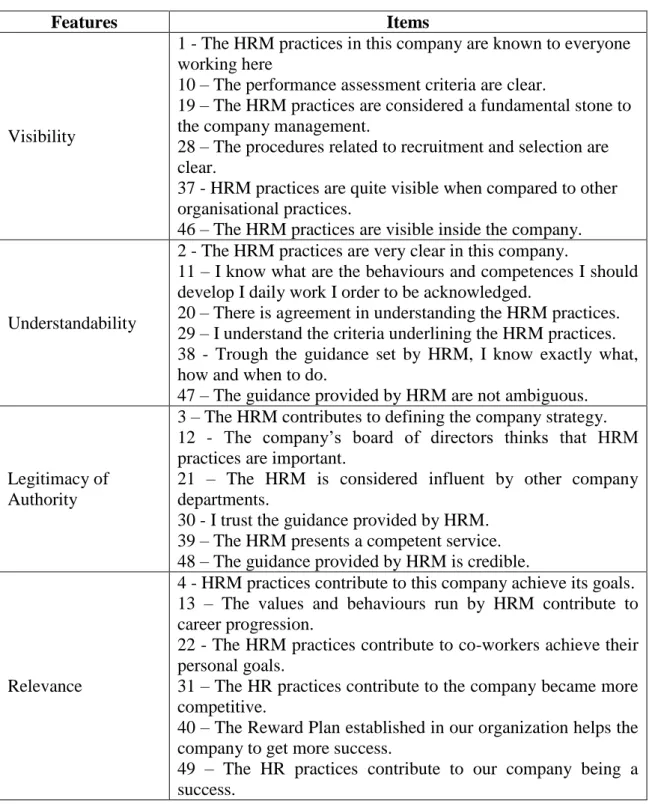
The items of this scale were built based on the description of the HRM Strength features presented by Bowen and Ostroff (2004). For each feature we considered 6 items, trying to establish a representative set to measure the feature and considering the different practices of HRM: recruitment and selection, performance assessment, training and development, values, conduct and organisational behaviour. In table 10 we present the items related to the measuring feature.
Table 10 – Features and items of Human Resources Management Strength
Features Items
Visibility
1 - The HRM practices in this company are known to everyone working here
10 – The performance assessment criteria are clear.
19 – The HRM practices are considered a fundamental stone to the company management.
28 – The procedures related to recruitment and selection are clear.
37 - HRM practices are quite visible when compared to other organisational practices.
46 – The HRM practices are visible inside the company.
Understandability
2 - The HRM practices are very clear in this company.
11 – I know what are the behaviours and competences I should develop I daily work I order to be acknowledged.
20 – There is agreement in understanding the HRM practices. 29 – I understand the criteria underlining the HRM practices. 38 - Trough the guidance set by HRM, I know exactly what, how and when to do.
47 – The guidance provided by HRM are not ambiguous.
Legitimacy of Authority
3 – The HRM contributes to defining the company strategy. 12 - The company’s board of directors thinks that HRM practices are important.
21 – The HRM is considered influent by other company departments.
30 - I trust the guidance provided by HRM. 39 – The HRM presents a competent service. 48 – The guidance provided by HRM is credible.
Relevance
4 - HRM practices contribute to this company achieve its goals. 13 – The values and behaviours run by HRM contribute to career progression.
22 - The HRM practices contribute to co-workers achieve their personal goals.
31 – The HR practices contribute to the company became more competitive.
40 – The Reward Plan established in our organization helps the company to get more success.
49 – The HR practices contribute to our company being a success.
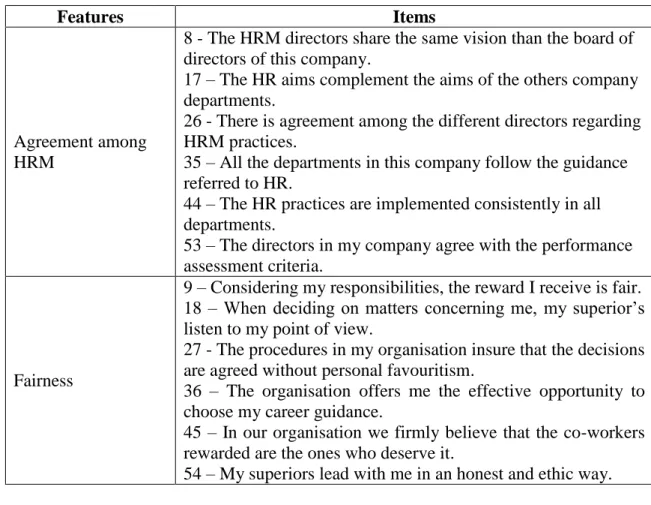
Table 10 – Features and items of Human Resources Management Strength (cont.)
Features Items
Instrumentality
5 - If I perform according to organisational culture, I know that I will be acknowledged.
14 – If I act accordingly to HR practices, I know I will improve my performance.
23 – Considering the annual objectives addressed to me, I know exactly what, how and when to do it.
32 – The salary raises depend on the good results in performance assessment.
41 – Every workers know exactly when and what to do, so they can be rewarded by our organisation.
50 - Everybody working in this organisation knows that HRM practices lead to positive performance appraisal.
Validity
6 - Performance appraisal criteria are congruent with what is requested to us in our daily work.
15 - HRM practices contribute to reinforce adequate behaviours in this organisation.
24 – What they ask me to do daily is congruent with HR guidance.
33 – The HR guidance is translated in valid behaviours to the organisation.
42 – The behaviours recommended by HRM are the ones contributing to the company’s success.
51 – The behaviours we should adopt to be rewarded are the same ones that help the company to have success.
Consistency of HRM messages
7 – The objectives of performance assessment, training and other HR practices are congruent with each other.
16 – The skills that candidates should have in order to be selected are the ones that are rewarded when working in this organisation.
25 - The HRM practices are consistent along the time.
34 – All the HRM activities complement each other in order to achieve the company aims.
43 - The messages communicated by HRM are aligned to the company’s strategy.
52 – The values expressed by HR Director are consistent with the company values.
Table 10 – Features and items of Human Resources Management Strength (cont.)
Features Items
Agreement among HRM
8 - The HRM directors share the same vision than the board of directors of this company.
17 – The HR aims complement the aims of the others company departments.
26 - There is agreement among the different directors regarding HRM practices.
35 – All the departments in this company follow the guidance referred to HR.
44 – The HR practices are implemented consistently in all departments.
53 – The directors in my company agree with the performance assessment criteria.
Fairness
9 – Considering my responsibilities, the reward I receive is fair. 18 – When deciding on matters concerning me, my superior’s listen to my point of view.
27 - The procedures in my organisation insure that the decisions are agreed without personal favouritism.
36 – The organisation offers me the effective opportunity to choose my career guidance.
45 – In our organisation we firmly believe that the co-workers rewarded are the ones who deserve it.
54 – My superiors lead with me in an honest and ethic way.
Construct validity to HRM Strength scale
The factor analysis allow us to determine the variables validity of the factors, using the correlation, and so indicates us if they are measuring the same concept (Pestana & Gageiro, 2005).
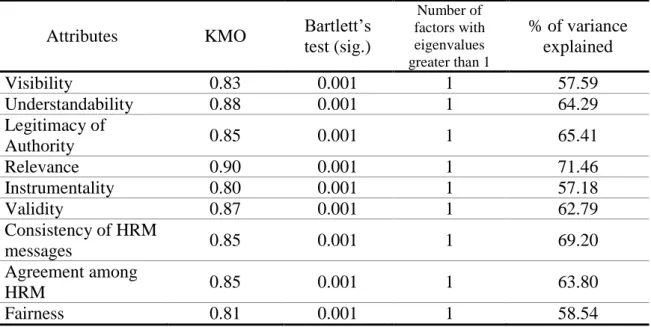
The HRM strength scale was created for this study, so we performed the factor analysis to each attribute just to make sure that each attribute corresponds only to one factor, as can be seen in table 11 (see also Annex I).
Table 11 – Factor analysis, Varimax method, of HRM Strength attributes
Attributes KMO Bartlett’s
test (sig.) Number of factors with eigenvalues greater than 1 % of variance explained Visibility 0.83 0.001 1 57.59 Understandability 0.88 0.001 1 64.29 Legitimacy of Authority 0.85 0.001 1 65.41 Relevance 0.90 0.001 1 71.46 Instrumentality 0.80 0.001 1 57.18 Validity 0.87 0.001 1 62.79 Consistency of HRM messages 0.85 0.001 1 69.20 Agreement among HRM 0.85 0.001 1 63.80 Fairness 0.81 0.001 1 58.54
For each attribute the KMO value was accepted and Bartlett’s test of sphericity was significant, allowing us to continue with this analysis, and each attribute presented only one factor which explained a good percentage of the variance, greater than 55%.
We performed the factor analysis to the entire scale in order to verify if we could obtain the same attributes and / or dimensions suggested by theory. The results from KMO and Bartlett’s test of sphericity (table 12) allowed us to continue with factor analysis.
Table 12 - KMO and Bartlett 's Test to HRM St rength scale
,921 6715,057 1431 ,000 Kaiser-Meyer-Olkin Measure of Sampling
Adequacy. Approx. Chi-Square df Sig. Bartlett's Test of Sphericity
Considering the Kaiser criteria that the eigenvalues should be greater than 1, we obtained 8 factors, explaining 75.455% of the variance, as shown in table 13 (see also Annex J).
Table 13 – Factor analysis in principal components, initial eigenvalues
Component Initial Eigenvalues
Total % of Variance Cumulative %
1 29.757 55.106 55.105 2 2.755 5.101 60.207 3 1.852 3.430 63.637 4 1.763 3.264 66.901 5 1.326 2.455 69.357 6 1.207 2.235 71.592 7 1.074 1.989 73.581 8 1.012 1.874 75.455
But if we consider the scree plot analysis (figure 1), we obtained only 1 factor.
5 4 5 3 5 2 5 1 5 0 4 9 4 8 4 7 4 6 4 5 4 4 4 3 4 2 4 1 4 0 3 9 3 8 3 7 3 6 3 5 3 4 3 3 3 2 3 1 3 0 2 9 2 8 2 7 2 6 2 5 2 4 2 3 2 2 2 1 2 0 1 9 1 8 1 7 1 6 1 5 1 4 1 3 1 2 1 1 1 0 9 8 7 6 5 4 3 2 1 Component Number 30 25 20 15 10 5 0 E ig en va lu e
That way, for the initial component matrix, all and each item had more than 0.5 saturation in the first and only factor. Using the Varimax with Kaiser normalization rotation method we obtained a component matrix with items saturating in the 8 factors, but several with values lower than 0.5 and some factors presented only one item. So we decided to perform a new factor analysis but forcing the 9 factors suggested by theoretical model.
The ninth factor explained 1.666% of the variance, so the total variance explained by 9 factors is 77.120%. The component matrix obtained using Varimax with Kaiser normalization rotation method is presented in table 14.
Table 14 – Rotated component matrix, factor analysis in principal components, using Varimax with Kaiser normalization rotation method forced to 9 factors
Item number Components 1 2 3 4 5 6 7 8 9 48 0.760 30 0.748 39 0.739 52 0.733 44 0.722 33 0.712 50 0.710 42 0.708 28 0.703 26 0.702 29 0.701 34 0.697 25 0.697 35 0.696 47 0.687 49 0.672 38 0.666 46 0.658 20 0.656 43 0.644 27 0.638 24 0.630 40 0.582 22 0.568 37 0.562 45 0.525 9 0.690
Table 14 – Rotated component matrix, factor analysis in principal components, using Varimax with Kaiser normalization rotation method forced to 9 factors (cont.)
Item number Components 1 2 3 4 5 6 7 8 9 5 0.663 4 0.583 14 0.535 6 0.523 7 0.510 23 0.811 11 0.738 18 0.626 8 0.847 53 0.548 17 0.535 12 0.510 32 0.709 41 0.538 1 0.741 2 0.649 21 0.663 15 0.627 31 0.561 51 0.572 54 0.532
We eliminated the items 10, 16, 13, 3, 36 and 19 for presenting saturation inferior to 0.5 in each factor. The first factor includes 26 items, which is more than half of the items considered in this test, items built based on several attributes of HRM Strength and from all dimensions. Almost all factors include items from several attributes and dimensions, with the exception to factors 4 (3 items from Agreement among HRM) and 5 (2 items from Instrumentality). These results are far away to agreeing with the theoretical model presented.
We decided to execute another factor analysis, forcing 3 factors, in order to determine the factors corresponding to the 3 dimensions of HRM Strength (see Annex L). These 3 factors explain 63.637% of cumulative variance. In table 15 we present the items included in each factor and correspondent saturation.
Table 15 - Rotated component matrix, factor analysis in principal components, using Varimax with Kaiser normalization rotation method forced to 3 factors
Item number Component
1 2 3 30 0.779 48 0.768 29 0.765 42 0.749 33 0.743 34 0.740 39 0.735 28 0.735 44 0.730 47 0.726 50 0.725 52 0.707 27 0.700 26 0.698 49 0.697 25 0.696 35 0.696 38 0.695 20 0.676 46 0.640 31 0.627 40 0.617 43 0.616 24 0.611 45 0.607 37 0.605 22 0.593 2 0.584 41 0.560 15 0.534 16 0.507 5 0.778 6 0.721 18 0.688 54 0.679 11 0.669 7 0.633 36 0.632 9 0.628 23 0.593 14 0.572 4 0.566 1 0.548 51 0.538
Table 15 - Rotated component matrix, factor analysis in principal components, using Varimax with Kaiser normalization rotation method forced to 3 factors (cont.)
Item number Component
1 2 3 32 0.536 10 0.527 13 0.504 3 0.504 8 0.799 12 0.672 19 0.661 21 0.643 17 0.615
The item 53 was eliminated since it presented saturation lower than 0.5 in each factor. Again in factor 1 are included more than half (31 items) of the items considered, and in each factor are included several items from at least two different dimensions settled by the HRM Strength theoretical model.
We continued the study of construct validity performing the convergent validity. We did that using the Pearson correlation between HRM Strength test and climate scale, and HRM Strength test and culture scale. The theoretical model establishes a positive relation between HRM Strength and Climate and Culture, that’s why we are using these scales. Since the results obtained with factor analysis, we decided to perform the correlations focusing on the theoretical attributes and on total HRM Strength scale.
In next tables we present the Pearson correlations between the dimensions of climate scale with the attributes and total HRM strength scale (presented in table 16), and between these last ones and the dimensions of organisational culture, presented in table 17.
Table 16 – Pearson correlations between HRM Strength attributes and total scale, and dimensions of climate scale
HRM strength Attributes Climate dimensions Supportive management Role clarity Contribution Recognition Self-expression Challenge Visibility 0.23* 0.39** 0.41** 0.48** 0.41** 0.26** Understandability 0.23* 0.48** 0.47** 0.51** 0.44** 0.28** Legitimacy of Authority 0.20* 0.36** 0.41** 0.48** 0.40** 0.27** Relevance 0.22* 0.38** 0.45** 0.50** 0.39** 0.26** Instrumentality 0.35** 0.50** 0.44** 0.55** 0.43** 0.34** Validity 0.28** 0.39** 0.47** 0.52** 0.40** 0.29** Consistency of HRM messages 0.24** 0.40** 0.40** 0.48** 0.36** 0.23* Agreement among HRM 0.07 0.31** 0.28** 0.31** 0.25** 0.11 Fairness 0.47** 0.56** 0.51** 0.64** 0.55** 0.34** Total HRM Strength scale 0.28** 0.46** 0.46** 0.54** 0.44** 0.29** * Correlation is significant at level 0.05 (2-tailed)
** Correlation is significant at level 0.01 (2-tailed)
Table 17 – Pearson correlations between HRM Strength attributes and total scales, and dimensions of organisational culture scale
HRM strength Attributes
Organisational culture dimensions
Clan Adhocracy Hierarchy Market
Visibility 0.59** 0.63** 0.41** 0.53** Understandability 0.66** 0.68** 0.37** 0.53** Legitimacy of Authority 0.61** 0.69** 0.45** 0.55** Relevance 0.62** 0.71** 0.40** 0.59** Instrumentality 0.65** 0.68** 0.33** 0.54** Validity 0.59** 0.66** 0.42** 0.60** Consistency of HRM messages 0.59** 0.64** 0.45** 0.56** Agreement among HRM 0.49** 0.54** 0.33** 0.41** Fairness 0.64** 0.69** 0.41** 0.59** Total HRM Strength scale 0.65** 0.71** 0.44** 0.59**
* Correlation is significant at level 0.05 (2-tailed) ** Correlation is significant at level 0.01 (2-tailed)
As one can observe, all dimensions of climate and organisational culture present low or moderate correlation, statistical significant, with total scale and with all features of HRM strength except Agreement between HRM managers with Supportive
management (climate scale) and Challenge (climate scale), which are not statistical significant. The correlation between Adhocracy (culture scale) and Relevance and HRM Strength total scale is considered high, and statistical significant at 0.01.
Exploratory studies
By the time we collected data related to Climate, Culture and HRM Strength, we also collected data concerning the type of organisation, gender, age, tenure in organisation and tenure in function, allowing us to perform some exploratory studies, namely comparing means of the referred groups. In order to obtain better results, we decided to transform the age, tenure in the organisation and tenure in function in dichotomy variables using the median to divide each variable into two groups. We analysed these groups by scale applied. Since all variables to compare means are dichotomy, we used the t-Student test, which can be used to samples presenting a Normal distribution of the dependent variables, and with homogenous variances. The Levene’s test for equality of variances is the most used measure to test the variance homogeneity, and since the variances resulted homogenous, we decided to continue and perform the t-Student tests.
In table 18 (see also Annex N) we present the means results of climate scale, culture scale and HRM Strength scale in each group considered.
Table 18 – Means per group of climate, culture and HRM Strength scales
Variable Group N Climate Culture HRM Strength
Organisation type Public 73 4.51 3.53 3.32 Private 43 4.69 3.82 3.57 Gender Feminine 68 4.45 3.58 3.28 Masculine 48 4.75 3.72 3.61 Age <= 40 67 4.56 3.66 3.43 > 40 49 4.59 3.61 3.38 Organisation tenure <= 10 64 4.65 3.74 3.55 > 10 51 4.48 3.51 3.25 Function tenure <= 5 65 4.58 3.58 3.41 > 5 50 4.56 3.70 3.39