Revista Geama, v.2, n.3, jul.-set., 2016. Received: May 24, 2016 | Approved: June 26, 2016.
Revista GEAMA
The Journal of Environment
Artigo científico
Land cover classification and change analysis in Recife-PE
municipality using unsupervised classification
Tiago Henrique de Oliveira
a*, Josiclêda Domiciano Galvíncio
b,
Rejane Magalhães de Mendonça Pimentel
caPrograma de Pós-graduação em Desenvolvimento e Meio Ambiente, Universidade Federal de
Pernambuco, Recife, Brasil. [email protected]
bDepartamento de Ciências Geográficas, Universidade Federal de Pernambuco, Recife, Brasil.
cDepartamento Biologia/Botânica, Universidade Federal Rural de Pernambuco, Recife, Brasil
ABSTRACT
Rapid land use changes and land cover in urban environments have substantial impacts on the relationship between energy and water cycles on the surface. Remote sensing techniques allow the distinction and categorization of objects in the physical and spatial point of view. The objective was to quantify the land use change and land cover in the municipality of Recife-PE by unsupervised classification in multi-temporal images of the satellite Landsat 5. It was used eight images sensor Thematic Mapper (TM), Orbit and point 214/65-66 aboard the Landsat 5 satellite, obtained from National Institute for Space Research (INPE) with dates of passage on May 9, 1987, September 28, 1989, June 14, 1991, 8 September 2005, August 26, 2006, July 28, 2007, September 6, 2010, and September 25, 2011. The images were recorded, orthorectified and underwent deletion of shadow and cloud, and were submitted to radiometric calibration and computation of reflectance. Among the main results can be cited decreased vegetation cover and consolidation of the urban area as well as the preservation of significant plant fragments, like the Matas da Várzea, Curado, Barro, Jardim Uchôa, and Dois Irmãos. It is relevant the maintenance and conservation of the remaining vegetated areas, especially in more densely populated areas of the City of Recife.
Keywords: ISODATA, LANDSAT, population growth.
Introduction
Currently, the studies of land use and land cover have gained considerable prominence in several surveys conducted by the world. Rapid land use changes and land cover in urban environments have substantial impacts on the relationship between energy and water cycles on the surface. Silva et al. (2010) allege [...] " the weather and climate have a great influence on the type and condition of terrestrial vegetation, but at the same
time may be affected because of natural changes and anthropogenic land use."
By using Geographic Information System (GIS), it is possible to perform the interconnection of land use mapping and soil cover with several other products obtained through remote sensing and associates them to the knowledge of the weather and climatic conditions.
Considering the urban environment, Novack (2009) allege that remote sensing techniques allow the distinction and categorization of objects in point of view physical and spatial. However,
Revista Geama, v.2, n.3, jul.-set., 2016. Received: May 24, 2016 | Approved: June 26, 2016.
indirectly, and with a degree of imprecision, enables the collection of information on the social and dynamic practices that occur in the territory and in a way individualize land use.
Pielke et al. (2002) allege that several works have shown that changes in land cover provide an additional amount of force to the climate, by the changes of the physical properties of the Earth's surface. Authors, as Zhao & Jackson (2014) and Bright et al. (2016), observed what changes in surface albedo could be compared, for example, emissions of greenhouse gasses.
However, changes in vegetation cover can directly modify the surface heat flux, requiring new forms of approaches to correct quantification of the impacts of the use and soil cover in climate. Similarly, it is necessary studies analyzing the perspective of the influence that local or regional changes may impact on the global climate system over time.
The significant advances coming from space technology has enabled the availability of satellite products for different scales and resolutions. Thus, various theoretical concepts and methodologies have been developed to study the land use cover [...] "allowing the management of appropriation of global geographical area or site and combining the whole vision of land use and coating soil with the
environmental concern" (Instituto Brasileiro de
Geografia e Estatística, 2006).
Authors such as Chen et al. (2006), Guo et al. (2015), Sun et al. (2016) and Tian et al. (2016) stated, through studies in different cities in the world, the consequences of the lack of urban planning application and disorderly densification process. According to Pauleit et al. (2005), factors such as surface temperature, the flow of rainwater and carbon sequestration are directly affected by land cover characteristics such as density of buildings and distribution of green areas in urban areas, that in most cases must be very fragmented. Nucci (2001) stated, through his surveys, a spatial configuration of plant cover and its adequate quantification that can be used as an instrument and parameters to evaluate the environmental quality in urban areas. Considering Ageda Junior & Amorim (2009), the use of urban land is, probably, the primary defining urban environmental quality. It is necessary, therefore, be adjusted and directed to the forms of occupations. For this, the government has mechanisms such as the use of the municipal director plan, the zoning and the law of land use and occupation.
Studies by Moreira & Galvíncio (2007) and
Oliveira et al. (2010) demonstrate the
environmental changes that have occurred in Boa Viagem, Recife-PE, along 19 years, found a marked decrease in vegetation areas due to the urban expansion and consequently increase in surface
temperature values. They identified the formation of heat islands in various parts of the district in the images used.
Another consequence of rapid urban
densification, cited by Garcia (1999), [...] "is the replacement of natural surface for various types and shapes of buildings, forming a compact and dense set, with the most varied types of coating
and properties physical." Is created a roughness
which promotes changes in air movement at the surface and causes changes in urban radiation gradient influencing the temperature of the air.
Another implication of urban density it is a decreased of infiltration caused by waterproofed areas, especially in periods of high rainfall (Fendrich & Iwasa, 1998). Tucci (2000) state that an inhabitant produces on average an impervious area of 49 m² in a watershed. The 10% increase in impervious area is approximately 100% increase in the flood coefficient and the volume of runoff.
According to Freitas (2005) [...] "often to evaluate retrospectively the urbanization can be necessary observe two processes: the constructive densification and environmental degradation, and often this approach difficult the consideration of other possibilities, such as the vision of the
sustainable compact city with a quality of life.”
This author also states that the urban density, when combined with environmental sustainability, does not have severe consequences for the urban environment. To this end, it mentions that it is necessary to carry out distribution and consolidation of vegetated areas and a larger spacing between buildings, allowing a greater wind permeability in the urban environment. The vegetated areas in an urban environment, in turn, play a major role in the infiltration of rainwater and maintenance of favorable weather conditions.
Consequently, this research aims to quantify the land use change and land cover in the municipality of Recife-PE using unsupervised classification in multitemporal Landsat 5 satellite images.
Materials and Methods
Study area
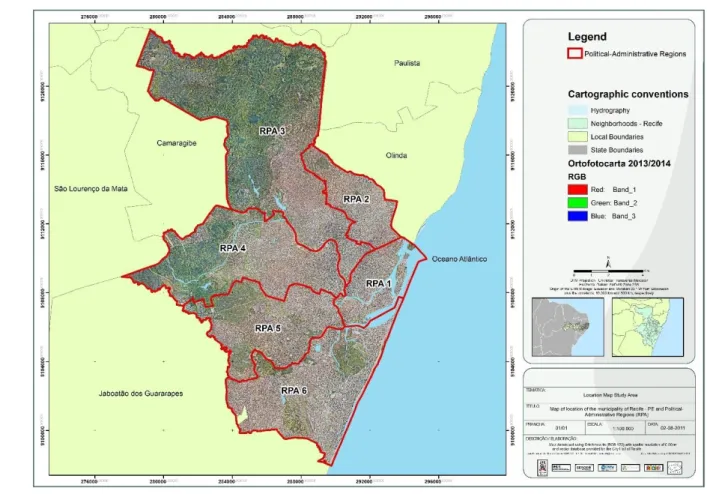
The City of Recife (Figure 1), the capital of Pernambuco State, is located on the northeastern coast and occupies a central position, 800 km from two other regional cities, Salvador and Fortaleza, disputing with them the strategic sphere of influence in the region (PCR, 2012). It has an area of 218.50 km² and a population of 1,537,704 inhabitants, corresponding to 17.48% of the state population, and 41.63% of the Metropolitan Region of Recife (RMR), which provides a demographic
Revista Geama, v.2, n.3, jul.-set., 2016. Received: May 24, 2016 | Approved: June 26, 2016.
Currently, the urban area of the municipality is divided into 94 districts, 18 microregions and six Political-Administrative Regions (RPA), the RPA 2 is the most densely occupied. According to Köppen (1948), the climate of Recife is As' (hot and humid), with high temperatures and winter and autumn rains. The vegetation is composed of remnants of Atlantic Forest.
Radiometric data
Eight images of the Thematic Mapper (TM) sensor of orbit and points 214/65-66 aboard the Landsat 5 satellite, obtained from the Imaging Division (DGI) of the National Institute for Space Research (INPE) were used. The satellite passage dates in the study area occurred on May 9, 1987, September 28, 1989, June 14, 1991, September 8, 2005, August 26, 2006, July 28, 2007, 6 September 2010 and 25 September 2011 (Figure 2).
The criterion of choice used to obtain these images was the lowest cloud cover, which prevents the use of hundreds of images of Recife region. The TM sensor was launched aboard the satellites Landsat 4 and Landsat 5 and has adequate spectral separation for its main purpose, namely to offer subsidies for thematic mapping in natural resources.
This sensor remained active in the satellite Landsat 5 operating with seven spectral bands that encompass the regions of the visible, near infrared, medium and thermal, having finished its operations, in early 2012, due to system failures.
Data from TM sensor were used in research and definitions of methods in broad areas of scientific knowledge and had singular importance for the evolution of the techniques developed and used in the worldwide remote sensing (EMBRAPA, 2009).
Figure 1. Map of the Political-Administrative Regions (RPA) in the City of Recife, Pernambuco State. Source: Oliveira (2012).
The Landsat satellite mode operation enables to acquire satellite imagery of much of the Earth's surface, and it is possible to obtain images from different times which allows the realization of multi-temporal research and the use change monitoring and coverage solo around the world. Preprocessing steps of satellite images Landsat
After downloading the images to be used, all bands of each Landsat scene were stacked and geometrically corrected, based on the image orthorectified provided by Landsat 8. Later was made the exclusion of digital figures the clouds and cloud shadows by performing a supervised classification, given that the area of Recife has a high incidence of clouds, which makes it infeasible
Revista Geama, v.2, n.3, jul.-set., 2016. Received: May 24, 2016 | Approved: June 26, 2016.
the use of dozens of images to over the past 25 years. It avoids the confusion of digital numbers of these targets with the values of other targets observed in Recife, preventing an erroneous interpretation of the results in several indices, such as vegetation index and surface temperature. Thus, after classification, the clouds values and cloud shadow had the same value throughout the image, making it possible to exclude them in each index and remove these values of statistical
analysis and tables to be generated. Analyzing Figure 3 can observe the flowchart of preprocessing of the images.
Through observation of meteorological data available in the PCD Recife (observed from the year 2000 and provided by the Centro de Previsão de Tempo e Estudos Climáticos – CPTEC/INPE), it was verified the occurrence of precipitation in the days preceding the day of imaging of the 2005 images to 2011.
Figure 2. Images used in carrying out the research and distribution of clouds and shadow of clouds in the satellite passing day. Source: Oliveira (2012).
Revista Geama, v.2, n.3, jul.-set., 2016. Received: May 24, 2016 | Approved: June 26, 2016.
However, the years 2005 and 2007 showed high rainfalls index for the month in which the image was taken, which may explain the increased incidence of clouds among the images used.
After concluding the processing, the image was cropped to the limit of the study area, to improve visualization of the spatial dynamics that took place on the site. Considering that the City of Recife is located at different points (points 65 and 66) of the 214 Landsat orbit. All pre-processing and computation of the indices was made with the separate images. Each index generated at the end of the process was mosaic into an image.
Obtaining reflectance
To obtain the letters of spectral radiance and reflectance has utilized the methodology proposed by Allen et al. (2002), widely used by several authors (Bastiaanssen et al., 1998ab; Silva et al., 2005; Oliveira et al., 2010).
Radiometric calibration
Radiometric calibration or spectral radiance (Equation 1) consists in converting the gray level of each pixel and band in monochrome radiance, that is the reflected solar energy per unit area, time, solid angle and length wave, measured at the satellite in the bands 1, 2, 3, 4, 5, and 7. Considering the thermal band, this is the radiance radiation emitted by each pixel and is used to obtain surface temperature. The radiance of each pixel and the band was obtained by the equation proposed by Markham & Baker (1987):
ND a b a L i i i i 255 − + = (1) where a and b are the minimum and maximum spectral radiances (Wm-2 SR 1 μm-1), ND is the
intensity of pixel (integer value between 0 and 255) will correspond to the bands (1, 2, ..., 7) of the satellites Landsat 5 and 7. The calibration coefficients for TM images are proposed by Chander & Markham (2003).
Reflectance
Reflectance (Eq. 2) of each band (
i) is definedas the ratio of the solar radiation flux reflected by the surface and the incident solar radiation flux, obtained by the equation (Allen et al., 2002):
r i i i
d
Z
K
L
.
cos
.
.
=
(2) where Lλi is the spectral radiance of each band, Kλi is the spectral solar irradiance in each band at the top of the atmosphere (Wm-2 uM-1), Z is thesolar zenith angle and dr is the square of the ratio between the average distance Earth-Sun (ro) and the Earth-Sun distance (r) at a given day of the year (DSA).
Classification of land use and cover in the City of Recife
Given the need to better observe the changes spatiotemporal of use and land cover and perform the quantification of each class, the TM images used, it was decided to hold an unsupervised classification for the spatial area of the municipality.
Thus, it was used the Unsupervised Classification tool available in ENVI 4.5 program. As a statistical method, we used the Classifier Iterative Self-Organizing Data Analysis Technique (ISODATA) where several studies (Costa & Souza Jr., 2005; Galvão & Menezes, 2005; Barbosa Júnior & Almeida, 2010) obtained excellent results for medium spatial resolution images.
As recommended by the authors (New, 1989; Watrin & Rocha, 1992; Venturieri, 1996) it was used the combination of bands 3-4-5 RGB (red bands, Infrared near and medium infrared, respectively) for the Landsat satellite. Altogether it was defined five categories of land use and occupation for the City of Recife classified considering the Technical Manual of Land Use (IBGE, 2006):
Urban area: [...] "include areas of intensive use, structured by buildings and road system, dominated non-agricultural artificial surfaces. Are included in this category “[...] areas of roads, services and transport, energy, communications and associated land areas occupied by industrial and commercial complexes and institutions, may in some cases find themselves isolated from urban areas. The urbanized areas can be continuous, where the non-linear areas of vegetation are exceptional, or discontinuous, where vegetated areas occupy more significant surfaces. "(IBGE, 2006).
Vegetation: [...] "area that had any vegetation comprising a set of the forest, ranging from original forests and fields (primary) and modified to secondary spontaneous forests, shrub, herbaceous and gramíneo-woody in various successional stages of development, spread over
different geographical environments and
situations. "(IBGE, 2006).
Soil exposed: includes natural soil areas without vegetation, with little or too much moisture and area and shape variable;
Water: water bodies with spatial representation for the resolution of the sensor used, can be identified as rivers, streams, canals and other bodies of water linear, or ponds and weirs.
Cloud and shade: pixels related to cloud and cloud shadow with different degree of density that may damage the rating.
Revista Geama, v.2, n.3, jul.-set., 2016. Received: May 24, 2016 | Approved: June 26, 2016.
Results and Discussion
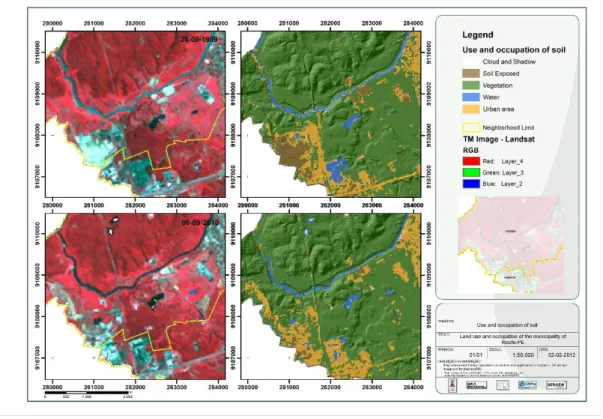
Through unsupervised classification (Isodata), held in the studied images, you can see more easily the spatiotemporal evolution of the use and land cover in the city of Recife (Figure 4). Note that the vegetation observed in the 1987 image was
gradually diminished when compared to images current, especially in areas that were sparser, in the case of RPA 1, 2 and 6. These areas as well as extensive areas of exposed soil observed mainly in the RPA 4, 5 and 6 between the images 1987 and 1991, began to give way, in most cases, new industrial areas and more consolidated urban areas.
Figure 4. Spatio-temporal evolution of land use and occupation in the City of Recife. Source: Oliveira (2012).
Revista Geama, v.2, n.3, jul.-set., 2016. Received: May 24, 2016 | Approved: June 26, 2016.
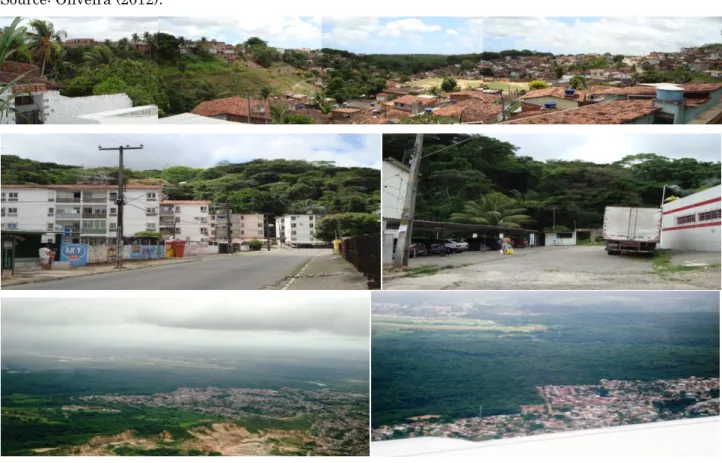
Observing the images from 2005 to 2011 is visualized a much more consolidated urban area with the permanence of some small fragments of more spacialized sized vegetation tree in the city, as well as the forest fragments, such as Matas da Várzea, Curado, Barro, Jardim Uchôa, and Dois Irmãos, for example, located further north and west, which from Law of use and occupation of land of 1996 began to enjoy greater protection to its classification as environmental conservation units. Thus, it can be said that the increase in the number of housing units, mainly influenced by population growth, has been following the most central area of the city to the more peripheral areas as areas of hills to the north (RPA 2) and south of the city ( the RPA 6) and areas located in the neighborhoods of Lowland and Caxangá (Figures 5 and 6), respectively, which in some cases entailed the removal of vegetation and soil sealing.
Considering the Caxangá Avenue, the population growth was 4.12% per year for the period 1991 to 2000. The high population increase
that the Metropolitan Region of Recife has suffered in recent decades came to influence the urbanization of these areas, as noted by Souza et al. (2006) through the analysis supported for the Census data - IBGE. In the case of Várzea neighborhood, Cavalcanti et al. (2008, p.101), through social study carried out in all districts of Recife, warned that the Lowland neighborhood had a population growth of 2.05% per year, during the period 1991-2000, and "this reality indicates the presence of settlements pressing areas of preservation of the neighborhood " (Figure 7), given that over 50% of the district's area is occupied by the Nature Conservation Unit (UCN) of Várzea and Várzea/Curado.
A study conducted by the Polis Institute (2009) showed that policy to eradicate mocambos in the 40s of the last century, promoted the removal of 12,000 shacks located in the center of Recife and [...] "most of the families who occupied the area surrounding the central area migrated to neighboring municipalities and the hills of the north of the city (Instituto Polis, 2009).
Figure 5. Increasing number of housing units and removal of vegetation near the forest Lowland, Várzea neighborhood – Recife – PE. Source: Oliveira (2012). Legends: Use and occupation of soil. Brown=exposed soil, Green=understory vegetation, Blue=water, Yellow=urban area.
Revista Geama, v.2, n.3, jul.-set., 2016. Received: May 24, 2016 | Approved: June 26, 2016.
Figure 6. Increasing the number of housing units and removal of vegetation in the neighborhood of Caxangá Avenue – Recife – PE. Source: Oliveira (2012). Legends: Use and occupation of soil. Brown=exposed soil, Green=understory vegetation, Blue=water, Yellow=urban area.
Figure 7. Anthropic pressure area surrounding the Forest of Várzea, Várzea neighborhood – Recife – PE. Source: Oliveira (2012).
Revista Geama, v.2, n.3, jul.-set., 2016. Received: May 24, 2016 | Approved: June 26, 2016.
Table 1 shows the values of resident population
and considerable population growth in the city of Recife over the Metropolitan Region of Recife for the years 70, 80, 90 and 2000 of the last century. Table 1. Quantitative of the population in the City of Recife and the Metropolitan Area (M.R.) of Recife.
Local
Resident Population Population
1970 Increase 1970-80 Population 1980 Increase 1980-90 Population 1991 1990-2000 Increase Population 2000
Recife 1.060.701 143.198 1.203.899 94.330 1.298.229 124.676 1.422.905
Recife M.R. 1.827.173 568.169 2.395.342 524.655 2.919.981 417.583 3.337.565
Source: Modified of Souza et al. (2006).
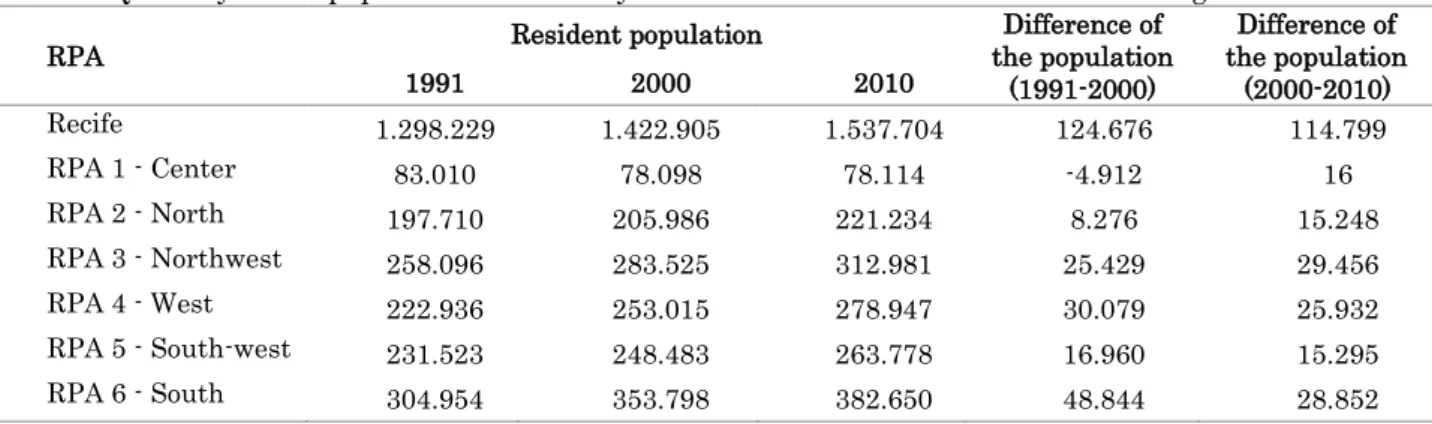
Table 2 permits to observe the population distribution for each Political Administrative Region for Census 1991, 2000, and 2010. Note that the RPA 1, although more consolidated, showed a decrease in the number of inhabitants, in the years
of 1991 and 2000. The other RPAs showed a progressive increase in the population for the three censuses. The most substantial increases in the number of inhabitants occurred in the RPA 6. Table 2. Quantity of the population in the City of Recife for Political Administrative Regions.
RPA Resident population
Difference of the population (1991-2000) Difference of the population (2000-2010) 1991 2000 2010 Recife 1.298.229 1.422.905 1.537.704 124.676 114.799 RPA 1 - Center 83.010 78.098 78.114 -4.912 16 RPA 2 - North 197.710 205.986 221.234 8.276 15.248 RPA 3 - Northwest 258.096 283.525 312.981 25.429 29.456 RPA 4 - West 222.936 253.015 278.947 30.079 25.932 RPA 5 - South-west 231.523 248.483 263.778 16.960 15.295 RPA 6 - South 304.954 353.798 382.650 48.844 28.852
Source: IBGE, Census of 1991, Census of 2000 e Census of 2010. As a result of rapid urban densification, Garcia
(1999) cites the replacement of natural surface for various types and shapes of buildings, forming a compact and dense set, with the most varied types of coating and various physical properties. Thus, it forms a roughness which promotes changes in air movement at the surface, which causes changes in urban radiation gradient influencing the temperature of the air. The Instituto Polis (2009) states that the city outskirts, densely populated, exhibited high growth rates in the years
1991-2000, as [...] "Cohab (39%), Barro (57%) , Macaxeira (71%), Passarinho (76%) and Caçote (77%) " which can be viewed by expanding urban class between the years 1987 and 2005, Figure 4, to the neighborhood of Cohab, for example.
The graph (Figure 8) shows the changes in the values of the primary uses and coverage of the City of Recife. It is noticeable how the exposed soil area was increasing between 1987 and 1991, and the subsequent decline from the year 2005 to almost 1/3 of the area shown in previous years.
Figure 8. Temporal variation graph of the urban area exposed soil and vegetation of Recife in square kilometers (km²). Source: Oliveira (2012).
Revista Geama, v.2, n.3, jul.-set., 2016. Received: May 24, 2016 | Approved: June 26, 2016.
These areas pass, in most of the cases, through the process of expansion in number of residential buildings, as seen, for example, in the neighborhoods of Peixinhos, Santo Amaro and Campo Grande (Figure 9), and expansion or implementation of new industries, as noted in neighborhood Curado (Figure 10). Another implication of urban density it is a decreased of infiltration caused by waterproofed areas, especially in periods of high rainfall (Fendrich & Iwasa, 1998).
Research conducted by Oliveira et al. (2015) found increased waterproofing large areas and decreased of permeable soil and green areas in the vicinity of Santo Amaro, Recife - PE, which comes influence the number of flooding events with
precipitation exceeding 30mm. Thus, occurred the gradual reduction of green areas inside the lots which ultimately produce greater pressure on public drainage infrastructure.
Nobrega (2016) conducted a study aimed at investigating the effects of use changes and land cover in a sub-basin of the Jamari River, located in the Brazilian Amazon basin. Using realistic scenarios of deforestation observed an increase in surface runoff and decreased evaporation and infiltration for the model used.
Tucci (2000) alleges that an inhabitant produces on average an impervious area of 49m² in a watershed. The 10% increase in impervious area is approximately 100% increase in the flood coefficient and the volume of runoff.
Figure 9. Decreased of soil areas exposed and constructive residential densification in Santo Amaro neighborhoods, Peixinhos and Campo Grande – Recife – PE. Source: Oliveira (2012). Legends: Use and occupation of soil. Brown=exposed soil, Green=understory vegetation, Blue=water, Yellow=urban area.
The spatial distribution of small areas with vegetation cover was also decreasing spatially, especially in neighborhoods of RPA RPA 2 and 3 (Figure 11). The steep slopes in some places of the RPA 2 are presented as one of the factors that limited the occupation of some areas of these districts, allowing that established vegetation there develop greater biomass.
Through Table 3 is possible to observe the temporal change of the built and waterproofed areas and vegetated areas for RPA 1, 2 and 6. Because of the high incidence of cloud cover in the
areas that comprise the RPA 3, 4 and 5, was preferable not to use the values obtained for the same. However, through Table 4, it is noted that the vegetated areas have been decreasing in this RPA, especially in the RPA 2, while the urban area was densifying each year.
Considering the RPA 6, in 1987, the vegetation occupied about 27.68% of total area of RPA and, in 2011, it began to occupy just over 21%. The already constructed area from 26.14%, in 1987, to 63.68%, in 2011. Considering the RPA 2, the increased urbanized area was considerable, from 49.45%, in
Revista Geama, v.2, n.3, jul.-set., 2016. Received: May 24, 2016 | Approved: June 26, 2016.
1987, to 82.83% occupancy the RPA area, in 2011. Considering the vegetated area, there was a decrease in the area from 42.29%, in 1987, to
12.97%, in 2011 (Figure 12). Most of these vegetation areas is in areas of high gradient, which prevents the occupation of these areas (Figure 13). Figure 10. Decrease in bare soil areas and expansion of industrial areas about Curado – Recife - PE. Source: Oliveira (2012).
Figure 11. Decrease in vegetation cover in the neighborhoods of Nova Descoberta and Vasco da Gama – Recife - PE. Source: Oliveira (2012).
Revista Geama, v.2, n.3, jul.-set., 2016. Received: May 24, 2016 | Approved: June 26, 2016.
Table 3. Builted area values and vegetated area for RPA 1, 2 and 6 (km²).
Image RPA 1
1 RPA 22 RPA 63
Urban
area Vegetated area Urban area Vegetated area Urban area Vegetated area
09-05-1987 7.04 2.21 7.32 6.26 11.00 11.65 28-09-1989 8.02 1.03 9.11 3.80 15.34 9.76 14-06-1991 6.06 2.81 7.11 5.86 12.31 13.54 08-09-2005 9.75 1.15 12.01 2.39 24.83 9.93 26-08-2006 9.47 1.28 11.39 2.63 24.34 10.18 28-07-2007 9.69 1.38 11.19 1.94 24.57 10.80 06-09-2010 9.41 1.42 11.78 2.65 25.54 9.82 25-09-2011 8.41 1.85 12.26 1.92 26.80 8.87
1 The RPA 1 has a total area of 15.25 km². 2 The RPA 2 has a total area of 14.80 km². 3 The RPA 6 has a
total area of 42.08 km². Source: Oliveira (2012).
Figure 12. Decreased vegetation cover in areas of RPA-2, Recife – PE. Source: Oliveira (2012).
Figure 13. Distribution of vegetation in areas with steep slopes in the area RPA-2, Recife – PE. Source: Oliveira (2012).
Considering the RPA 1, the area known as the Expanded Center of the City of Recife, technical convention adopted by Recife City Hall delimiting the center on Avenida Agamenon, comprising the districts of Recife, Boa Vista, Santo Antonio, São Jose, Santo Amaro, Ilha do Leite, and Cabanga, there were no major changes in the values of
vegetated areas and building area when compared to other RPA's, due to high consolidation of much of its area, including the location of several historic buildings. The vegetated area decreased from 14.49%, in 1987, to 12.13%, in 2011. The urban occupation changed from 46.16%, in 1987, to 55.14%, in 2011.
Revista Geama, v.2, n.3, jul.-set., 2016. Received: May 24, 2016 | Approved: June 26, 2016.
The Figure 14 shows that most of the vegetated areas located in RPA 1 is distributed in public areas, such as the Treze de Maio Park (Marker 1), Tiradentes Squares (Marker 2), the República Squares (Marker 3), and the Campo das Princesas Palace (Marker 4, in Figure 15). It makes more difficult the vegetal suppression aiming the change in the pattern of use.
Other areas such as the Graveyard Senhor Bom Jesus of Redemption (Marker 5), also known as Santo Amaro Cemetery lost part of the vegetated area that contained, as can be seen between
September 1989 and September 2010 images (Figure 14).
Morero et al. (2007), considering Brazilian cities, state that there is an economic space for green/leisure areas, despite the studies conducted by the Brazilian Academy, demonstrating the importance of these areas, which "comes to deteriorate the quality of life of the inhabitants." Similarly, Caporusso and Matias (2008) state that green areas have not shown the same growth when compared to urban areas and, in most cases, are presented only as an expression of landscape design and local characteristics (Vieira, 2004). Figure 14. Indication of some of the main public areas located in the Central region expanded – Recife - PE. Source: Oliveira (2012).
Figure 15. Distribuição da vegetação em áreas públicas do município do Recife – PE. Source: Oliveira (2012).
Revista Geama, v.2, n.3, jul.-set., 2016. Received: May 24, 2016 | Approved: June 26, 2016.
Costa (2004, p. 68), in a study conducted in the region of Piracicaba (SP) with aerial photo mosaics, shows the reduction of green areas as a result of high urban growth, between 1960 and 1990. The author states that, since 1980, has increased the need to "invest in green areas within the consolidated urban area and the preservation of natural sites in the urban environment" in the region.
Vieira & Biondi (2008) found a decrease in vegetation cover in the city of Curitiba, from 39% to 30% of the territory between the years 1986 and 2004. This decrease occurred as a result of the process of urban growth in all regional administrators of the city.
Considering Carvalho (2001, p. 231), the vegetation has significant benefits, "especially in climate mitigation process of the urban environment by creating a pleasant microclimate that contributes significantly to the environmental comfort and well-being of the population." It becomes crucial to the maintenance and preservation of vegetated areas, especially in more densely populated areas of the City of Recife.
Conclusion
The vegetation observed in the image of 1987 gradually decreased when compared to images of 2005 to 2011, mainly in areas that were sparser in Political and Administrative Regions-RPA 1, 2 and 6.
When observing the images from 2005 to 2011 is visualized a much more consolidated urban area with the permanence of some small fragments of more spacialized vegetation tree in the city, as well as the large plant fragments, like the Matas da Várzea, Curado, Barro, Jardim Uchôa, and Dois Irmãos.
The population increase recorded by the Census and reflected in changes in land use and land cover could be accompanied using medium spatial resolution images.
Become important the maintenance and preservation of the remaining vegetated areas, especially in more densely populated areas of the city of Recife.
Acknowledgement
The authors thanks the Coordenação de Aperfeiçoamento de Pessoal de Nível Superior (CAPES) for the Master's scholarship to the first
author, the Conselho Nacional de
Desenvolvimento Científico e Tecnológico (CNPq) for funding the Forest and Mangrove Project: 577356/2008-9, the INPE for the satellite images through the satellite image Catalog and the
Universidade Federal de Pernambuco by the institutional support.
The second and third author are Fellows of CNPq Productivity.
References
AGEDA JUNIOR, J. C. U.; AMORIM, M. C. C. T. Indicadores ambientais e planejamento urbano. Caderno Prudentino de Geografia, n. 31, v. 2, p. 5-35, 2009.
ALLEN, R. G.; TASUMI, M.; TREZZA, R. SEBAL (Surface Energy Balance Algorithms for Land). Advance Training and Users Manual – Idaho Implementation, version 1.0, 97p., 2002.
BASTIAANSSEN, W. G. M.; MENENTI, M.; FEDDES, R. A.; HOLTSLAG, A. A. M. A. Remote Sensing Surface Energy Balance Algorithm for Land (SEBAL) 1. Formulation. Journal of Hydrology, v. 212-213, p. 198-212, 1998a.
BASTIAANSSEN, W. G. M.; PELGRUM, H.; WANG, J.; MORENO, Y. M. J.; ROERINK, G. J.; VAN DER WAL, T. The Surface Energy Balance Algorithm for Land (SEBAL) 2. Validation.
Journal of Hydrology, v. 212-213, p. 213-229,
1998b.
BRIGHT, R. M.; BOGREN, W.; BERNIER, P.; ASTRUP, R. Carbon-equivalent metrics for albedo changes in land management contexts: relevance of the time dimension. Ecol Appl., v. 26, n. 6, p. 1868-1880, 2016.
CAVALCANTI, H.; BRITTO LYRA, M. R.; AVELINO, E. (Orgs.). Diferentes padrões de desigualdades da cidade do Recife. In: Mosaico
urbano do Recife. Exclusão Inclusão
Socioambiental. Recife, Editora Massangana, 2008, 324p.
CAPORUSSO, D.; MATIAS, L. F. Áreas verdes urbanas: avaliação e proposta conceitual. VIII Seminário de Pós-Graduação em Geografia da UNESP. Rio Claro – SP. 2008.
CARVALHO, M. M. Clima urbano e vegetação: estudo analítico e prospectivo do Parque das Dunas em Natal. Dissertação (Mestrado) – Universidade Federal do Rio Grande do Norte. Departamento de Arquitetura, 2001.
COSTA, F. P. S. Evolução urbana e da cobertura vegetal de Piracicaba – SP (1940-2000). 96f.
Dissertação (Mestrado em Ecologia de
Revista Geama, v.2, n.3, jul.-set., 2016. Received: May 24, 2016 | Approved: June 26, 2016.
Agricultura “Luiz de Queiroz”, Universidade de São Paulo, Piracicaba. 2004.
COSTA, A. S.; SOUZA JR., C. L. Comparação entre imagens Landsat ETM+ e MODIS/TERRA para detecção de incrementos de desmatamento na região do baixo Acre. RBC - Revista Brasileira de
Cartografia, No 57/02, p. 93-102, 2005.
CHANDER, G.; MARKHAM, B. Revised Landsat-5 TM Radiometric Calibration Procedures and
Postcalibration Dynamic Ranges. IEEE
Transactions on Geoscience and Remote Sensing, v. 41. n. 11, p. 2674-2677, 2003.
CHEN, X.; ZHAO, H.; LI, P.; YIN, Z. Remote sensing image-based analysis of the relationship between urban heat island and land use/cover changes. Remote Sensing of Environment, v. 104, p. 133-146, 2006.
EMBRAPA. Sistema Orbitais de Monitoramento e Gestão Territorial – LANDSAT – Land Remote Sensing Satellite. Empresa Brasileira de Pesquisa
Agropecuária. Disponível em:
http://www.sat.cnpm.embrapa.br/conteudo/landsa t.htm.2009. Acesso em: 15-06-2010.
FENDRICH, R.; IWASA, O. Y. Controle de erosão urbana. In: Geologia de Engenharia, São Paulo: Associação Brasileira de Engenharia (ABGE), pp. 271-281. 1998.
FREITAS, R. M. de. Entre mitos e limites: as possibilidades do adensamento construtivo face à qualidade de vida no ambiente urbano. Universidade Federal do Rio Grande do Sul, Faculdade de Arquitetura. Tese (Doutorado – Programa de Pesquisa e Pós-graduação em Arquitetura). 280p.: il. Porto Alegre – RS, 2005. GALVÃO, W. S.; MENESES, P. R. Uso de SIG e do classificador ISODATA na geração do mapa de regiões geoambientais homogêneas na bacia do rio São Francisco, como um produto estratégico de apoio às ações de planejamento de redes fluviométricas. In: XII Simpósio Brasileiro de Sensoriamento Remoto, Anais, Goiânia, Brasil, 16-21 abril 2005, INPE, pp. 16-2177-16-2184.
GUO, Z.; WU, R.; XIAO, Y.; CHEN, X.; LIU, X. Z. Impacts of urban biophysical composition on land surface temperature in urban heat island clusters. Landscape and Urban Planning, v. 135, p. 1-10, 2015.
INSTITUTO BRASILEIRO DE GEOGRAFIA E ESTATÍSTICA (IBGE). Manual técnico de uso da Terra. Manuais técnicos em Geociências. n. 7. 2ª Edição. Rio de Janeiro. 2006.
INSTITUTO BRASILEIRO DE GEOGRAFIA E ESTATÍSTICA (IBGE). Instituto Brasileiro de Geografia e Estatística. Censo Demográfico do ano 2010. Acesso em 20 de março de 2014. Disponível em: https://censo2010.ibge.gov.br/. 2010.
INSTITUTO POLIS. Moradia é central: inclusão, acesso e direito a cidade – Recife. Disponível em: http://www.moradiacentral.org.br/pdf/recife.pdf. 2009.
BARBOSA JÚNIOR, J. S.; ALMEIDA, A. S. Análise multitemporal com a utilização da técnica de sensoriamento remoto e geoprocessamento no município de Bonito-Pará. In: III Simpósio Brasileiro de Ciências Geodésicas e Tecnologias da Geoinformação. Anais, Recife-PE, 27-30 de julho de 2010. pp. 1-7.
KÖPPEN, W. The Climates of North America. R. Handbuch der Klimatologie, Berlin, 1948.
MARKHAM, B. L.; BARKER, L. L. Thematic
mapper bandpass solar exoatmospherical
irradiances. International Journal of Remote Sensing, v. 8, n. 3, p. 517-523, 1987.
MOREIRA, E. B. M.; GALVÍNCIO, J. D. Distribuição Espacial das Temperaturas à Superfície na cidade do Recife, utilizando imagens TM Landsat – 7. Revista de Geografia, v. 24, n. 3, p. 122-135, 2007.
MORERO, A. M.; SANTOS, R. F.; FIDALGO, E. C. C. Planejamento ambiental de áreas verdes: estudo de caso de Campinas-SP. Revista do Instituto Florestal, v. 19, n. 1, p. 19-30, 2007.
NOBREGA, R. S. A hydrological-modeling study of the impact of land use/land cover and climate change on runoff in a watershed in the western Brazilian Amazonia. Revista GEAMA, v. 2, n. 2, p. 106-120, 2016.
NOVACK, T. Classificação da cobertura da terra e do uso do solo urbano utilizando o sistema InterIMAGE e imagens do sensor Quick-Bird.
Dissertação (Mestrado em Sensoriamento
Remoto). 214p. Instituto Nacional de Pesquisas Espaciais, São José dos Campos; (INPE-16594-TDI/1580), 2009.
NOVO, E. M. L. M. Sensoriamento Remoto –
Princípios e aplicações, São Paulo, 2a Ed. Edgard
Blücher Ltda, pp.277-283. 1989.
NUCCI, J.C. Qualidade ambiental e adensamento urbano. São Paulo: Humanitas/FAPESP, 2001, 236p.
Revista Geama, v.2, n.3, jul.-set., 2016. Received: May 24, 2016 | Approved: June 26, 2016.
OLIVEIRA, T. H.; MACHADO, C. C. C.; SILVA, J. S.; GALVÍNCIO, J. D.; PIMENTEL, R. M. M.; SILVA, B. B. Índice de Umidade (NDWI) e Análise Espaço-Temporal do Albedo da Superfície da Bacia Hidrográfica do Rio Moxotó-PE. Revista Brasileira de Geografia Física, v. 3, p. 55-69, 2010.
OLIVEIRA, T. H. Mudança espaço temporal do uso e cobertura do solo e estimativa do balanço de energia e evapotranspiração diária no município do Recife-PE. Dissertação (mestrado) - Universidade Federal de Pernambuco. CFCH. Programa de Pós-Graduação em Geografia. 154 f. :il. ; 30 cm. 2012. OLIVEIRA, T. H.; SILVA, J. E. ; SANTOS, M. O. ; OLIVEIRA, J. S. E. S. ; GALVÍNCIO, J. D. Evolução espaço-temporal da drenagem superficial e do processo de impermeabilização em Santo Amaro, Recife-PE. Revista Brasileira de Geografia Física, v. 8, p. 1571-1587, 2015.
PAULEIT, S.; ENNOS, R.; GOLDING, Y. Modeling the environmental impacts of urban land use and land cover change-a study in Merseyside, UK. Landscape and Urban Planning, v. 71, p. 295-310, 2005.
PIELKE, R. A.; MARLAND, G.; BETTS, R. A.; CHASE, T. N.; EASTMAN, J. L.; NILES, J. O.; NIYOGI, D. D. S.; RUNNING, S. W. The influence of land-use change and landscape dynamics on the climate system: relevance to climate-change policy beyond the radiative effect of greenhouse gases. Philos. Trans. R. Soc. Lond. A. Math. Phys. Eng. Sci., v. 360, p. 1705-1719. 2002.
SILVA, B. B. da; LOPES, G. M.; AZEVEDO, P. V. de. Balanço de radiação em áreas irrigadas utilizando imagens Landsat 5-TM. Revista Brasileira de Meteorologia, v. 20, n. 2, p. 243-252, 2005.
SILVA, B. B. da; SILVA, S. T. A.; GOMES, H. B. Alterações climáticas decorrentes de mudanças no uso da terra mediante sensoriamento remoto. Mercator, v. 9, Número especial 1, p. 91-106. 2010. SOUZA, M. A. A.; BITOUN, J.; MIRANDA, L. Como anda a Região Metropolitana do Recife. Universidade Federal de Pernambuco. Disponível em: http://www.observatoriodasmetropoles.ufrj.br/
como_anda/como_anda_RM_recife.pdf. Acesso em: 13-01-2012. 2006.
SUN, L.; WEI, J.; DUAN, D. H.; GUO, Y. M.; YANG, D. X.; JIA, C.; MI, X. T. Impact of Land-Use and Land-Cover Change on urban air quality in representative cities of China. Journal of Atmospheric and Solar-Terrestrial Physics, v. 142, p .43-54, 2016.
TIAN, L.; GE, B.; LI, Y. Impacts of state-led and bottom-up urbanization on land use change in the peri-urban areas of Shanghai: Planned growth or uncontrolled sprawl? Cities, v. 60, p. 476-486, 2016.
TUCCI, C. Coeficiente de escoamento e vazão máxima de bacias urbanas. Revista Brasileira de Recursos Hídricos, v. 5, n. 1, p. 61-68. 2000. VENTURIERI, A. Segmentação de imagens e lógica nebulosa para treinamento de uma rede neural artificial na caracterização do uso da terra na região de Tucuruí (PA). Dissertação (Mestrado em Sensoriamento Remoto), Instituto Nacional de Pesquisas Espaciais, São José dos Campos-SP. 1996.
VIEIRA, P. B. H. Uma visão geográfica das áreas verdes de Florianópolis, SC: estudo de caso do Parque Ecológico do Córrego Grande (PECG). Trabalho de Conclusão de Curso, Universidade Federal de Santa Catarina, Florianópolis-SC, 2004.
VIEIRA, C. H. S. D.; BIONDI, D. Análise da dinâmica da cobertura vegetal de Curitiba, PR (de 1986 a 2004), utilizando imagens Landsat TM. Revista Árvore, v. 32, n. 3, p. 479-487, 2008. WATRIN, O. S.; ROCHA, A. M. A. Levantamento da Vegetação Natural e do Uso da Terra no Município de Paragominas (PA) Utilizando Imagens TM/Landsat. Belém, EMBRAPA/CPATU, 40p. (EMBRAPA/CPATU, Boletim de Pesquisa, 124). 1992.
ZHAO, K.; JACKSON, R. B. Biophysical forcings of land-use changes from potential forestry activities in North America. Ecological Monographs, v. 84, p. 329-353, 2014.