Influence of Constraining and Confinement in the
Molecular Mobility of Low Molecular Weight
Materials
Ana Rita Elias Brás
(Graduated in Chemical Engineering)
Dissertation presented to obtain a Ph.D. Degree in Chemical Physics
Supervisors: Dr. Madalena Dionísio
(U.N.L. – Portugal)
Dr. Andreas Schönhals
(B.A.M. – Germany)
Examiners:
Dr. Simone Capaccioli
Dr. Carlos Jorge Mariano Miranda Dias
Dr. Pedro Manuel Corrêa Calvente Barahona
Dr. Natália de Fátima Teixeira Correia
Dr. João Filipe Colardelle Luz Mano
À minha querida Mãe,
ao Thomas,
à Avó Júlia e ao Avô Cristovão,
“A Ciência é a razão do Mundo, a Arte a sua alma.”
Máximo Gorki
“
A finalidade da Ciência é a Verdade. A finalidade das Artes é, pelo contrário, o prazer.”
Gotthold Ephraim Lessing
“Unsere Hauptaufgabe ist nicht, zu erkennen, was unklar in weiter Entfernung liegt sondern:
Zu tun, was klar vor uns liegt.“
i Dr. Kia L. Ngai Naval Research Laboratory DC 20375-5320 Washington, DC, (USA) email: [email protected]
EVALUATION FORM OF THE Ph.D. THESIS WHICH DATA ARE INDICATED IN THE FOLLOWING
AUTHOR OF THE Ph.D. THESIS: Ana Rita Elias Brás
TITLE OF THE Ph.D. THESIS: Influence of constraining and confinement in the molecular dynamics of low molecular weight materials
ADVISERS: Maria Madalena Alves Campos de Sousa Dionísio Andrade (Assistant Professor of the Chemistry Department, of Faculdade de Ciências e Tecnologia da Universidade Nova de Lisboa) and Priv. Doz. Dr. Habil. Andreas Schönhals (BAM-Federal Institute of Materials Research and Testing, Germany)
Dr. K.L. Ngai , selected as external evaluator of the Ph.D. Thesis described before, provides the respective EVALUATION FORM.
Naval Research Laboratory, Washington DC, USA , the 15th of December of 2009
ii 1. Existence of concrete objectives and interest in the subject of the Thesis:
Definitely the thesis work has concrete objectives, and the subject matter is of current interest in the research community.
2. Existence of a methodologic strategy suited to the proposed objectives:
The candidate used techniques well suitable for the investigation of the dynamics of soft matter, and followed some previously established methods to investigate the dynamics of several materials. Her advisors are experts in the field and the methodology she followed are well suited for the objectives.
3. Interest of the achieved results and conclusions:
The results obtained by the candidate are of great interest not only to the glass transition research community, but also to pharmaceutical research, and to nano-science. The conclusions have impact on the current understanding.
4. Formal characteristics of the doctoral memory:
The thesis is well written, rich in content, and reflects many months of hard work by the candidate. She is well trained and ready to go on to do bigger things.
5. Observations (use as many as blank pages as necessary):
The thesis has the quality that it can be accepted for the Ph.D. degree at prominent American Universities. I congratulate her for a job well done.
6. Global evaluation
1 Dr. Simone Capaccioli Researcher and Lecturer- Dynamics of Soft Matter Lab Dipartimento di Fisica, Università degli Studi di Pisa,
Largo B.Pontecorvo n.3 - I-56127 Pisa (Italy) tel. 0039-0502214537; tel. 0039-0502214322 (lab) fax 0039-0502214333 email: [email protected]
EVALUATION FORM OF THE Ph.D. THESIS WHICH DATA ARE INDICATED IN THE FOLLOWING
AUTHOR OF THE Ph.D. THESIS: Ana Rita Elias Brás
TITLE OF THE Ph.D. THESIS: Influence of constraining and confinement in the
molecular dynamics of low molecular weight materials
ADVISERS: Maria Madalena Alves Campos de Sousa Dionísio Andrade (Assistant
Professor of the Chemistry Department, of Faculdade de Ciências e Tecnologia da Universidade Nova de Lisboa) and Priv. Doz. Dr. Habil. Andreas Schönhals (BAM-Federal Institute of Materials Research and Testing, Germany)
Dr. SIMONE CAPACCIOLI , selected as external evaluator of the Ph.D. Thesis described before, provides the respective EVALUATION FORM.
PISA, the 10th of December of 2009
2
1. Existence of concrete objectives and interest in the subject of the Thesis:
The main objective of this work is the experimental study of the effects of nano-scale confinement on the dynamics of glass forming materials.
This issue is one of the most debated and hot topic in current literature and it is one of the most interesting subject for basic research in condensed matter study. In fact, although this subject has been studied since several decades and by several top scientists and laboratories (I could mention the Nobel Prize laureate J.P. De Gennes, but also J. Forrest, Greg McKenna, Friedrich Kremer, Andreas Schönals, etc.), an overall shared rationale about the observed results is still missing. The challenge is actually very general and regards also the concepts used to explain the properties of supercooled liquids in the bulk state: to understand what happened when matter is confined at the nanoscale, where the size of the confinement is approaching that typical for several dynamic and thermodynamic phenomena is of impact for all the field. The interest from the point of view of the basic research is well justified.
Actually Science is more valuable if it has a specific accountability for the overall society. Well, this thesis can attract also a strong interest for the applied point of view. In fact, the three systems chosen for testing the effect of confinement on dynamics are very important for nanotechnology applications:
a) Liquid crystals are of interest by themselves, for instance for their applications for displays and electro-optical devices, but the study of a partially ordered phase in nano-pores is a subject relevant for the study of the interfacial effect in soft matter and biomimetic materials;
b) The confinement of drugs, like ibuprofen, are important for medicine and pharmaceutical research, especially because the nano-confinement can allow their preparation or reinforce their stability in the amorphous state, that is the fundamental state to have a good bioavailability and prompt solubility. Concerning this issue, the idea of study dynamics in the supercooled and glassy state of confined ibuprofen is striking. Also the matrix used for nano-confinement is an excellent choice, as similar systems are used for controlling drug delivery and release in the organisms;
c) The study of partially crystallized polymers and in particular the mobility in the rigid amorphous phase (RAP) of PLLA is also of strong applied interest for several reason. PLLA is a biodegradable materials that recently is often preferred to other poly-esters, like PET, of difficult recycling. Moreover, it is one of the most used polymeric materials for gas barrier film membranes in packaging (both food and drug) industry. Concerning the last issue, it has to be mentioned that the nano-scale confined rigid amorphous phase is the most responsible for gas permeation in the polymeric membrane. Controlling its mobility means to tune the properties of gas barrier of the film. Finally, PLLA is a biopolymer of strong use in biomedical applications, like scaffolds for tissue engineering prosthetic implants. Again, mobility in RAP can controlled mechanical properties and it is clear that this can be of interest for applications.
Summarizing, the objectives of the thesis are clear, well chosen and concrete. Its interest is strong for both the fundamental and applied research.
3 The thesis is a nice example of experimental work. All the best methods were used to prepare nano-porous matrices, characterized them and optimizing the filling procedure with the materials under study. This work was carried out according careful and advanced procedures and using the best experimental techniques. Concerning dynamics, a lot of work have been done first on the materials (E7 and ibuprofen) in their bulk state, in order to obtain information completely lacking in the literature or only present in a marginal form. This part, on its own, would be original and valuable. All the other part, related to confinement, is of striking accuracy. The main experimental technique used was (DS) dielectric spectroscopy, very often conducted on a very broad band (more than 11 decades) and always the results were completely analysed, taking into account information coming from the temperature dependence of (i) dielectric strength, (ii) characteristic relaxation times, (iii) shape parameters and, in some cases, also the conductivity contribution was considered. Very often, several experimental techniques were used and combined in order to get information and rationalizing the results. For instance, in the case of E7, the combined used of specific heat spectroscopy and DS was able to reveal that the process related to the glass transition is the tumbling motion. Again in the case of confined E7, infrared spectroscopy provided information about the state of interaction of cyano group to the interface. In the case of ibuprofen, the tendency to form aggregates by H-bonding was proofed by DSC, HPLC, ESI Spectrometry, IR spectroscopy and also predicted by molecular dynamic simulations.
Finally, let me affirm that it is very rare to see how many results coming from different techniques were well rationalized in a thesis.
3. Interest of the achieved results and conclusions:
The interest of the specific results and of the conclusions provided by the candidate is multifold. Concerning E7 and ibuprofen in their bulk state, the dielectric study, combined with other techniques, was able to deepen some aspect still unclear in literature due to the few data available until now. In Ibuprofen, some important aspects concerning sub-glass relaxations and their relationship to the glass transition were clarified. For E7, all the dynamics is now more clear: among the many results, let me mention the assignment of the tumbling mode as the α-relaxation that brings to the glass transition. Concerning the confinement of the systems (and also the study of the constrained rigid amorphous phase in semicrystalline PLLA) it is important that all the studies revealed common and different points. Always a slower process coming from the guest molecules interacting with the pore walls (or with the crystals in PLLA) was found. On the other hand the behaviour of the other dynamic processes was found to be sensitive to both confinement (finite size effect or density effect) and interfacial (like bonding or ordering to the surface) effect. Actually, the interface determined dynamics of the system, introducing a gradient of relaxation times across the cooperativity length scale of the guest molecules. The way how the different dynamic processes are affected was rationalized in the thesis, providing useful information for further theoretical studies. I evaluate that the
4
4. Formal characteristics of the doctoral memory:
The dissertation is clear, correct, well written in English, and easy to be read also by somebody that is not expert in the specific field. Considering the wide and multidisciplinary interest in the subject, the last mentioned quality is extremely valuable. The quality of the figures, graphs, tables and picture is high and they are always provided by clear and useful captions. References, provided at the end of each chapter, are really extensive and always relevant.
Among the 200 pages, the different parts are well identified, distributed and well balanced. Theoretical and general introduction, mainly introducing the main concepts related to glass transition, dynamics, nano-scale confinement and dielectric relaxation, occupies less than 50 pages. Nevertheless the introduction is correct and very efficient to deliver the basic ideas useful for the subsequent discussion. I appreciated a lot the part about the linear response theory, introduced without too many detailed mathematic formalisms. It is also valuable, in order to clarify the state of the art, the fact that the candidate provided in the introduction also a very extensive and updated review of the existing studies on confinement effect for liquid crystals, pharmaceutical drugs and semi-crystalline polymers. The part about the experimental techniques and materials used is also very clear and useful. The choice to move in this part all the experimental details is excellent. Also it was a good idea to present the results and discussion concerning bulk dynamics of the supercooled materials in a chapter and the effect of the confinement in a subsequent chapter, since the most of the results concerning the dynamics of the bulk materials are presented here for the first time.
I did not find any negative aspects from the formal point of view: I might quote only few typing errors that I found into the text and equations that, considering the large size of the dissertation, are much less than what one could reasonably expect. These errors are essentially typing errors, as the correct meaning is preserved.
Summarizing, my evaluation on the formal point of view is that the thesis is formally excellent. I appreciated, in particular, the communication strategy used by the candidate in the original part, that of results and discussion: to give a short outline at the beginning, then to discuss into details and eventually to summarize at the end of chapters or sub-chapters in the conclusion. It is the common procedure followed to write a good article but I never found that was easy to be done for a doctoral thesis, where usually the amount of information to be managed is much larger.
5. Observations (use as many as blank pages as necessary):
There are actually no important observations to be done. The thesis has solid contents and important results, and it is well written and presented. I could mention the following few typing and formal errors in the following. These are in no way changing my positive evaluation of this thesis. There are maybe more typos in this my report.
Specific observations:
5 The correct one should have at the denominator the bracket including all the terms of the sum: (1+iωτ)βDC;
- Pag.37, equation 1.35: αHN and βHN should exchange their respective position;
- Pag.43, equation 1.49: there should be <cos2θ> instead of cosθ;
- Pag.43, two lines below eq.1.49 “anispotropic” should be changed to “isotropic”; - Pag.45, Ref.42 “McGrun” should be replaced with “McCrum”;
- Pag.48, Ref.118, “Hemperl” should be replaced with “Hempel”; - Pag. 54, Ref.267, “Bets” should be replaced with “Best”;
- Pag.75, Ref.9 and 10: “Shaumburg” should be replaced with “Schaumburg”; - Pag.97, 6 lines from the bottom: “..advantage of being not being..” should be
replaced with “..advantage of being ...”;
- Pag.114, Ref.63, two authors are missing: S. Capaccioli and R. Casalini;
- Pag. 162, 4 lines from the bottom: “..which compare..” should be replaced with “…which compares…”;
- Pag. 169, Ref.15, “Bets” should be replaced with “Best”;
Moreover, in chapter 3, §3.1.x, there is a mention to bulk E7 sample oriented both in parallel and perpendicular direction to the electric field, but no specific details are provided on the experimental method used to obtain such a condition.
6. Global evaluation
X Excellent
F Good F Acceptable F Not acceptable
ix
Apesar da importância que o estado vítreo tem na actualidade, a transição do líquido para o
vidro, transição vítrea, continua a ser uma matéria de debate constituindo um dos grandes
desafios da física da matéria condensada. Uma vez que este facto se encontra intimamente
relacionado com a dinâmica de cooperatividade, o estudo deste fenómeno em líquidos
formadores de vidro sujeitos a confinamento, em nano-escala, surgiu recentemente como uma
estratégia para o esclarecimento de factores como a existência de uma escala de tamanho
inerente para o movimento cooperativo que determina a transição vítrea. Neste contexto, a
presente tese representa uma contribuição adicional para o estudo da dinâmica molecular de
líquidos formadores de vidro sob confinamento em materiais inorgânicos nanoporosos. Como
compostos alvo, foram seleccionados o cristal líquido E7 e o fármaco Ibuprofeno. O primeiro
devido às múltiplas transições que exibe torna-o mais susceptível a perturbações e desse modo
aparece como o candidato ideal para avaliação de efeitos de confinamento. O estudo do 2º
composto, o Ibuprofeno, reveste-se de particular interesse uma vez que o confinamento surge
como uma forma de estabilizar a fase amorfa que assume especial relevância em aplicações
farmacêuticas. A técnica principal que se utilizou para obter informação detalhada acerca da
mobilidade molecular foi a Espectroscopia de Relaxação Dieléctrica (DRS), utilizando uma
larga gama de frequências (10-2-109Hz) (Capítulo I e II).
A primeira parte da tese é dedicada à caracterização dos dois compostos alvo no seu estado
original. Para o E7, a combinação de DRS, com a espectroscopia de calor específico permitiu
determinar qual dos processos de relaxação típicos deste (um processo na fase isotrópica ou
líquida e dois processos na fase nemática: δ e tumbling) é responsável pela transição vítrea Tg
(processo tumbling). O estudo detalhado da mobilidade molecular do ibuprofeno no estado
líquido, líquido sobrearrefecido e vítreo, é apresentado ainda neste capítulo, tendo-se observado
quatro processos de relaxação: dois processos secundários (γ e β), o processo cooperativo
relacionado com a Tg (α) e o processo de Debye (D), este último provavelmente relacionado
com a dinâmica das pontes de hidrogénio. Este estudo foi antecedido por uma optimização das
condições necessárias para amorfizar o Ibuprofeno que no seu estado natural é um cristal
(capítulo III).
No capítulo seguinte (capítulo IV), avaliou-se a dinâmica molecular do E7 confinado em
membranas inorgânicas rígidas de 20 nm de diâmetro de poro quer revestidas com o fosfolípido, lecitina, quer no seu estado natural. Verificou-se que tanto o alinhamento do cristal líquido, como a dinâmica são influenciados pelo confinamento e pelo tratamento da superfície dos
x
relaxação, incluindo os modos já observados no E7 original. Além destes, dois novos processos,
S e I, a frequências inferiores aos anteriores foram detectados e atribuídos às moléculas de
cristal líquido ancoradas à superfície interior e exterior dos poros, respectivamente.
O Ibuprofeno foi igualmente confinado naquelas matrizes com o tamanho de poro 3.6 e 6.8 nm.
Este estudo revelou o confinamento como uma forma eficaz de obter o Ibuprofeno no estado
amorfo. Por DRS observaram-se para além de dois processos secundários (γ e β) semelhantes aos encontrados para o Ibuprofeno livre, dois outros processos, sendo que um deles, o mais
lento, é atribuído às moléculas de Ibuprofeno ancoradas à superfície interior do poro. O outro processo (α) revelou que a dinâmica do Ibuprofeno confinado é acelerada relativamente ao composto original.
Por fim, no capítulo V descreve-se o estudo do constrangimento da mobilidade da relaxação α associada à transição vítrea durante a cristalização do PLLA. Verificou-se que a mobilidade
molecular durante a cristalização isotérmica pode ser descrita como um somatório de dois
processos de relaxação, que progridem de forma independente, um com as características do
processo de relaxação associado á transição vítrea já detectado no PLLA amorfo, e outro, de
menor mobilidade, associado às regiões amorfas rígidas adjacentes à fase cristalina. O
confinamento exercido pela fase amorfa rígida foi estudado em amostras de diferentes graus de
cristalinidade compreendidos entre 0.43 e 0.65. Observou-se ainda que o processo de relaxação
associado à transição vítrea sofre um aumento de mobilidade com o aumento da cristalinidade.
Este facto, quase contra-intuitivo, foi racionalizado em termos de i) aumento da espessura da
fase amorfa rígida que diminui a influência da parede cristalina nos movimentos cooperativos
das cadeias poliméricas e ii) uma fase amorfa menos densa que permanece após a cristalização.
Adicionalmente encontrou-se um carácter multi-modal para o processo de relaxação associado a
movimentos localizados. A natureza multi-componente deste processo secundário revelou-se
como uma sonda da morfologia atingida.
xi
Despite the importance that the glassy state has nowadays, the transition from liquid to theglass, glass transition, still remains a matter of debate which constitutes one of the great
condensed matter physics challenges. Since this fact is closely related to the cooperativity
dynamics, the study of this phenomenon in glass-forming liquids under confinement in the
nanometer scale, has recently emerged as a strategy to clarify factors such as the existence of an
inherent length scale of the cooperative dynamics that determines the glass transition
temperature. In this context, this thesis represents an additional contribution to the study of
molecular dynamics of glass-forming liquids under confinement in nanoporous inorganic
materials. As target compounds the liquid crystal E7 and the drug Ibuprofen were selected.
Since the first exhibit various transitions makes it more sensitive to perturbations and thus
appears as the ideal candidate to evaluate confinement effects. The study of ibuprofen is of
particular interest because confinement emerges as a method of stabilizing the amorphous phase
that is mostly important in pharmaceutical applications. Dielectric Relaxation Spectroscopy
(DRS) is the main technique used to obtain detailed information about the molecular mobility in
a wide range of frequencies (10-2-109Hz) (Chapter I and II).
The first part of the thesis is devoted to the characterization of the two target compounds in the
bulk state. The combination of DRS with the specific heat spectroscopy allowed to determine
which of the E7 observed relaxation processes (a process in the isotropic phase and two
processes in the nematic phase: δ and tumbling) is responsible for the glass transition
temperature Tg (tumbling process). Detailed studies of ibuprofen molecular mobility in the
liquid, supercooled liquid and glassy states are also presented in this chapter, where four
relaxation processes are detected: two secondary processes (γ and β), the cooperative process
related to Tg (α ) and the Debye process (D), probably related to the hydrogen bonding
dynamics. This study was preceded by an optimization of the conditions to obtain amorphous
Ibuprofen which is a crystal in its natural state (Chapter III).
In the next chapter (Chapter IV), the molecular dynamics of E7 confined to untreated and
phospholipid lecithin treated rigid inorganic membranes with 20 nm pore diameter was
evaluated. It was found that both the liquid crystal alignment, as well as the dynamics is
influenced by confinement and treatment of the surface pores. Additionally, E7 was further
studied confined to the mesoporous materials MCM-41 and SBA-15 type, 100% silica
composition and pore size between the 2.8 and 6.8 nm. A multiplicity of relaxation processes
xii
Ibuprofen was also confined to the molecular sieves with pore size 3.6 and 6.8 nm. This studyrevealed to be an effective way to obtain Ibuprofen in the amorphous state. Besides two
secondary processes (γ and β) similar to those found for bulk ibuprofen, it was observed two other processes, the slower one is assigned to the ibuprofen molecules anchored to the inner
surface of the pore. The other process revealed that the dynamics of confined Ibuprofen is faster
as compared to the bulk α-relaxation.
Finally, Chapter V describes the mobility study of the α-relaxation associated to the glass
transition constrained during crystallization of PLLA. It was found that the molecular mobility
during the isothermal crystallization can be described as a sum of two relaxation processes that
evolve independently, one characteristic of the process associated to glass transition already
detected in the amorphous PLLA, and another, with lower mobility, associated with the
amorphous regions adjacent to the rigid crystalline phase. The confinement due to the rigid
amorphous phase was studied in samples of crystallinity degrees between 0.43 and 0.65. It was
observed that the mobility of the relaxation process associated to the glass transition
temperature increased with the increase of crystallinity. This fact, almost counterintuitive, was
rationalized in terms of both i) thicker rigid amorphous phase that decreases the influence of the
rigid crystalline wall on the cooperative motions of the main relaxation process and ii) less
dense mobile amorphous phase that remains after crystallization. Additionally, a multi-modal
character was found for the secondary relaxation process, associated with localized movements.
The multi-component nature of this secondary process turned to be a probe of the morphology
attained.
xiii Agora, no último dia que me resta antes de entregar este meu trabalho e com a pressão natural destes
momentos, quero pensar nos agradecimentos, mas o meu pensamento voa e começo a recordar como
todo o meu percurso começou.
O Erasmus e a minha ida para a Alemanha, o final do curso, a entrada como bolseira para dar início
àquilo que viria a ser a minha vida, o que gosto de fazer e que está a culminar com a entrega da minha
tese de doutoramento.
A todas as pessoas com quem partilhei estes quatro anos…todas mesmo, estou grata e nomeando
apenas alguns nomes, os mais importantes e decisivos, não esqueço, todos aqueles que das mais
diferentes formas me deram o seu incentivo e apoio, todos os meus colegas, amigos, e família que
ajudaram a concretizar e a chegar ao fim desta etapa da minha vida.
À Celina, Sofia, Inês, do laboratório, e em especial a Maite, que me apoiou desde o início. Aos
queridos, Mafalda e João Dias que estão sempre comigo. Ao João Fernandes, à Lili, ao Márcio, à Sofia
e à Ana, pelos almoços e jantares de convívio. Ao Hugo e à Andreia, pelo incentivo e mensagens
encorajadoras. À Pia da Alemanha até hoje, pela sempre presença, ao longe.
Ao Frédéric e à Emeline pela partilha sempre generosa dos seus conhecimentos, que muito
contribuíram para esta tese, assim como pelo seu apoio, muito importante, durante a minha estadia em
Lille.
E por fim…
À Natália, paciente e querida Natália, com os seus ensinamentos, conselhos, o seu saber científico, que
seria deste trabalho sem a sua persistência e amizade. Foi e será sempre um privilégio tê-la do meu
lado.
Ao meu co-orientador alemão Andreas, sempre interessado e gentil, com as suas sugestões e
conhecimentos científicos, que contribuíram de forma crucial para que esta tese se aperfeiçoasse*.
À PROFESSORA Madalena, que tornou real e possível este meu sonho. Fica para além do aqui
descrito a minha gratidão pela sua amizade, pelos seus ralhos, pelas suas canseiras comigo, mesmo
quando por vezes o seu cansaço era evidente. Comecei a trabalhar com ela, antes do inicio desta tese e
assim com o seu muito saber e apoio, consegui aprender e desenvolver as minhas capacidades tanto
pessoais, como científicas nesta área de trabalho que me permitiu ter aqui chegado.
Dou graças a Deus por tudo o que me deu, o que me fez conseguir e por ter encontrado a Professora
xiv dieser Arbeit beigetragen haben.
An erster Stelle möchte ich mich bei Priv.-Doz. Dr. Andreas Schönhals für die sehr gute Betreuung
meiner Arbeit bedanken. Es war ein ganz besonderes Privileg für mich, mit einem der führenden
Experten auf dem Gebiet „confinement and dielectrics“ zusammenzuarbeiten. Die Arbeit mit ihm war
sehr angenehm. Zudem waren fachliche Diskussionen immer sehr fruchtbar gaben mir wichtige
Denkanstöße. Ein ganz besonderer Dank noch einmal für die intensive Betreuung vor allem bei der
endgültigen Ausarbeitung der Doktorarbeit und dem hohen persönlichen Einsatz, der auf Grund der
externen Betreuung sicherlich einiges an Mehraufwand mit sich brachte.
Persönlich danken möchte ich auch Ligia und Stefan Frunza, Hao Ning, Ole Hölck und Diana Labahn
für die nette Unterstützung während meiner Aufenthalte und die gute Arbeitsatmosphäre. Ein weiterer
Dank geht an Frau Bertus und Herrn Audi für die Hilfe im Labor.
I would like to thank “Fundação para a Ciência e Tecnologia” for the financial support by means of
the PhD grant SFRH/BD/23829/2005.
To the Chemistry Department of “Faculdade de Ciências e Tecnologia da Universidade Nova de
Lisboa” (Portugal), to BAM- Federal Institute of Materials Research and Testing (Germany) and to
“Laboratoire de Dynamique et Structure des Matériaux Moléculaires, Université des Sciences et
xv
Reports by external assessors
Dr. Kia L. Ngai, Naval Research Laboratory ... i
Dr. Simone Capaccioli, Università degli Studi di Pisa ... iii
Resumo ... ix
Palavras-Chave ... x
Abstract ... xi
Keywords ... xii
Agradecimentos ... xiii
General Index ... xv
Figure Index ... xix
Table Index ... xxxii
List of Symbols ... xxxv
1-
THEORETICAL ASPECTS1.1
Introduction ... 3
1.2
Glass Transition ... 3
1.2.1
Thermal Glass Transition ... 5
1.2.2
Dynamic Glass Transition ... 7
1.2.2.1
�
-Relaxation ... 7
1.2.3
Open Items in the Understanding of Glass Transition ... 15
1.2.3.1
�
Process and
��
-Splitting ... 15
1.3
Dynamics under confinement ... 20
1.3.1
Confinement Effects- A Literature Review ... 24
1.3.1.1
Liquid Crystals ... 24
1.3.1.2
Pharmaceutical Drugs ... 26
1.3.1.3
Semi-crystalline Polymers ... 27
1.4
Dielectric Relaxation Spectroscopy ... 29
1.4.1.1
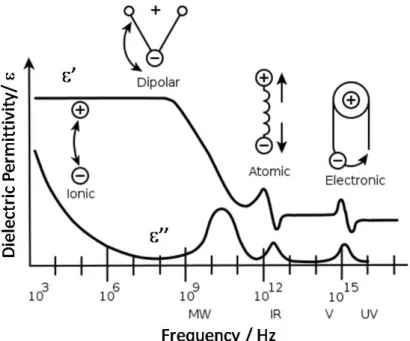
Polarization Mechanisms ... 30
1.4.2
Dielectrics in Time Dependent Fields ... 32
1.4.2.1
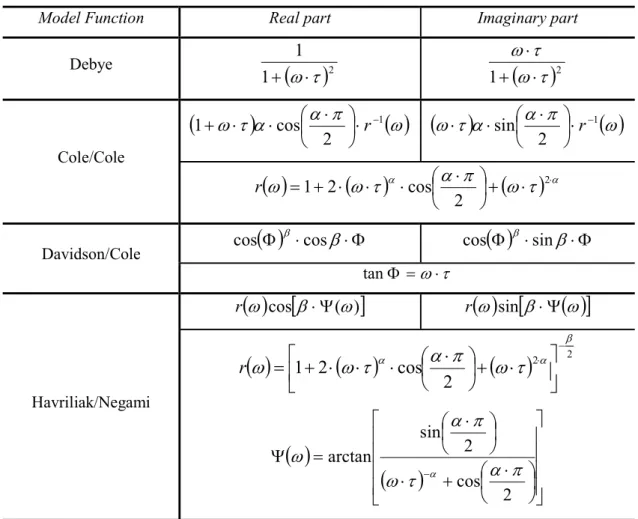
Empirical Models for Non-Debye Relaxation ... 35
1.4.2.2
Dielectric Strength Models ... 39
xvi
2-
EXPERIMENTAL2.1
Introduction ... 57
2.2
Principles of dielectric spectroscopy ... 57
2.3
Impedance Analyzers ... 59
2.3.1
Alpha High Resolution impedance analyzer ... 59
2.3.2
HP 4191A impedance analyzer ... 61
2.4
Temperature control ... 62
2.5
Data Treatment ... 62
2.6
Thermal Analysis ... 63
2.6.1
Differential Scanning Calorimetry (DSC) ... 63
2.6.2
Specific Heat Spectroscopy ... 63
2.6.3
Thermo-Gravimetric Analysis (TGA) ... 64
2.7
High Performance liquid Chromatography ... 64
2.8
Electrospray Ionization Mass Spectrometry ... 65
2.9
Infrared Spectroscopy ... 65
2.9.1
E7 ... 65
2.9.2
Ibuprofen ... 66
2.10
Materials ... 66
2.10.1
E7 ... 66
2.10.2
Ibuprofen ... 68
2.10.3
PLLA ... 68
2.11
Confining Porous Hosts ... 69
2.11.1
Anopore membranes ... 69
2.11.2
Molecular Sieves ... 70
2.12
Impregnation Protocol ... 72
2.12.1
�7
... 72
2.12.2
Ibuprofen ... 73
2.13
References ... 75
3-
M
OLECULARM
OBILITY OFB
ULKM
ATERIALSxvii
3.1.3.1
Specific Heat Spectroscopy ... 79
3.1.4
Dielectric Characterization ... 80
3.1.5
Conclusion ... 89
3.2
Ibuprofen ... 90
3.2.1
Introduction ... 90
3.2.2
Experimental Conditions ... 90
3.2.3
Results and Discussion ... 91
3.2.3.1
Association of ibuprofen molecules by hydrogen bonding ... 91
3.2.3.2
Thermal Characterization ... 96
3.2.3.3
Dielectric characterization of the molecular mobility of ibuprofen ... 97
3.2.4
Conclusion ... 110
3.3
References ... 112
4-
MOLECULAR DYNAMICS IN CONFINED SPACE
4.1
E7 Confined in Untreated and Treated Anopore Membranes ... 119
4.1.1
Introduction ... 119
4.1.2
Experimental Conditions ... 119
4.1.3
Results and Discussion ... 120
4.1.4
Conclusions ... 130
4.2
E7 Confined to Molecular Sieves with a Low Filling Degree ... 132
4.2.1
Introduction ... 132
4.2.2
Experimental Conditions ... 132
4.2.3
Results and Discussion ... 134
4.2.4
Conclusions ... 146
4.3
Ibuprofen Confined to Molecular Sieves with Low Filling Degree ... 147
4.3.1
Introduction ... 147
4.3.2
Experimental Conditions ... 147
4.3.3
Results and Discussion ... 149
4.3.4
Conclusions ... 167
4.4
References ... 169
5-
CHANGES IN PLLA MOLECULAR MOBILITY UPON CONSTRAININGxviii
5.3.1
Dielectric Relaxation Spectroscopy ... 177
5.3.1.1
The
�
process ... 178
5.3.1.2
The
�
process ... 179
5.4
Isothermal crystallization at 353 K ... 180
5.5
Semi-crystalline state ... 184
5.6
Influence of crystallization at temperatures higher than 353 K ... 187
5.6.1
The
�
-Relaxation ... 188
5.6.2
The
�
-Relaxation ... 191
5.7
Discussion ... 193
5.7.1.1
The
α
��process ... 194
5.7.1.2
The
β
-relaxation ... 198
5.8
Conclusions ... 201
5.9
References ... 203
6-
CONCLUSIONSU
Conclusions
U... 205
A
NNEXES|
xix
C
HAPTER1
|
THEORETICAL ASPECTSFigure 1. 1- Viscosity temperature dependence and interruption of glass solidification. The properties of the glass below vitrification depend on the cooling rate near �� (redrawn from [24]). ... 4
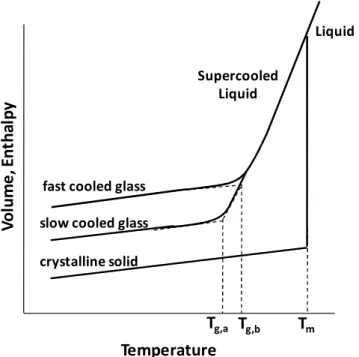
Figure 1. 2- Temperature dependence of a liquid's volume � or enthalpy � at constant pressure.
�� is the melting temperature. A slow cooling rate produces a glass transition at ��,�; a faster cooling
rate leads to a glass transition at ��,�.(redrawn from [28]). ... 5
Figure 1. 3- Diagram of time, temperature and transition which compares times from viscosity with times for a suitable crystallization rate. ... 6 Figure 1. 4- Schematic representation for the increasing cooperative region with decreasing � near the glass transition ... 12
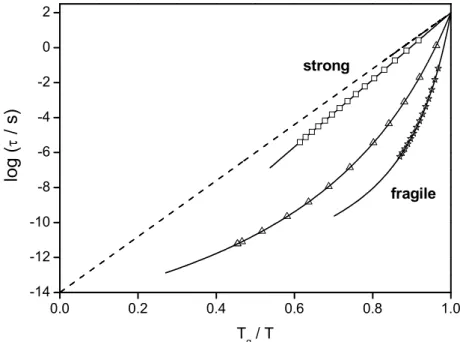
Figure 1. 5- Strong-fragile classification of glass-forming liquids according to their relaxation times versus reciprocal temperature scaled with ��(� = 100�). Near the limit of strong behavior is
depicted the ��-scaled plot of caffeine (squares) with � = 19. Glycerol (triangles) shows an
intermediate fragility with � = 53 [1]. Acetaminophen (stars) is presented as an example of a fragile
glass, � = 128... 13 Figure 1. 6- Two possible scenarios for the splitting of the � and � processes (redrawn from [45]). ... 18 Figure 1. 7- Schematic molecular pictures for the diffusive high temperature a process (cage escape), the diffusive low-temperature � process (cooperatively-assisted cage escape), and the finite �
process (adapted from ref.[55]). ... 19 Figure 1. 8- Glass Transition in confining geometries. Comparison of a given spherical volume
�� with increasing volume ��(�) of a cooperatively rearranging region CRR (redrawn from reference
[24]). ... 20 Figure 1. 9- Glass Transition in confining geometries. A- Comparison of traces of a hindered glass transition in a pore and a non-confined glass transition in bulk; B- Hindered glass transition in as
series of pores. The arrow is directed towards smaller diameters and S is the crossover region;
C- Example of the relationship between the hindered glass transition and the � process modified by
the structure near the surface for strong interaction between surface and glass former (redrawn from
reference [24]). ... 21 Figure 1. 10- A schematic dielectric loss curve. ... 30 Figure 1. 11- A dielectric permittivity spectrum over a wide range of frequencies. ε′ and ε″ denote the real and the imaginary part of the permittivity, respectively. Various processes are labeled
xx
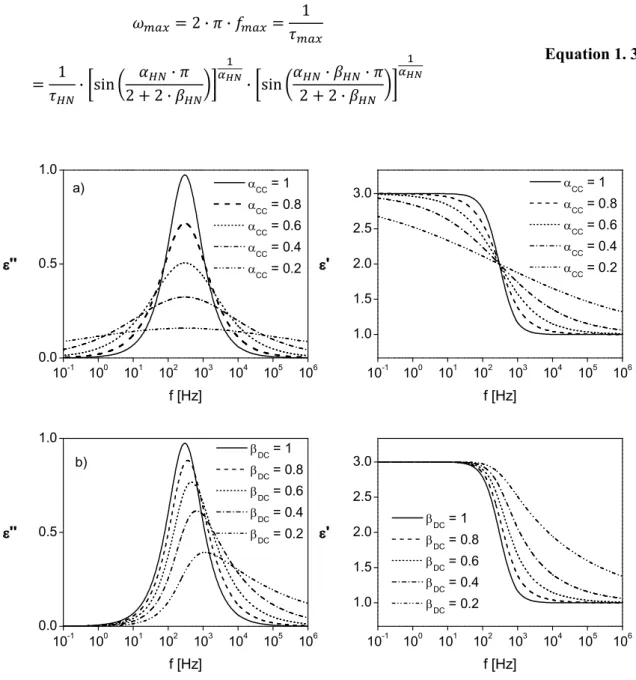
process. The half-height width of �′′(��� �) can be shown to be 1.14 (�� = 3, �∞= 1,
� = 300 ��). ... 35 Figure 1. 13- Complex dielectric permittivity for the a) Cole/Cole and b) Davidson/Cole functions (�� = 2, �∞= 1, � = 300 ��). ... 37 Figure 1. 14- Real part �′ (open circles) and imaginary part �′′ (open squares) of complex dielectric function for PVAc at T= 373 K. The strong increase of �′ at low frequencies is due to
electrode polarization. ... 42 Figure 1. 15-Possible relaxation modes for a mesogenic unit in a uniaxial nematic phase depending on its orientation with regard to an outer electric field (reproduced from ref [248]). ... 43
C
HAPTER2
|
EXPERIMENTALFigure 2. 1- Circuit diagrams for a material exhibiting: a) a relaxation process with a single relaxation time and induced polarization, b) a relaxation process with a single relaxation time,
conduction and induced polarization and c) a distribution of relaxation times and induced polarization.
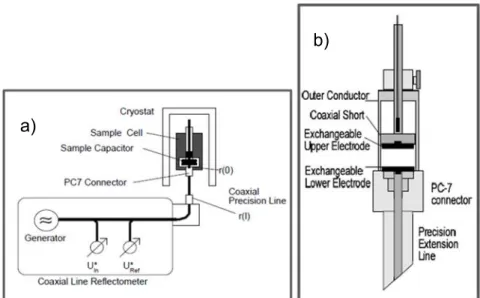
... 58 Figure 2. 2- Principle of the impedance measurement ... 60 Figure 2. 3- a) Dielectric measurement using coaxial line reflectometry between 1MHz – 10GHz; b) RF sample cell (reproduced from reference [9]). ... 62 Figure 2. 4- Structures of the components of the nematic liquid crystal E7 used in this work. ... 67 Figure 2. 5- DSC heating curves for �7 bulk liquid crystal, obtained at a rate of 5 K⋅min-1. Data published in reference [18] ... 67 Figure 2. 6- Chemical structure of Ibuprofen molecule; �∗ is a chiral carbon atom. ... 68 Figure 2. 7- PLLA constitutive units ... 69 Figure 2. 8- Anodisc pore structure [reproduced from [25]) ... 70 Figure 2. 9- TEM pictures for the MCM-41 material with pore diameter of 3.6 nm (A) and 4.1 nm (B) and the SBA-15 material with a pore diameter of 6.8 nm (C). ... 71 Figure 2. 10- Powder XRD patterns for different studied molecular sieves. ... 72 Figure 2. 11- Chemical structure of L-�-lecithin ... 73
C
HAPTER3
|
MOLECULAR MOBILITYxxi
Figure 3. 2- Temperature dependence of a) the real (ε’) part of the dielectric function at fixed frequencies - � = 1 ×10³ Hz, - � = 1 × 10⁴Hz, - � = 1 × 10⁵Hz, - � = 1 × 10�Hz showing
the differences between glass transition (��) and nematic to isotropic transition (���). The step
decrease of ε’ stands clear for the ���; b) the real (ε’) and imaginary (ε’’) part of the dielectric function at � = 1 × 10�Hz. The relaxation processes observed on the supercooled nematic liquid phase are
identified by the ε’’ peaks and the corresponding ε’ steps. ... 81 Figure 3. 3- Dielectric loss versus frequency and temperature for an unaligned sample of �7 in a) high frequency range; b) low frequency range. ... 82 Figure 3. 4- Dielectric loss vs. frequency for �7 at different temperatures and mesophases. Nematic State: - � = 216.2 K, Ο - � = 222.2 K, - � = 252.2 K, ∆ - � = 274.2 K. Isotropic state:
☆ - � = 363.7 K. Lines are guides to the eyes. Because the dielectric properties in the low and in the
high frequency range are measured using different samples their order parameter can be also slightly
different. ... 83 Figure 3. 5- Example of the decomposition of the relaxation spectra at T=233.2 K into the δ- relaxation and the tumbling mode by fitting three HN-functions and one conductivity contribution
to the data: solid line – whole fit function; dashed line – contribution δ-relaxation; dashed–dotted line - contribution tumbling-relaxation; dotted line – contribution third relaxation process. ... 84 Figure 3. 6- Relaxation times, ����, versus inverse temperature obtained by dielectric spectroscopy for the different processes (- δ-relaxation; - tumbling mode, - isotropic state) and specific heat spectroscopy (☆). The inset compares the temperature dependence of the relaxation
times of the δ process reported here () with data taken from ref. [2] (). Note also that the relaxation times measured for both samples with the different orientation collapses into one chart with regard to
its absolute values and its temperature dependence for both the δ- and the tumbling mode. ... 85 Figure 3. 7-
�� log(1 �
⁄
���) ��
⁄ �
�� �⁄ versus temperature for dielectric spectroscopy for the different processes ( - δ-relaxation; - tumbling mode) and specific heat spectroscopy (). The lines are linear regressions to the dielectric data for the different processes. The inset shows�� log(1 �
⁄
���) ��
⁄ �
�� �⁄ versus temperature for the dielectric data in the isotropic range attemperature above the phase transition. The line is a linear regression to the data. ... 86 Figure 3. 8- a) Dielectric strength ∆εδ in logarithmic scale of the δ-relaxation versus reciprocal temperature: - parallel oriented sample; - perpendicular oriented sample at low frequencies; -
perpendicular oriented sample at high frequencies. ☆ - isotropic state. Lines are guides for the eyes. b)
Dielectric strength ∆ε�������� of the tumbling-relaxation vs. reciprocal temperature: - parallel
oriented sample; - perpendicular oriented sample at low frequencies, - perpendicular oriented
xxii
dissolved in methanol with a concentration of around 4-5 × 10 mol/l. Ibuprofen as received – bottomchromatogram; Ibuprofen recrystallized from the melt after annealed at 353 K for 1 hour- top
chromatogram. ... 91 Figure 3. 10- ESI mass spectra, relative intensity (% of spectral intensity with respect to the most intense peak - the deprotonated molecular ion, [Ibu−H]−
) vs.�/� of Ibuprofen in methanol solution,
obtained in the negative ionization mode with cone voltages of (a) -20V and (b) -40V. The peaks of
interest are: [Ibu−H]−
, �/� = 205; [2Ibu−H]−, �/� = 411; [2Ibu−2H+Na]−, �/� = 433 and
[3Ibu−2H+Na]− , �/�= 639. ... 92
Figure 3. 11- Infrared spectra of crystalline (solid line) and supercooled liquid (dashed line) Ibuprofen at room temperature. The frequencies of the free O-H and C=O stretching vibrations are
indicated by arrows, the respective absorption intensities are low in both spectra showing that the
ibuprofen molecules form almost hydrogen bonding aggregates... 93 Figure 3. 12- Snapshot of possible hydrogen bonded aggregates of ibuprofen molecules obtained from MD simulations: linear dimer (a), cyclic dimer (b), linear trimer (c) and cyclic trimer (d). ... 94 Figure 3. 13- Fraction of ibuprofen inter-molecular hydrogen bonded structures (n-mers) as function of the number of molecules n involved in the different multimers as obtained from MD
simulation for � = 360 K. See Figure 3. 12 for snapshots of some examples of hydrogen bonded
aggregates. ... 95 Figure 3. 14- DSC thermograms of ibuprofen obtained during heating/cooling with 5 K/min. ... 97 Figure 3. 15- Temperature dependence of the real, ε′ (circles) and imaginary, ε′′ (triangles) part of the complex dielectric function for a frequency � = 10� Hz. a) Run 1: DRS result obtained on
heating at 1 K/min of a compressed disk of the as received crystalline ibuprofen. The observed step increase of ε′ (gray filled circles) is the melting transition, however cannot be taken quantitatively since thickness changes occurred; b) Run 2: DRS result recorded on cooling with 10K/min, after
annealing at 353 K for 1 h, evidencing the bypass of crystallization and further occurrence of glass transition. The ε′ scale is only valid for run 2 (see text for details)... 98 Figure 3. 16- Log-log plot of the real part, �’(ω), of the conductivity of liquid and supercooled liquid ibuprofen versus frequency, in the temperature range from 277 K (closed circles) up to
353 K (closed stars). It exhibits the typical behaviour for ionically conducting systems: the plateau
region at low frequencies corresponds to pure dc conductivity, ���, that increases with temperature,
while at higher frequencies after bending is due to ac conductivity ... 99 Figure 3. 17- (a) Dielectric loss versus frequency in the glassy state, in steps of 4 K from T = 143 K to T = 175 K. (b) Dielectric loss versus frequency from 191 K to T = 229 K in steps of 2 K.
Filled black circles are due to the detected � process in the glassy state, whose relaxation rate follows
an Arrhenius temperature dependence (Table 3. 4). Filled diamonds represent the isothermal data
xxiii
Figure 3. 18- Four examples of the fitting procedure where an additive contribution of three HN-functions is assumed: both the real (filled circles) and the imaginary (open circles) part of complex
permittivity were included at (a) 213 K, (b) 233 K, (c) 243 K and (d) 273 K. The solid lines represent
the overall fit and the dashed lines the individual HN-functions. ... 101 Figure 3. 19- Normalized dielectric loss curves (open circles) in the frequency domain 10-1−106 Hz, illustrating the invariant shape of the α-relaxation. The solid line represents the individual HN function used to fit the α process with ���= 0.81 and ��� = 0.56. The non-superposition between experimental data and the fitting curve in both low and high frequency sides is due to the overlapping
of the indicated processes. The dashed line is the corresponding fit of the one-sided Fourier transform
of the KWW function with ����= 0.52. ... 102 Figure 3. 20- . Dielectric strength, ∆ε, for the α,β,γ and � process versus 1/ �. The inset enlarges ∆ε vs. 1/ � plot for the �-process. ... 103 Figure 3. 21- Relaxation time, τ���, versus 1/ � for all processes: Open symbols - isothermal loss data collected during cooling; Gray filled symbols - � obtained from the isochronal plots for all
studied frequencies � ( � = 1/(2��), 1/����). The γ process runs out from the low-frequency
window at ~193 K becoming again detectable in the high frequency range where measurements were
only performed for temperatures above 243 K (reason for the gap of data close to ��). Lines are fits of
the Arrhenius and VFTH formulas to the corresponding data: in the α, � trace the solid line is the VFTH1 fit and the dashed line is the VFTH2 fit to the data (see text and parameters in Table 3. 4 and
Table 3. 5). Light gray stars indicate the JG relaxation time, τ��, estimated from Coupling Model (Equation 1.40 in Chapter I). Vertical dashed lines are the dielectric glass transition temperature
� �����(τ = 100 �) = 226 K and ��= 347 K. ... 105 Figure 3. 22- a)
�� log(1 �
⁄
���) ��
⁄ �
�� �⁄ vs. temperature for the relaxation time of the α, � (circles) and the Debye (triangles) processes. The dash-dotted line is a linear regression to thelow-temperature α- relaxation data where VFTH1 regime holds with a Vogel temperature ��,�, while the dashed line is the linear fit to the high temperature data characterized by VFTH2 with ��,�. The
intersection of the two lines defines the crossover temperature �� = 265 K. The solid line is the linear
fit to the Debye data characterized by a VFTH law with ��,�. b) Temperature dependence of the α -relaxation dielectric strength, ∆��. Lines are guides for the eyes. The arrow indicates a crossover
temperature separating the high and low temperature region in agreement with the �� value calculated
from the intersection of the VFTH1 and VFTH2 law. The inset gives ∆�� versus -���(τ���). The intersection of the two temperatures regimes is indicated by the arrow which gives a relaxation time
xxiv
IN CONFINED SPACE Figure 4. 1- Isothermal dielectric loss spectra for an unaligned sample of �7 confined in untreated Anopore over all the frequency range studied and cover both nematic and isotropic states.
Lines are guides to the eyes... 120 Figure 4. 2- Dielectric loss versus frequency and temperature for �7 confined in a lecithin treated Anopore membrane a) in the low frequency range and b) in the high frequency range. ... 121 Figure 4. 3- Dielectric loss versus frequency at T=227 K for �7 in the bulk (), confined to untreated () and lecithin treated () Anopore membrane. For each sample the dielectric loss is
normalized to its maximum value. Lines are guide to the eyes... 122 Figure 4. 4- Schematic picture of the �7 molecular arrangement in a lecithin treated pore; molecules adopt preferentially a radial orientation assuming a tail-to-tail conformation with the
hydrophobic lecithin moiety... 123 Figure 4. 5- Dielectric loss versus frequency at T=229 K for �7 confined in lecithin treated Anopore. The solid line is a fit of a sum of three HN-function to the experimental data. The other lines
give the contributions of the individual processes to the dielectric loss: dashed-dotted-dotted: slow
process; dashed: �-relaxation; short dashed: �-relaxation ... 123 Figure 4. 6- Relaxation times ���� versus1/ � for the different processes for �7 embedded in different pores. The solid symbols correspond to confined �7 where the open ones are data for the
bulk: Triangles- �-relaxation; circles - �-relaxation; squares – slow process; diamonds- surface
process. The lines are fits of the VFT-equation to the data as described in the text. ... 124
Figure 4. 7-
�� log(1 �
⁄
���) ��
⁄ �
�� �⁄ versus temperature for the a) � process: - Bulk; -untreated pores; ∆ - lecithin treated pores. Lines are linear regressions to the data: dashed –untreated; solid – bulk and treated; b) � process: - Bulk; -untreated pores; - lecithin treated
pores. Lines are linear regressions to the data: dashed line – bulk; dashed doted – untreated; solid line
– treated. ... 126 Figure 4. 8- ∆ε normalized to the pore fraction versus inverse temperature for temperatures higher than TN/I.: - Bulk; -untreated pores; - lecithin treated pores. Lines are guides for the eyes. The dashed dotted line indicates the increase of ∆ε at lower temperatures for �7 confined to
untreated pores. ... 127 Figure 4. 9- Relaxation times, ����, versus 1/� for the surface process: - lecithin layer; -
�7 in lecithin coated pores; - �7 in native pores. Lines are fits of the Arrhenius equation to the data. The inset gives the dielectric loss versus frequency at � = 303 K for an empty Anopore membrane
(), pores coated with a lecithin layer () and �7 in lecithin treated pores (). Lines are guides for
xxv
to the data. The regression coefficient is �=0.996; b) FTIR spectrum for the ��-stretching vibration (Ο) of �7 confined to the molecular sieve MCM-41-36. The solid line is a fit of two Gaussians to the data. The dashed line represents the bulk-like contribution were the dashed dotted line gives thecontribution of the molecules interacting with the surface of the pores The regression coefficient is
� = 0.998. ... 134 Figure 4. 12- Interaction parameter �versus the BET area: - MCM-41; - SBA-15. The line is a guide for the eyes. The inset gives � versus pore size: - MCM-41; - SBA-15. The line is a
guide for the eyes. ... 135 Figure 4. 13- Dielectric loss of �7 versus temperature at a frequency of 1 kHz confined to the molecular sieve MCM-41-28 during cooling () in comparison to the bulk (☆). The dielectric loss of
bulk �7 was scaled in order to match the values of the confined material. The inset gives the dielectric
loss vs. temperature at a frequency of 1 kHz for �7 confined to the molecular sieve MCM-41-28 during heating (Ο) and cooling (). ... 137 Figure 4. 14- Dielectric loss of �7 versus frequency for different temperatures confined to the
molecular sieve MCM-41-36: Ο - T=295.2 K; - 315.2 K; - 335.2 K; - 373.2 K; ☆ - 413.2 K. The lines are guides to the eyes... 138
Figure 4. 15- a) Dielectric loss for the sample �7/MCM-41-41 at a temperature of T=257.2 K. The solid line is the overall fit function. The dashed line is the contribution of the �- and the dashed
dotted line that of the � process; b) Dielectric loss for the sample �7/SBA-15 at a temperature of
T=243.2 K. The solid line is the overall fit function: dotted line – contribution � process; dashed line
contribution � process; dashed –dotted line – bulk like � process; dashed-dotted-dotted line – bulk like
tumbling mode. ... 139 Figure 4. 16- Relaxation time ����vs. 1/� for �7 embedded in the molecular sieve MCM-41-28 (sample �7/MCM-41-28) in comparison to the bulk: Ο - tumbling mode bulk; - �- relaxation bulk;
☆ - relaxation process isotropic phase bulk; - bulk-like tumbling mode; - bulk-like �- relaxation;
- bulk-like relaxation process in the isotropic phase; - � process; - � process. The lines are
guides for the eyes. ... 140 Figure 4. 17- Comparison of the temperature dependence relaxation times of the bulk-like processes with that of the bulk: Ο -bulk; - �7/SBA-15; - �7/MCM-41-28. Lines are guides for the eyes. Especially for small pore sizes the dielectric strength of the tumbling mode is small. This
means the estimation of the relaxation bears some uncertainties. The error bars to the tumbling mode
of �7/MCM-41-28 might be some estimates for these uncertainties. ... 141
Figure 4. 18-
�� log(1 �
⁄
���) ��
⁄ �
�� �⁄ vs. temperature for the samples �7/MCM-41-28 () and �7/SBA-15 (). The lines are linear regressions to the corresponding data. The inset comparisonxxvi
the data. ... 142 Figure 4. 19- �� for the surface process versus pore size for �7 confined to the described hosts (). The line is a linear regression to the data. The dotted line is a guide for the eyes. ☆ - are data for8CB confined to the pores of Al-MCM [29]. The solid line is a guide for the eyes. The inset gives the
fragility �versus pore size for E7 confined to the described hosts. The line is a guide for the eyes. 143
Figure 4. 20- Dielectric strength of the surface layer Δε versus inverse temperature: - �7/MCM-41-28; Ο - �7/MCM-41-41. ... 144
Figure 4. 21- Comparison of the temperature dependence relaxation times for the � process: - �7/MCM-41-28; - �7/MCM-41-36; ☆ - �7/MCM-41-41; - �7/SBA-15. - are the
relaxation time of 5�� adsorbed in a monolayer at the outer surface of silica particles [19]. The line is
a fit of the VFT equation to the latter data. The inset compares the temperature dependence of
relaxation times of the � process shifted in the direction of the � − ����� to mach the data of 5��. The
symbols are the same than in the main figure. ... 145 Figure 4. 22- TG curves for: a) Ibu/SBA-15; b) bulk Ibuprofen and c) empty SBA-15. The arrow indicates the temperature after which the Ibuprofen mass loss was considered for the filling degree
calculation. ... 148 Figure 4. 23- Infrared spectra of (1)-Ibu/SBA-15, (2)-Ibu/MCM-41, (3)-crystalline Ibuprofen and (4)- empty MCM-41 at room temperature, in the frequency region of a) free O-H stretching (~3520
cm-1) and b) free C=O vibrations (~1760 cm-1). The ATR-FTIR spectra were vertically shifted for sake
of clarity. ... 150 Figure 4. 24- Temperature dependence of the real part of the complex dielectric function, ε′, for a frequency of 105 Hz. In the lower part (circles): Run 1-heating of Ibu/SBA-15 sample (there is no
evidence of melting) from 153 to 373 K (light gray circles); Run 2- Subsequent cooling of the
confined sample (open circles). For comparison purposes in the upper part (triangles) is shown data for
the as received crystal obtained on heating; ��= 347 K is the extrapolated onset melting temperature.
... 151 Figure 4. 25- Isochronal curves of �´-a) and �′′-b) taken from the isothermal data at 103 Hz for Ibu/MCM-41 (ethanol solution)-open symbols and Ibu/MCM-41 (hexane solution)- light gray full
symbols. Comparison between the heating (squares) and subsequent cooling (down triangles) is given.
The dashed line indicates the temperature position of the detected peaks and the solid line gives an
indication of the temperature where water release is observed. ... 152
Figure 4. 26- (a) Dielectric loss versus frequency for Ibu/MCM-41 at - � = 159 K, Ο- � = 183 K and - � = 203 K; (b) Dielectric loss versus frequency for Ibu/MCM-41 at - � =
xxvii
the MCM-41 and SBA-15 molecular sieves during cooling in comparison to the bulk. ... 154 Figure 4. 28- Four examples of the fitting procedure for Ibu/SBA-15 where an additive contribution of three HN-functions is assumed at a) 219 K, (b) 243 K, (c) 253 K and (d) 287 K. Thesolid lines represent the overall fit and the dashed lines the individual HN-functions. ... 155 Figure 4. 29- Dielectric strength, ∆ε, for the γ (circles), � (losanges), processes I (squares), II (triangles) and III (down triangles) versus 1/T for Ibu/MCM-41. The inset shows ε vs. 1/T plot for
the Ibu/SBA-15. ... 156 Figure 4. 30- The upper part shows the top view of a simulation cell obtained by MD simulations of ibuprofen confined in a completely filled cylindrical pore of 3.6 nm diameter that mimics MCM-41
mesoporous materials (courtesy of F. Affouard, LDSMM, Univ. Lille); The lower part represents a
zoom of the simulation cell illustrating the interaction of ibuprofen group carboxylic with the silanol
groups through: (a) one hydrogen bond and (b) two hydrogen bonds identified by the white arrows.157 Figure 4. 31- Relaxation time, ����, versus 1/� for all processes: Open symbols – bulk isothermal loss data collected during cooling; Gray filled symbols - � obtained from isothermal loss
data collected during cooling for the confined samples: a) Ibu/MCM-41, b) Ibu/SBA-15; Asterisks - �
obtained from the isochronal plots for all studied frequencies
� ( � = 1/(2��), 1/����). Lines are fits of the Arrhenius and VFTH formulas to the corresponding
data. Light gray stars indicate the JG relaxation time, τ��, estimated from Coupling Model (Equation 1.40 in Chapter I) for the bulk Ibuprofen. Vertical dashed lines are the dielectric bulk glass transition
temperature ������ (τ = 100 �) = 226 K and the bulk crystal melting temperature �� = 347 K. The
dielectric strength of � and � processes is small. This means the estimation of the relaxation bears
some uncertainties. The error bars in these relaxations might be some estimates for these uncertainties.
... 159 Figure 4. 32- Comparison of the temperature dependence relaxation times of the � processes for both 3.6 and 6.8 nm pores with that of the bulk: -bulk; gray filled - Ibu/MCM-41; gray filled Ο -
Ibu/SBA-15. Lines are fits of the Arrhenius and VFTH formulas to the corresponding data. ... 161 Figure 4. 33- Glass transition temperature determined from the DRS results versus pore diameter for Ibuprofen in 3.6 and 6.8 nm pores. The � �value for bulk liquid ibuprofen is also included
(1/ � = 0). The solid line is a linear regression to the data (�� = 0.98). ... 163 Figure 4. 34- Comparison of the temperature dependence relaxation times for the S process: gray filled -Ibu/MCM-41; gray filled Ο - Ibu/SBA-15. The lines are fits of the VFT-equation to the data.
The inset gives
�� log(1 �
⁄
���) ��
⁄ �
�� �⁄ vs. temperature for the samples:gray filled - Ibu/MCM-41; gray filled Ο -Ibu�7/SBA-15. The lines are linear regressions to the
corresponding data. ... 164
xxviii
the 3.6 and 6.8 nm pores with that of the bulk: gray filled - Ibu/MCM-41; gray filled Ο -Ibu/SBA-15 and - bulk. Full symbols - � obtained from the isochronal plots for all studied frequencies
� ( � = 1/(2��), 1/����). The lines are fits of the VFT equation to the bulk data. ... 166
C
HAPTER5
|
CHANGES IN PLLA MOLECULAR MOBILITY
UPON
C
ONSTRAINING Figure 5. 1- Dielectric loss spectra for amorphous PLLA between 341 K and 357 K in steps of 2 K. ... 177Figure 5. 2- Dielectric loss spectra of the secondary relaxation process detected in the amorphous PLLA sample, within the temperature range from 153 K to 298 K, in steps of 5 K. ... 177
Figure 5. 3- Master curve constructed for amorphous PLLA narrow temperature range (see legend indicated in the figure). ... 178
Figure 5. 4- Relaxation map for amorphous PLLA. The solid lines are fits of the VFT-equation and Arrhenius-equation to the data. ... 179
Figure 5. 5- Dielectric loss spectra (circles) at 353 K during a) cold crystallization and b) melt crystallization. The solid lines are the fitting obtained using the sum of three Havriliak-Negami (HN)
functions. Only the loss curves collected each 10 minutes are shown for the first 4 hours, and the last
two curves were collected at, respectively, 5 and 6 hours. The inset graphics shows the experimental
results at 160 minutes (squares for ��� and circles for ���) and the corresponding fitting taking into
account three HN individual curves (solid lines). ... 181 Figure 5. 6- Evolution of the dielectric strength during PLLA cold crystallization and melt crystallization of the three relaxations detected: a) �-relaxation for the nearly amorphous phase (���),
()- cold crystallization and (Ο)- melt crystallization; �-relaxation for the semi-crystalline phase
(���), ()-cold crystallization and ()-melt crystallization; b) �-relaxation, ()- cold crystallization
and ()-melt crystallization. Results for a lower molecular weight PLLA, PLLA86kD, during cold
crystallization were included as solids lines for comparison. Dielectric strength values were
normalized by the maximum value obtained for the nearly amorphous � process. ... 182 Figure 5. 7- a) Isothermal dielectric loss spectra for the constrained � process detected after cold crystallizationwithin the temperature range from 298 K to 413 K; b) Isothermal loss spectrum at 353
K and the two individual contributions of the α�� and β process. ... 184 Figure 5. 8- Temperature dependence of � �� shape parameter (circles) and dielectric strength, ∆ε, (squares) estimated through fitting for the a) �-relaxation and the b) constrained � process
![Figure 1. 3- Diagram of time, temperature and transition which compares times from viscosity with times for a suitable crystallization rate (redrawn from[38])](https://thumb-eu.123doks.com/thumbv2/123dok_br/16475273.731988/50.892.276.673.611.926/figure-diagram-temperature-transition-compares-viscosity-suitable-crystallization.webp)
![Figure 1. 4- Schematic representation for the increasing cooperative region with decreasing � near the glass transition (reproduced from ref [61])](https://thumb-eu.123doks.com/thumbv2/123dok_br/16475273.731988/56.892.331.648.362.660/figure-schematic-representation-increasing-cooperative-decreasing-transition-reproduced.webp)
![Figure 1. 6- Two possible scenarios for the splitting of the � and � processes (redrawn from [47])](https://thumb-eu.123doks.com/thumbv2/123dok_br/16475273.731988/62.892.218.729.561.845/figure-possible-scenarios-splitting-processes-redrawn.webp)
![Figure 1. 7- Schematic molecular pictures for the diffusive high temperature a process (cage escape), the diffusive low-temperature � process (cooperatively-assisted cage escape), and the finite � process (adapted from ref.[59]](https://thumb-eu.123doks.com/thumbv2/123dok_br/16475273.731988/63.892.279.671.320.612/schematic-molecular-pictures-diffusive-temperature-diffusive-temperature-cooperatively.webp)