Acknowledgments
To my supervisors, José Teixeira and Guillermo Velo-Antón, for the support during this work.
To Biodeserts team members, for all the help and advice given during all this time, a especial thank you to José Carlos Brito for all the help during my learning.
To the Masterss for all the help and funny moments that we shared during this journey. To my family for being there all the time.
To Joana, for being Joana.
To my friends that helped alot during this process
This work was partially financed by the LIFE project LIFE+ Trachemys (LIFE09 NAT/ES/000529).
The complex paleogeographic history of the Mediterranean Basin allowed for high levels of biodiversity in the region. In fact, several endemism occur in the area, granting the Mediterranean Basin the status of hotspot for biodiversity. For example, events such as the Messinian Salinity Crisis, that lead to the partial dissecation of the Mediterranean Sea, which in turn allowed for species to cross between Europe and Africa; and the Glacial-Interglacial cycles that promoted range shifts in several temperate species while tracking for suitable habitat, promoted in one hand vicariance events between several species, while in the other hand allowed for secondary contact zones to occur after species expanded from their glacial refugias during climate amelioration. Furthermore, the role of the European Peninsulas and the Maghreb as refugia during glacial periods promoted allopatric diversification as different populations of a same species would sometimes take refuge in different glacial refugia therefore allowing for the diversification between them.
The European pond turtle, Emys orbicularis, alongside its sister taxa, Emys trinacris, are the only representatives of the Emys genus in the old world. Emys orbicularis occurs widely throughout Europe, with populations reaching Asia, and North-western part of Africa. Currently 9 distinct mitochondrial lineages have been found using the cytochrome
b gene. Nonetheless, across its entire range, demographical contractions have been
noticed and prompted several conservation measures.
One of the described lineages is native to the Ibero-Maghbreian region, and has been subject of a lot of interest due to its very complex biogeographical history. Two different patterns arise in light of different data. Fossil records seem to indicate a longer presence of Emys orbicularis in the Iberian Peninsula when compared to the Maghreb. However, in light of genetic data, the hypothesis of a colonization of the Iberian Peninsula from North Africa seems more likely.
With this work we aim to reinforce the current knowledge on the biogeographical history of the species and to assess the role of the past climatic oscillations, and more specifically, the role that range expansions and contractions that occurred during the Quaternary to the Holocene, had on the current pattern of genetic structure. To do so both slow and fast evolving markers were here used (cytochrome b and microsatellites respectively) in an attempt to understand the directionality of the expansion and its consequences at the level of the genetic structure.
allowed for the first time the detection of African haplotypes in the Iberian Peninsula, also the fact that North African populations show higher levels of genetic structure and diversity lead to a further support of North Africa as the origin for the Ibero-Maghrebian lineage. As for the role that range expansions had in shaping the current patterns of genetic diversity and structure, we found strong signs of allelic frequency clines alongside the axis of expansion, and a strong decrease in genetic diversity. Furthermore, the strong genetic structure present in the Northwest of the Iberian Peninsula seems to be concordant with known consequences of range expansions.
Overall, this study allowed for the first time a complete survey of the effects that the range expansions from southern refugia had in the Iberian Peninsula. Furthermore, the collected genetic data permitted us to improve a tool for the genetic allocation of individuals of unknown origin to a probable putative population of origin.
Keywords: Emys orbicularis, range expansions, phylogeography, historical
Resumo
A complexa história paleogeográfica da Bacia do Mediterrâneo possibilitou a existência de níveis elevados de biodiversidade na região. De facto, a Bacia do Mediterrâneo é hoje considerada como um hotspot de biodiversidade devido em parte ao vasto número de endemismos que ocorrem na área. Por exemplo, eventos como a Crise Salina do Messiniano, que levou à dissecação parcial do Mar Mediterrânico, mas que em contrapartida permitiu a passagem de espécies entre a Europa e África; e os ciclos Glaciares-Interglaciares que promoveram alterações na distribuição de várias espécies de zonas temperadas que procuravam habitat adequado, promovam por um lado eventos de vicariância entre várias espécies, e, por outro lado, possibilitaram a ocorrência de zonas de contacto secundário após a expansão das espécies dos seus refúgios aquando o clima melhorou. Mais ainda, o papel desempenhado pelas Penínsulas Europeias e o Magreb como refugia glaciar, promoveu divergência alopátrica entre espécies, uma vez que populações distintas de uma mesma espécie poderiam refugiar-se em diferentes refúgios promovendo divergência entre as mesmas.
O cágado-de-carapaça-estriada, Emys orbicularis, em conjunto com a sua espécie irmã, Emys trinacris, são os únicos representantes do género Emys no mundo velho.
Emys orbicularis, ocorre amplamente na Europa, com algumas populações a chegarem à
Asia, e em parte do noroeste africano. Contudo, em toda a sua distribuição, contrações demográficas foram detetadas, levando à criação de várias medidas de conservação.
Uma das linhagens descritas é nativa da região Ibero-Magrebiana, e tem sido alvo de elevada atenção devido a sua complexa história biogeográfica. Consoante os dados observados, dois diferentes padrões surgem nesta região, pois, se considerarmos o registo fóssil, E. orbicularis apresenta estar presente na Península Ibérica à mais tempo que no Norte de África. No entanto, geneticamente esta linhagem apresenta ter a sua origem no Norte de África.
O nosso objetivo com este trabalho é o de reforçar o conhecimento atual sobre a biogeografia da espécie e discernir qual o papel das flutuações climáticas, e mais especificamente, o papel que os fenómenos de expansão e retração da distribuição das espécies que ocorreram entre o Quaternário e o Holoceno, tiveram nos padrões de estrutura genética que observamos hoje. Para tal, usamos tanto marcadores com elevadas como com baixas taxas de mutação (microssatélites e citocromo b,
consequências ao nível da estrutura genética.
A adição de 80 novas sequências ao já vasto dataset colhido para esta espécie, permitiu pela primeira vez detetar haplótipos Africanos na Península Ibérica, mais ainda, o facto de as populações do Norte de África apresentarem elevados níveis de diversidade e estrutura genética, permitem-nos inferir com mais certeza sobre a possibilidade de a linhagem Ibero-Magrebiana se ter originado no Norte de África. Qual o papel de expansões de distribuição, no moldar os padrões de diversidade e estrutura genética. Encontra-mos sinais de variação clinal na frequência alélicas ao longo do eixo de expansão e um forte decréscimo na diversidade genética, padrões congruentes com expansões de distribuição.
De forma geral, este estudo possibilitou pela primeira vez uma completa analise dos efeitos que as expansões tiveram na Península Ibérica. Mais ainda, a quantidade de dados genéticos colhidos neste trabalho, permitiu o melhoramento de uma ferramenta genética para a alocação de indivíduos de origem desconhecida a sua população.
Palavras chave: Emys orbicularis, expansões, filogeografia, biogeografia, conservação.
ACKNOWLEDGMENTS ... I
ABSTRACT... II
RESUMO ... IV
FIGURE INDEX ... IX
TABLE INDEX ... XIII
LIST OF ABBREVIATIONS ... XIV
CHAPTER 1: GENERAL INTRODUCTION ... 15
1.1CONSERVATION OF BIODIVERSITY ... 16
1.1.1 Why conserve biodiversity? ... 16
1.1.2 Freshwater biodiversity ... 17
1.1.3 Major threats to Freshwater Biodiversity ... 18
1.2TESTUDINES, THE EMYDIDAE FAMILY AND THE EMYS GENUS ... 18
1.2.1 Emys genus ... 19
1.2.2 Emys orbicularis distribution and threats ... 20
1.2.3 The complex biogeographical history of the European Pond Turtle ... 21
1.3PALEOGEOGRAPHY OF THE MEDITERRANEAN BASIN ... 22
1.3.1 The role of the Messinian Salinity Crisis ... 22
1.3.2 Climatic oscillations of the Pleistocene ... 23
1.4IMPACTS OF RANGE EXPANSION ON GENETIC PATTERNS ... 24
1.5OBJECTIVES ... 26
CHAPTER 2: MANUSCRIPT 1 ... 27
2.1ABSTRACT: ... 28
2.2INTRODUCTION ... 29
2.3MATERIAL AND METHODS ... 31
2.3.1 Sampling ... 31
2.3.2 Cyt-B amplification through PCR, sequencing and haplotype analysis ... 31
2.3.3 Microsatellites amplification ... 32
2.3.4 Genetic structure and diversity indexes ... 33
2.4.2 Microsatellites analysis ... 35
2.5DISCUSSION ... 36
2.5.1 Re-evaluating the role of North Africa as the source of the Iberian populations ... 36
2.5.2 Genetic relationships at both sides of the Gibraltar Strait ... 38
2.5.3 Genetic structure in Morocco ... 39
2.5.4 Conservation Implications ... 40
CHAPTER 3: MANUSCRIPT 2 ... 43
3.1INTRODUCTION ... 45
3.2MATERIAL AND METHODS ... 47
3.2.1 Sampling, DNA extraction and dataset preparation ... 47
3.2.2 Microsatellites amplification ... 48
3.2.3 Microsatellites data analysis ... 48
3.2.4 Spatial patterns of genetic diversity... 49
3.2.5 Allele frequency clines and trends of genetic diversity along the axis of colonization ... 50
3.3RESULTS ... 51
3.3.1 Microsatellites analysis ... 51
3.3.2 Allelic Frequency Clines ... 51
3.4DISCUSSION ... 55
3.4.1 Impacts of the range expansion in the genetic structure ... 55
3.4.2 Impacts of geographical barriers on the range expansion dynamics ... 56
3.4.3 The West Coast as a colonization route for the Northwestern populations ... 62
CHAPTER 4: MANUSCRIPT III ... 63
4.1ABSTRACT... 64
4.2INTRODUCTION ... 65
4.3MATERIAL AND METHODS ... 66
4.3.1 Sampling and lab procedures ... 66
4.3.2 Assignment tests ... 66
4.4RESULTS ... 67
4.4.1 Proportion of assignment of each putative population ... 67
4.5DISCUSSION ... 69
CHAPTER 5: FINAL REMARKS ... 74
CHAPTER 6: REFERENCES ... 77
Figure 1.1: Diagram representing the five major threats to freshwater biodiversity and
their possible interactions (in Dudgeon et al. 2006) ... 18
Figure 1.2: Global distribution of the genus Emys, in Spinks & Shaffer (2009). ... 19 Figure 1.3: Distribution range of Emys orbicularis. The Ibero-Maghrebian lineage is
here highlighted in brown. Adapted from Spinks & Shaffer (2009). ... 20
Figure 2.1: Top: Geographical distribution of the three main haplogroups found in the
study area, Red circles represent the Iberian haplogroup, which includes the haplotypes VIa, VIe, VIg, VIb, VIk, VIj and VId. Light green circles represent the haplogroup tightly linked with the Rif Mountain and comprises the haplogroups VIf, VIm, VIl, VIh, VIn and VIo. It is important to note that the last three haplotypes are either shared with the Iberian Peninsula or only have been found in there (case of VIo). Dark green circles correspond to the Atlas haplogroup comprising the haplotype Vic and VIi. Blue Circles indicate other lineages found in the study area. The current distribution of the subspecies is denoted in 10km by10 km squares marked in beige. Bottom: Haplotype network, in the left the complete haplotype network for the entire range of the species is shown the position of the lineage VI. On the right, the haplotype network for the lineage VI is shown. In this case red circles correspond to haplotypes found in the Iberian Peninsula, Light Green Circles, haplotypes found in the Rif Mountains and Dark Green haplotypes found in the Atlas Mountains. ... 34
Figure 2.2: Top: A spatial representation of the genetic structure found in Morocco for
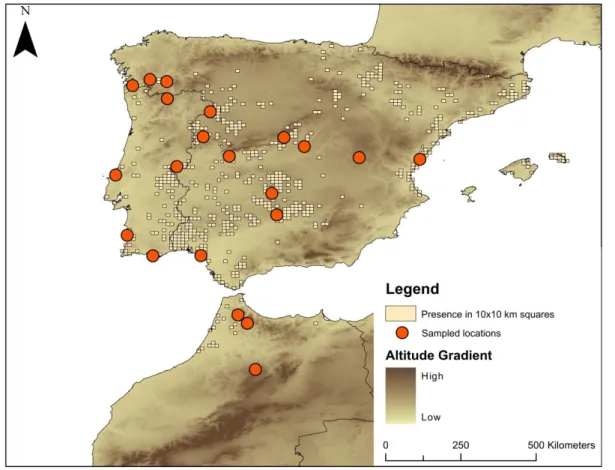
k=2. Each pie chart corresponds to a sampling location, identified by a number that corresponds to the population in the graphic below. Rivers are here represented as blue lines. Bottom: Structure output for k=2, each vertical bar corresponds to a individual, where the proportion of colours indicates its probability of assignment to the corresponding cluster. Black lines separate sampling locations. ... 37 Figure 3.1: Current distribution of the subspecies Emys orbicularis occidentalis (as denoted by the 10x10km squares in beige). The sampled locations are marked with red circles. ... 47
Figure 3.2: Decline of the genetic diversity alongside the south-north axis of
expansion. Red circles correspond to the mean heterozygosity retrieved at each window of the sliding window analysis. Red line represents the linear regression used to summarize the trend, and the two dotted lines correspond to the 95% confidence interval. ... 52
Top: A clear sign of allelic surfing, where an allele with very low frequencies at the core of
the expansion, presents very high frequencies at the edge of the expansion. Middle: A common pattern in several of our alleles, this allele hints for a possible role of a barrier to constrict the surfing of alleles in the wave front, it is worth mentioning that due to the rapid shifts in the allele frequencies, the resulting interpolations are very weak and present several artefacts. Bottom: With the increase of frequencies of surfing alleles. Several alleles have their allelic frequencies decaying throughout the expansion axis. The graphics on the right side were produced through the analysis of the allelic frequency with a sliding window. The interpolations on the left were based on the allele frequencies observed in each population. ... 54
Figure 3.4: Top: Spatial representation of the genetic structure found for the entire
distribution of Emys orbicularis occidentalis for k=2. Each pie chart corresponds to a sampling location, identified by a number that corresponds to the population in the structure graphic below. Bottom: Structure output for k=2, each horizontal line corresponds to a individual, where the proportion of the colours indicates its probability of assignment to the corresponding cluster. Black lines separate sampling locations. ... 57
Figure 3.5: Top: Spatial representation of the genetic structure found for the entire
distribution of Emys orbicularis occidentalis for k=6. Each pie chart corresponds to a sampling location, identified by a number that corresponds to the population in the structure graphic below. Bottom: Structure output for k=6, each horizontal line corresponds to a individual, where the proportion of the colours indicates its probability of assignment to the corresponding cluster. Black lines separate sampling locations. ... 58
Figure 3.6: Summary display of the sPCA; Top left: The resulting connection
networker after applying the Delaunay triangulation. This type of network was the only that could detect some type of connection between the Easter Iberian Coast and the South of the Iberian Peninsula; Top right: Spatial Interpolation of the scores of the first eigenvalue of the sPCA. The red lines denote regions of abrupt change in allelic frequencies; Middle
Left: Assignment of the populations to one of the two groups recovered by the method,
the method show a segregation between populations at North of the Central System to the others; Middle Right: A somewhat similar approach to the one in the left but in this case it uses the lagged scores to interpolate the assignment; Bottom Left: This graphic shows how much each eigenvector explains of the data. The eigenvector being observed in all previous graphics is underlined in black, while other selected eigenvectors for the sPCA are shown in light gray. Bottom Right: Decomposition of the eigenvalues in accordance in their spatial autocorrelation and Moran’s I. We can observe here that, by the fact that
infer global structure ... 59
Figure 3.7: Summary display of the sPCA; Top left: The resulting connection
networker after applying the Delaunay triangulation. This type of network was the only that could detect some type of connection between the Easter Iberian Coast and the South of the Iberian Peninsula; Top right: Spatial Interpolation of the scores of the second eigenvalue of the sPCA. The red lines denote regions of abrupt change in allelic frequencies; Middle Left: Assignment of the populations to one of the two groups recovered by the method, the division between a group in the Western Coast from other populations might be indicative of a possible colonization route; Middle Right: A somewhat similar approach to the one in the left but in this case it uses the lagged scores to interpolate the assignment; Bottom Left: This graphic shows how much each eigenvector explains of the data. The eigenvector being observed in all previous graphics is underlined in black, while other selected eigenvectors for the sPCA are shown in light gray. Bottom Right: Decomposition of the eigenvalues in accordance in their spatial autocorrelation and Moran’s I. We can observe here that, by the fact that components one and two are isolated from other eigenvalues, they are good predictors to infer global structure. ... 60
Figure 3.8: First component of the PCA of genetic distances. A strong relationship is
found between the western Coast and the Southwestern Peninsula. ... 61 Figure 4.1: Top: Spatial representation of the genetic structure found for the entire distribution of Emys orbicularis occidentalis for k=16. Each pie chart corresponds to a sampling location, identified by a number that corresponds to the population in the structure graphic below. Bottom: Structure output for k=16, each horizontal line corresponds to a individual, where the proportion of the colours indicates its probability of assignment to the corresponding cluster. Black lines separate sampling locations. ... 68
Figure 7.1: Graphical output of the Structure Harvester results for Delta K and L(k); Top: Results for the dataset used in Chapter 2; Bottom: Results for the dataset used in
Chapters 3 and 4. ... 112
Figure 7.2: Allelic patterns of all alleles showing signs of allelic frequency clines. .... 119 Figure 7.3: Allelic patterns of all alleles showing signs of allelic frequency clines. .... 120 Figure 7.4: Allelic patterns of all alleles showing signs of allelic frequency clines. .... 121 Figure 7.5: Allelic patterns of all alleles showing signs of allelic frequency clines. .... 122 Figure 7.6: Allelic patterns of all alleles showing signs of allelic frequency clines. .... 123 Figure 7.7: Most important alleles contributing to the patterns observed in the first
Table 2.1: Summary table of diversity indices for both complete and partial dataset. n:
number of samples per population; HO: observed heterozygosity; HE: expected
heterozygosity; PA: private alleles; MNA: Mean Number of Alleles. ... 36
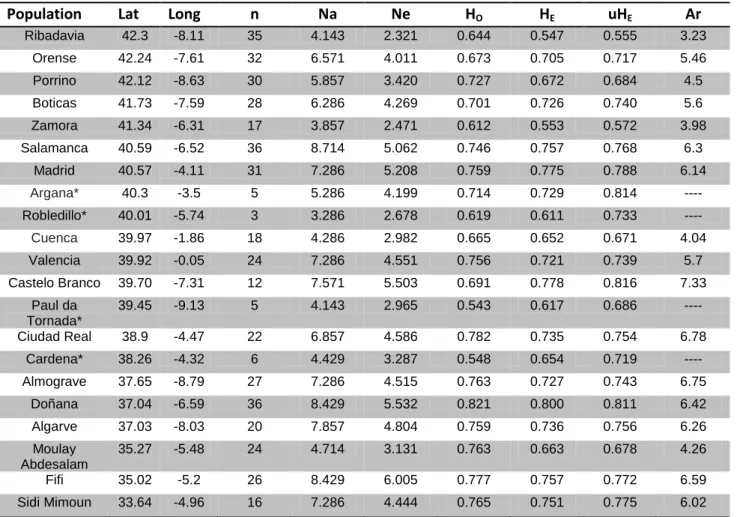
Table 3.1: A summary of the genetic diversity indices calculated for Emys orbicularis occidentalis populations. Lat: Latitude; Long: Longitude; n: number of samples for that
location; Na: Number of alleles; Ne: Number of effective alleles; HO: Observed
heterozygosity; HE: Expected heterozygosity; uHE: unbiased expected heterozygosity; Ar:
Allelic Richness. Populations with less than 10 samples, marked with *, were not used when calculating the Allelic Richness, and were not considerated for any populational inference. ... 52
Table 4.1: Proportion of membership of each putative population in each of the 16
clusters. Populations that failed to reach at least 0.5 of proportion of membership are marked with a *. ... 70
Table 4.2: Summary table for the genetic assignment results of individuals with
unknown origin to a putative population. Note that to facilitate reading, Genetic Clusters have inherited the name of the putative population with a higher proportion of membership. ... 71
Table 7.1: Characteristics of the microsatellite loci used in Emys orbicularis. Primer
(μL) = quantity of primer (μL) of a 10 μM primer solution; NA = Number of alleles sampled; primers marked with * are common for all three manuscripts ... 92
Table 7.2: Summary table of all sequenced samples in the study area. Locality:
Sampling location; Lat: Latitude; Long: Longitude. ND: information not available. ... 93 Table 7.3: Summary table of all samples used for the microsatellite data used in this work. Sample: sample code; Country: country from where the sample was collected; Locality: sampling locality; Lat: Latitude; Long: Longitude; Reference: Source of the genotype. ... 100
Table 7.4: List of non private alleles that were tested for signs of allelic frequency
clines. Highlighted in red are those alleles that had a p-value > 0.001 and a Amplitude of frequency of at least 0.2. Allele: List of non-private allele here tested; p-val: significance value of the linear regression; r2: measures if a good fit to the linear model was found or not; minFreq: minimum observed frequency of a allele in all populations; maxFreq: maximum observed frequency of a allele in all populations; Amplitude: Absolute difference between minFreq and maxFreq. ... 116
Mya – Million years ago AR – allelic richness
bp - base pairs
DNA - Deoxyribonucleic acid nuDNA – nuclear DNA mtDNA – mitochondrial DNA PCR – polymerase chain reaction cyt-b – Cytochrome-b
FST – Fixation index
HE – expected heterozygosity
HO – observed heterozygosity
uHE – unbiased expected heterozygosity
H-W E – Hardy-Weinberg equilibrium
IUCN – International Union for Conservation of Nature
K – Number of genetic clusters assumed by the software STRUCTURE LD – Linkage disequilibrium
µL – microlitre µM - micromolar
PCA – Principal Component Analysis AFC – Allelic Frequency Clines SDD – Short Distance Dispersal
SPCA – Spacial Principal Component Analysis Na – Number of alleles
Ne – Number of effective alleles PA – private alleles
1.1 Conservation of Biodiversity
Biodiversity – the variety of ecosystems, species, populations within species and genes within populations that constitutes life on earth (Allem 2000; Rands et al. 2010) of the planet is being exhausted at a rapid pace due to both indirect and direct anthropogenic actions (Frankham 2003). Despite the fact that public awareness on the matter has increased substantially in the past years, with several commitments from world leaders to halt biodiversity loss by 2010 (Butchart et al. 2010), we are still observing strong rates of biodiversity loss. In fact, these effects on biodiversity are so severe that some authors argue that we are losing biodiversity at closely the same rate as the past five mass extinctions, considering our time as the “sixth extinction” (Leakey & Lewin 1996). More recently, Barnosky et al. (2011) demonstrated that in fact, although the current rates of extinction are not as severe as those expected to have occurred in the past five mass extinctions, we are losing biodiversity at an alarming rate and, if we don’t contradict the current trend, in a few centuries the extinction rate will match that of the five mass extinctions.
1.1.1 Why conserve biodiversity?
As Humans, we have a biological need for food, water, clean air, shelter and a certain set of climatic conditions (Millennium Ecosystem Assessment 2005). As of that, we are dependent of the world’s biodiversity to exist as a species. In fact, not only we depend on it as a source for Bioresources – food, pharmaceutical components, natural fibres, timber, etc. – but we also depend on the services provided by the ecosystems – climate regulation, soil formation, oxygen production, carbon sequestration, etc. Furthermore, we benefit from its aesthetic and cultural value and a sustainable exploitation of biodiversity induce wealth and will improve human well-being (Nunes & van den Bergh 2001; Díaz et al. 2006).
1.1.2 Freshwater biodiversity
Of the world’s Hydrosphere, only 2.5% is composed of freshwater. As it is well known, a huge amount of the world’s freshwater is stored in the form of ice and permanent snow (68.7%). The second most abundant source of freshwater are in groundwater (30.1%) and only 0.29% of the total freshwater is concentrated in lakes, ponds, wetlands, river systems and biota (Gleick 1993).
Freshwater ecosystem services have been estimated to value approximately 6.5 trillion US dollars per year, corresponding to almost 20% of the estimated value of all Ecosystems on Earth (Costanza et al. 1997). Nonetheless, more than a billion of people lack safe-to-drink water, almost three billions lack access to proper sanitation (Gleick 1998; Millennium Ecosystem Assessment 2005). Each day, 14 to 30 thousand people have been estimated to die of water related diseases (Gleick 1998).
Although freshwater is, in part, considered a renewable resource, and even though we currently only use about 10% of the maximum renewable freshwater in the world, due to the variation in the availability of water through time and space, we can advocate that water scarcity is a problem that calls for appropriated water management solutions (Oki & Kanae 2006).
The freshwater ecosystems are possibly the most endangered in the world (Dudgeon et al. 2006). According to Ricciardi & Rasmussen (1999), the projected mean future extinctions for freshwater ecosystems are as five time greater than those projected for terrestrial ecosystems. A similar, although weaker, trend was later found by Collen et al. (2013).
1.1.3 Major threats to Freshwater Biodiversity
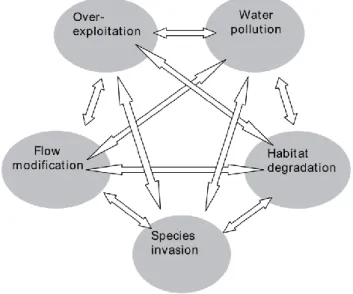
According to Dudgeon et al. (2006) threats to freshwater biodiversity can be summarized in 5 categories: Over-exploitation, pollution, flow modification, invasive species and habitat degradation (Figure 1.1).
Figure 1.1: Diagram representing the five major threats to freshwater biodiversity and their possible interactions (in Dudgeon et al. 2006)
Since the Neolithic revolution, humans have preferred to settle in areas that are close to any easy source of freshwater (e.g. rivers or lakes) (Johnson 1996). Since then, we have overexploited the resources provided for our own advantage, with severe consequences for the ecosystems.
1.2 Testudines, the Emydidae family and the Emys genus
Testudines are characterized by the presence of a shell composed of a dorsal carapace and ventral plastron (Meylan 2002). Hedges & Kumar (2009) placed the emergence of the group in the Triassic (about 200 Mya) from a terrestrial ancestor (Joyce & Gauthier 2004). At the present, Testudines occupy marine, freshwater and land ecosystem, with 331 recognized species (Van Dijk et al. 2012), divided into two distinct sub orders; Pleurodira and Cryptodira (Guillon et al. 2012).
The Emydidae family is part of the Cryptodira sub-order, with two described subfamilies: the Deirochelyinae with all 6 described genus native to the American Continent; and the Emydinae with 4 described genus, where 3 are native to the American continent, while the genus Emys presents two species in the old world.
1.2.1 Emys genus
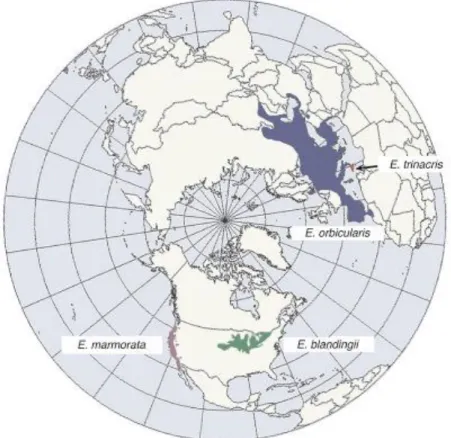
The Emys genus is characterized by medium-sized pond turtles ranging from highly aquatic (E. marmorata, E. orbicularis, E. trinacris) to semi terrestrial (E. blandingii). The genus is present in both the new world (E. marmorata and E. blandingii) and the old world (E. orbicularis and E. trinacris) (see Figure 1.2; Fritz & Havaš 2007; Van Dijk et
al. 2012). The ancestor of the E. orbicularis/E. trinacris species complex is thought to
have colonized Eurasia from North America around 16 Mya (Miocene) via the Bering bridge (Spinks & Shaffer 2009).
1.2.2 Emys orbicularis distribution and threats
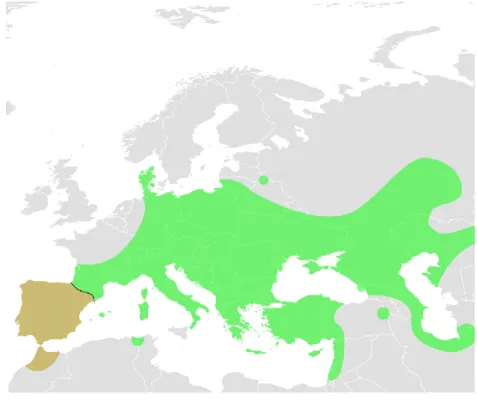
While the Sicilian pond turtle (Emys trinacris) distribution is confined to the island of Sicily (Fritz et al. 2005), its sister taxa Emys orbicularis (Linneus, 1758) has a much wider and patchy distribution ranging from the Western Asia and both Eastern and Central Europe, to the European Peninsulas and Maghreb (see Figure 1.3; Stuckas et
al. 2014).
The habitat requirements of E. orbicularis are very strict, the species is dependent on good freshwater quality in order to forage for food, as well as good terrestrial habitats in the surrounding areas, with open areas for basking and nesting (Ficetola et al. 2004). Those requirements sometimes conflict with human interests as drainage of wetlands is a common practice given the increasing necessity for agriculture and urban areas (Wood et al. 2003). Also, the increased water pollution, crescent amount of invasive species and overall habitat degradation are impacting the populations of E. orbicularis throughout its entire range, with clear signs of population regression (Cadi & Joly 2003, 2004; Andueza & Alcayde 2004; Matson et al. 2005; Antón et al. 2007, 2011; Trakimas & Sidaravi 2008; Fritz & Chiari 2013; Velo-Antón et al. unpublished).
Figure 1.3: Distribution range of Emys orbicularis. The Ibero-Maghrebian lineage is here highlighted in brown. Adapted from Spinks & Shaffer (2009).
Moreover, freshwater turtles are among the most popular pets in the world (Moll & Moll 2004). During the 1980’s the commercialization of E. orbicularis was common (Cordero & Ayres 2004). Due to the longevity and growth of terrapins, there is a tendency for pet owners to release animals in the wild, where admixture between native and non-native individuals may occur. Furthermore, some individuals are left on Recovery Centers, where it is common to use those animals to reinforce vulnerable populations (Velo-Antón et al. 2007). However, determining the population of origin from individuals delivered in Recovery Centres is hard but important, as the introduction of individuals from another differentiated population may lead to the genetic homogenization and consequent loss of genetic diversity.
1.2.3 The
complex
biogeographical
history
of
the
European Pond Turtle
Several studies show a deep phylogeographic structure throughout the species range where nine distinct mitochondrial lineages have been identified (Lenk et al. 1999; Fritz et al. 2007, 2009; Velo-Antón et al. 2011b; Stuckas et al. 2014). The distribution of these lineages results from the cyclical glacial-interglacial induced range expansions and contractions. During the Pleistocene, populations of E. orbicularis found refuge in the European Peninsulas, Anatolia (Lenk et al. 1999; Fritz et al. 2007, 2009; Sommer
et al. 2007, 2009) and in the Maghreb (Stuckas et al. 2014), resulting in several
divergent lineages.
The post-glacial re-colonization routes are well defined for the North-western, Central and Eastern Europe where the main sources for colonization were the Lineage I from the Anatolia region that colonized all Eastern Europe, and the Lineage II that originated in the Balkans that colonized Central and Western Europe, with a small number of populations present in Northeast of the Iberian Peninsula (Sommer et al. 2007, 2009). The remaining lineages played little to no role in the colonization of the Northern European latitudes, expanding little from their glacial refugia. However, the biogeographical history of the Ibero-Maghrebian lineage (lineage VI as described in Lenk et al. 1999; Fritz et al. 2007) is not as clear. This lineage inhabits both Morocco and the Iberian Peninsula and until very recently, the populations of the Maghreb were understudied and little was known about the role of North-Africa in the biogeographical history of this lineage. In fact, the work of Stuckas et al. (2014) was the first to target this region in order to assess their phylogenetic patterns. Their findings show a higher
genetic diversity and deeper phylogenetic structure in the Maghreb, and that Moroccan sequences are basal to the Iberian sequences. These results indicate a recent origin of the Iberian populations from Morocco and this hypothesis is concordant with the findings of Velo-Antón et al. (2008), that described a decline of genetic diversity in the Iberian Peninsula in a south-north axis.
1.3 Paleogeography of the Mediterranean Basin
The Mediterranean basin is considered one of the world’s hotspots for biodiversity (Myers et al. 2000). Overall, this hotspot covers approximately 2 million square kilometers, from the Portuguese Islands of Madeira and Azores in the west to northern Iraq, crossing 34 countries, and harboring several reptile species (357 with 48% endemism), amphibians (115 with 62% endemism) and a great variety of plants (30000 with 43% endemism). Much of this richness is concentrated in the southern European Peninsulas and the Western Maghreb (Cuttelod et al. 2008).
The Western Mediterranean went through several geological, historical and environmental events making it a very interesting target for phylogenetic and biogeographical studies (de Jong 1998).
1.3.1 The role of the Messinian Salinity Crisis
In the Messinian stage (around 5.6 Mya) of the Miocene (23.04 to 5.33 Mya), the Gibraltar strait was closed due to tectonic movements that resulted in the uplift of the Southern Iberian and Morocco margins and subsequent closure of the gateways between the Mediterranean Sea and the Atlantic Ocean (Krijgsman et al. 1999; Duggen et al. 2003), which lead to the desiccation of the Mediterranean Sea exposing land bridges between North Africa and the Iberian Peninsula. This event had two major consequences in the biodiversity of the region: first the connection between both continents facilitated the movement of terrestrial species between North Africa and the Iberian Peninsula (Hsü et al. 1977); second, the changes in the level of the Mediterranean Sea brought significant impacts on the mediterranean climate where an
increase in temperatures and precipitation in the surrounding areas was observed (Murphy et al. 2009; Jiménez-Moreno et al. 2010).
At the Miocene-Pliocene boundary (around 5.33 Mya), the Atlantic Ocean reconnected with the Mediterranean Basin in an event known as the Zanclean or post-Messinian flood (Garcia-Castellanos et al. 2009). This event closed the land bridges between both continents allowing for several taxa to diverge in result of vicariance processes (e.g. Acanthodactylus erythrurus, Harris et al. 2004; Pleurodeles, Carranza & Arnold 2004; Alytes, Fromhage et al. 2004; Chalcides bedriagae, Carranza et al. 2008).
1.3.2
Climatic oscillations of the Pleistocene
The Pleistocene climatic oscillations also played a major role in the distribution of several taxa. This period was characterized by several glacial-interglacial cycles (Hewitt 2004). With the decrease in temperature and subsequently advance of the Ice sheets, several western Palaearctic species retracted to several refugia mainly in the southern European peninsulas (Hewitt 2011) and in the Maghreb (Husemann et al. 2014), where more mild temperatures were found, followed by northwards expansion during the Interglacial periods, tracking the availability of suitable habitat. The isolation of several populations of one species in separated Mediterranean refugia allowed for allopatric differentiation and, in some cases, speciation. During the Holocene, at the beginning of the post-glacial period, environmental conditions at the northern latitudes improved, allowing species to disperse once more to these areas. In fact, this pattern is observed in several European species (Michaux et al. 2005; see Hewitt 2004; Weiss & Ferrand 2007 for a review).
As for the role of the Maghreb as refugia during the climatic oscillations of the Pleistocene, Husemann et al. (2014) reviewed several phylogeographical studies where European lineages are nested within African clades (e.g. Testudo graeca, Graciá et al. 2013; Malpolon monspessulanus and Hemorrhois hippocrepis, Carranza
et al. 2006; Mauremys leprosa, Fritz et al. 2006; Emys orbicularis, Stuckas et al. 2014; Crocidura russula, Cosson et al. 2005), indicating a northward colonization from North
Africa to Europe, suggesting that North Africa played an important role in Pleistocene as refugia and source for the post-glacial colonization of Europe.
1.4 Impacts of range expansion on genetic patterns
Most, if not all, species have experienced a range expansion at some time in their history (Excoffier et al. 2009; Petit 2011). Understanding the impacts of range expansion on a species’ genetic patterns is of great importance, as range expansions are linked with several important events, such as: the expansion of species from
refugia during interglacial periods (Hewitt 2000, 2004), the spread of pathogens during
epidemics (Biek et al. 2007; Velo-Antón et al. 2012b), and species range shift due to current climate changes (Parmesan & Yohe 2003).
In-silico studies have demonstrated that range expansions are fundamentally
different from demographic expansions. In fact, range expansions will result in a reduction of genetic diversity and stochastic loss of alleles in the axis of expansion as populations suffer consecutive founder effect and consequent genetic drift (Austerlitz et
al. 1997), while promoting genetic structure (Nei et al. 1975; Hallatschek et al. 2007;
Hallatschek & Nelson 2008; Excoffier & Ray 2008; Excoffier et al. 2009). Also, during range expansion, new and/or extant alleles present in the edge of the wave of expansion, might “surf” the wave of expansion, reaching very large frequencies and might even fixate in the front of expansion (Edmonds et al. 2004; Klopfstein et al. 2006; Excoffier & Ray 2008), forming allelic frequency clines (Klopfstein et al. 2006).
The surfing of alleles has several potentiating factors; for once, the population size and dispersal dynamics of the expanding species might affect the probability of an allele to surf. In fact, Klopfstein et al. (2006) showned that alleles tend to surf more often in small populations than in large populations. Also, if alleles surf in large populations, they usually don’t have the chance to fixate in the new colonized areas due to the overall low frequencies of the allele. In terms of dispersal strategy, long distance dispersal might mitigate the effects of sequential founder effects, preventing the loss of genetic diversity, while balancing the allelic frequencies in the peripheral populations (Berthouly-Salazar et al. 2013).
The surfing phenomena is not restricted to neutral alleles, as in fact any allele present at the wave front, being it neutral, advantageous or deleterious, may surf at the edge of the expansion (Travis et al. 2007; Excoffier et al. 2009; Lehe et al. 2012). The potential evolutionary consequences of such patterns are immense; Klopfstein et al. (2006) suggest that the surfing phenomenon could increase the rates of evolution at
range margins. Also, range expansions could be propitious to the spread of selected traits. For example, Phillips et al. (2006) observed that the annual rate of invasion for the Cane toad (Rhinella marina) in Australia has increased about fivefold since the first introduction. The authors also found that individuals at the expansion front have longer legs and expand faster than those in the core, possibly due to selection on the wave front. However, the surfing of deleterious mutations in the expansion wave, associated with the sequential reduction of genetic diversity might slow or halt the rate of expansion.
1.5 Objectives
The biogeographical history of the Ibero-Maghrebian lineage is very complex. The genetic relationships between populations at both sides of the Gibraltar Strait are still unclear due to the lack of samples in the southernmost regions of the Iberian Peninsula. Also, the pattern observed by Velo-Antón et al. (2008) in the genetic diversity of the Iberian Peninsula calls for more attention as it might be an opportunity to understand the impacts of range expansions in this system.
With this work, we aimed to increase the available information on the Ibero-Maghrebian lineage of E. orbicularis by focusing on several aspects:
Manuscript 1 [Chapter 2]: Here, we re-evaluate the genetic relationships between
the Iberian Peninsula and Morocco by increasing the amount of genetic sequences of both regions. Also, through the use of microsatellite markers, we propose to shed new light into the genetic structure between three major Moroccan populations of E.
orbicularis occidentalis.
Manuscript 2 [Chapter 3]: Here, we aim to determine the role of the recent range
expansion from Morocco to the Iberian Peninsula in shaping the genetic structure and distribution of genetic diversity. We hypothesize that allele surfing might have had a major role into shaping the current observable genetic structure. Also, we evaluate the potential effects of major geographical barriers on the expansion dynamics.
Manuscript 3 [Chapter 4]: Taking into consideration the numerous conservation
actions to protect Emys orbicularis, we followed the methodology described by Velo-Antón et al. (2007) to relocate individuals of unknown origin. In this work, we increase the baseline information with the aim of a more precise origin assignment.
With this work, we aim to contribute to the available knowledge about the relationship between the Iberian Peninsula and Morocco, with new insights on the impacts of the recent range expansion that this lineage underwent.
Chapter 2: Manuscript 1
Revisiting the biogeographical history of the Ibero-Maghrebian lineage of
Emys orbicularis with insights on the Moroccan genetic structure.
Authors:Paulo Pereira1, 2, Joana Veríssimo1, 2, José Teixeira1, 3, Guillermo Velo-Antón1
Affiliations:
1
CIBIO/InBIO, Centro de Investigação em Biodiversidade e Recursos Genéticos da Universidade do Porto. Instituto de Ciências Agrárias de Vairão. R. Padre Armando Quintas. 4485-661 Vairão Portugal
2
Departamento de Biologia da Faculdade de Ciências da Universidade do Porto, Rua Campo Alegre, 4169-007 Porto, Portugal
3
CIIMAR – Interdisciplinary Centre of Marine and Environmental Research, University of Porto, Rua dos Bragas, 289. 4050-123 Porto, Portugal
2.1 Abstract:
The Mediterranean basin harbours a high number of endemisms and species richness as a result of the palaeogeographic history of the region. Events such as the Messinian Salinity Crisis and the Quaternary climatic oscillations had a profound impact on the current species distribution and genetic patterns. The European pond turtle, Emys orbicularis, is distributed across Eastern and Central Europe, as well, as in Mediterranean countries and the Maghreb. However, the species faces several threats and has now a patchy distribution.
For this work we aimed to re-evaluate genetic relationships between the Iberian Peninsula and Morocco in order to discern the colonization direction. To do so, we used 80 cytochrome-b sequences and 126 individuals were genotyped for a set of 11 microsatellite loci. Our goals are to: 1) understand the relevance of North African populations as source for the colonization of the Iberian Peninsula; 2) discern any relevant genetic relationships between both sides of the Gibraltar Strait; 3) assess the genetic structure and diversity patterns; and 4) understand the impacts of anthropogenic actions on the genetic diversity of Moroccan populations.
We found three haplotypes shared between the two continents, which were highly differentiated from the remaining found in the Iberian Peninsula. Moreover, the star-like haplotype network found for the Iberian Peninsula leads to believe that a recent and rapid colonization occurred in the area. The nuclear data is concordant given the overall low allelic richness found in the region, when in comparison to Morocco. In Morocco, we found a possible gene flow barrier in the Rif Mountains, which could be explained by the topography in the area.
Overall, we were able to re-enforce the idea of a North African origin for the Iberian Peninsula Emys orbicularis and the Moroccan populations should be further evaluated to create protection policies in the area.
2.2 Introduction
The palaeogeographic history of the western Mediterranean resulted in high species richness and endemism in the Iberian Peninsula and the Maghreb (region that spreads from Morocco, northern Algeria to Tunisia) giving the region the status of hotspot of biodiversity (Myers et al. 2000). In the late Miocene (around 5.6 Mya), the closure of the Gibraltar Strait, possibly due to tectonic movements (Krijgsman et al. 1999; Duggen
et al. 2003), lead to the desiccation of the Mediterranean Sea, forming land bridges that
connected the two continents allowing for several terrestrial organisms to easily disperse in both directions (Hsü et al. 1977). Around 5.5-5.3 Mya, the land bridge connecting both continents collapsed and the Mediterranean Sea refilled from the Atlantic, isolating populations that were in contact allowing for vicariant processes to act on genetic diversification, predicting considerable genetic differentiation between the two continents. Even though this pattern is observed in several organisms (e.g.
Acanthodactylus erythrurus, Harris et al. 2004; Pleurodeles, Carranza & Arnold 2004; Alytes, Fromhage et al. 2004; Chalcides bedriagae, Carranza et al. 2008), several taxa
present relatively less marked patterns of genetic differentiation, suggesting that several species dispersed after the re-opening of the Gibraltar Strait through water instead of land (e.g. Testudo graeca, Graciá et al. 2013; Malpolon monspessulanus and Hemorrhois hippocrepis Carranza et al. 2006; Mauremys leprosa, Fritz et al. 2006 and Emys orbicularis, Stuckas et al. 2014).
Here, we focus on the European pond turtle, Emys orbicularis (Linnaeus, 1758), a widely spread species but with a patchy distribution, ranging from the Eastern and Central Europe, to the Mediterranean countries and the Maghreb (Fritz 2001). European pond turtles tolerate a strict range of habitat conditions, as they require good freshwater quality in order to forage for food, as well as terrestrial habitats with some open areas for nesting and basking (Ficetola et al. 2004). In fact, throughout its entire distribution and due to the degradation of habitat, the populations of E. orbicularis are in clear regression (Cadi & Joly 2003, 2004; Andueza & Alcayde 2004; Matson et al. 2005; Velo-Antón et al. 2007, 2011a; Trakimas & Sidaravi 2008; see Fritz & Chiari 2013). Throughout its distribution, nine geographically coherent mitochondrial lineages (based on Cytochrome b) have been found (Fritz et al. 2007, 2009; Sommer et al. 2007; Velo-Antón et al. 2011b; Stuckas et al. 2014). The Ibero-Maghrebian lineage (hereby lineage VI as first described in Lenk et al. 1999; Fritz et al. 2007) inhabits
Morocco and the Iberian Peninsula, where it overlaps with both lineages II and V along northeastern Iberian Peninsula. Studies characterizing the distribution of genetic diversity and its structure throughout the distribution of this lineage have described higher levels of genetic divergence in Moroccan populations when compared with the Iberia Peninsula (Stuckas et al. 2014). Two main haplogroups are described throughout the lineage range (Stuckas et al. 2014), the first representing Moroccan populations, sub-structured into two different groups, one encompassing the Middle Atlas Mountains and Moroccan Atlantic coast, and the other corresponding to the Rif Mountains. The second haplogroup corresponds to the Iberian populations, where little differentiation is found between haplotypes pointing to a recent expansion (Stuckas et
al. 2014). Also, Velo-Antón et al. (2008) shown that genetic diversity in the Iberian
Peninsula decreases northwards, further reinforcing the hypothesis of a single and recent colonization of the Iberian Peninsula from Morocco.
Due to the biogeographic history of this lineage and the historical importance of the Moroccan populations, further sampling efforts are necessary both in Morocco and Southern Iberian Peninsula, as several isolated populations at both sides of the Gibraltar Strait are still unstudied.
In this study, we aim to: 1) confirm the relevance of North African populations as the source for the colonization of the Iberian Peninsula, where, we hypothesize that indeed, North Africa acted as refugia during past climatic oscillations; 2) discern any relevant genetic relationships between both sides of the Gibraltar Strait; 3) assess the genetic structure and diversity patterns, both at mitochondrial and nuclear level; and 4) understand the impacts of anthropogenic actions on the genetic diversity of Moroccan populations of Emys orbicularis. To achieve our goals, we take advantage of the available genetic database (cytochrome b sequences from previous studies (Fritz et al. 2009; Velo-Antón et al. 2011b; Stuckas et al. 2014)), and complement it with new sequences from isolated populations collected in the study area. Also, microsatellite markers were used to assess the contemporary genetic structure and diversity in Moroccan populations, allowing us to uncover more detailed relationships between these populations, and to obtain as well a better picture of how anthropogenic impacts might have affected the genetic diversity in the region.
2.3 Material and Methods
2.3.1 Sampling
A total of 126 blood (either conserved in ethanol or in dried blood spots) or tissue (tail tips or buccal swabs) samples from the Iberian Peninsula (56 samples from 16 sites) and Morocco (70 samples from 6 sites), where collected.
Genomic DNA was extracted from both blood and tissue samples using the EasySpin commercial kit, following the manufacturer’s protocols, with an extended lyses time to maximize the yield.
2.3.2 Cyt-B amplification through PCR, sequencing and
haplotype analysis
A total of 83 samples were selected for cytochrome b sequencing (56 from the Iberian Peninsula and 27 from Morocco covering all sampled sites). A total of 80 new sequences were generated (55 from the Iberian Peninsula and 25 from Morocco), increasing the number of sampled populations and expanding the covered range (see Figure 2.1).
Primers mt-A-neu and H-15909 (Lenk et al. 1999) were used to amplify the selected fragment, resulting in an amplicon of approximately 1031 bp. PCR reactions were carried out in a final volume of 10μL, with 5μL of MyTaq™ Mix (Bioline), 0.4μL of each primer (primer concentration of 10μM), 3.2μL of ultra-pure water and 1μL of DNA. A BioRad T100 Thermal Cycler was used to carry out the PCR under the following program: initial denaturation at 95ºC for 15 minutes; 40 cycles at 95ºC for 45 seconds, 52ºC for 45 seconds, and 72ºC for 1 minute and 10 seconds. A final elongation step at 60ºC was performed throughout 30 minutes. Afterwards, the resulting product was depleted of non-used primers and nucleotides through an ExoSap (USB® ExoSAP-IT® PCR Product Cleanup, Affymetrix) cleaning step following manufacture’s protocol. Sequencing reactions were then carried out on a BioRad T100 Thermal Cycler with BigDye® Terminator v3.1 Cycle Sequencing Kits (AB Applied Biosystems) following manufactures protocol. Finally, sequences were produced on an ABI 3130xl genetic analyzer (Applied Biosystems, Foster City, Ca, USA). The resulting chromatograms
were verified, aligned and corrected by eye using Geneious Pro v4.8.5 (http://www.geneious.com/).
Sequences were then added to the genetic dataset available from previous studies (Lenk et al. 1999; Fritz et al. 2007; Velo-Antón et al. 2008; Pedall et al. 2011; Stuckas
et al. 2014), resulting in a total dataset of 274 sequences (1031 bp long) from both
lineage VI (n= 180) and the other two lineages that occur in the Northeastern Iberian Peninsula (II and V). To avoid confusion when naming new haplotypes, we followed the nomenclature adopted in the mentioned papers.
A parsimony haplotype network was constructed using TCS v1.21 (Clement et al. 2000), using as threshold the default 95% probability.
2.3.3 Microsatellites amplification
A total of 66 samples spread across three populations (Fifi, Sidi Mimoun and Moulay Abdesalam; see supplementary material table 7.3) were amplified for eleven microsatellite loci. These primers were developed for Glyptemys muhlenbergii and tested for cross-amplification in Emys orbicularis (King & Julian 2004), and 7 of them (D88, D114, D16, D93, D87, D51 and B08) were previously used in Iberian populations of Emys orbicularis (Roques et al. 2006; Velo-Antón et al. 2007, 2008). For each locus a third primer was used, following the M13 tailed primer method (Oetting et al. 1995). This primer was labeled with FAM, NED, VIC or PET depending on the selected dye for each locus, and was used at the same concentration as the reverse primer. To adjust for this, forward primers were used at a ten-fold dilution.
PCR reactions were performed in two multiplex reactions (Supplementary Material Table 7.1) at a final volume of 10μL, with 5μL of Quiagen Multiplex PCR Kit, 1μL of DNA and 1μL of the primer mix, with tails and primers (at 10μM). For each multiplex a touchdown PCR reaction was conducted under the following conditions: initial denaturation at 95ºC for 15 minutes; 9 cycles with a denaturation step at 95ºC for 38 seconds, annealing at 60ºC for 1 minute (decreasing 0.5ºC each cycle) and extension at 72ºC for 30 seconds; 23 cycles of 95ºC for 30 seconds, 56ºC for 1 minute, 72ºC for 30 seconds; 8 cycles of 95ºC for 30 seconds, 53ºC for 1 minute, 72ºC for 30 seconds, followed by a final elongation step at 60ºC for 30 minutes. PCR reactions were performed on a BioRad T100 Thermocycler and genotypes were obtained from an ABI 3130xl genetic analyzer (Applied Biosystems, Foster City, CA, USA). GeneScanTM-500
Liz was used as size standard. Allele scoring was performed in GeneMapper v4.0 (Applied Biosystems). For comparison purposes, a small set of ten samples used in Velo-Antón et al. (2008) were re-genotyped in this study in order to correct the allele scoring for the seven common microsatellites (D88, D114, D16, D93, D87, D51 and B08).
2.3.4 Genetic structure and diversity indexes
Two datasets of microsatellites were created, a first dataset containing the eleven microsatellites (hereby complete dataset) and a second (hereby partial dataset) only containing the seven common microsatellites (Velo-Antón et al. 2007, 2008). This second dataset was constructed in order to allow us to compare our results with those previously found for the Iberian Peninsula.
Deviations from Hardy-Weinberg equilibrium and signs of linkage disequilibrium across all populations and loci were inferred in GENEPOP v4.2 on the web (Raymond & Rousset 1995; Rousset 2008). Genalex 6.5 (Peakall & Smouse 2006, 2012) was used to calculate genetic diversity indexes such as Observed Heterozygosity (HO),
Expected Heterozygosity (HE) and Number of effective alleles (Na). Mean number of
alleles per locus across loci was also calculated using Genetix V4.05 (Belkhir et al. 2004) for the partial dataset.
Genetic structure in North Africa was evaluated using the Bayesian approach implemented in STRUCTURE (Pritchard et al. 2000). STRUCTURE was run from k=1 to k=10. This upper bound was set to 10 as it is high enough to allow for possible substructure in each population, ten replicates were run for each k for 1,000,000 generations per run, including 250,000 generations of burn-in. Our runs accounted for admixture and correlated allele frequencies. In order to determine the most likely number of clusters we used the Evanno’s method (Evanno et al. 2005) implemented in the Structure Harvester (Earl & vonHoldt 2012).
Figure 2.1: Top: Geographical distribution of the three main haplogroups found in the study area, Red circles represent the Iberian haplogroup, which includes the haplotypes VIa, VIe, VIg, VIb, VIk, VIj and VId. Light green circles represent the haplogroup tightly linked with the Rif Mountain and comprises the haplogroups VIf, VIm, VIl, VIh, VIn and VIo. It is important to note that the last three haplotypes are either shared with the Iberian Peninsula or only have been found in there (case of VIo). Dark green circles correspond to the Atlas haplogroup comprising the haplotype Vic and VIi. Blue Circles indicate other lineages found in the study area. The current distribution of the subspecies is denoted in 10km by10 km squares marked in beige. Bottom: Haplotype network, in the left the complete haplotype network for the entire range of the species is shown the position of the lineage VI. On the right, the haplotype network for the lineage VI is shown. In this case red circles correspond to haplotypes found in the Iberian Peninsula, Light Green Circles, haplotypes found in the Rif Mountains and Dark Green haplotypes found in the Atlas Mountains.
2.4 Results
2.4.1 Mitochondrial DNA analyses
In addition to the nine haplotypes previously found in the Ibero-Maghrebian lineage (Stuckas et al. 2014), six new haplotypes were found (supplementary material table 7.2). Three of the newly encountered haplotypes were found in Morocco (VIl, VIm, VIn) and three in the Iberian Peninsula (VIj, VIk, VIo) (Figure 2.1). Here we find for the first time shared haplotypes between both sides of the Gibraltar Strait, particularly between the Rif Mountains (Jeramena) and the two southernmost populations of the Iberian Peninsula, Málaga and Cádiz. Also, the haplotypes found in these populations (VIh, VIn and VIo) are highly divergent from those found across the Iberian Peninsula.
In the Iberian Peninsula the most commonly represented haplotype is VIa (n=101), while in Morocco the most frequent haplotype is the VIf (n=25), even though most of the sampling effort is concentrated in the Iberian Peninsula, the same number of haplotypes was found for both regions. The haplotype network divides both regions into two groups; a first one comprising all Moroccan haplotypes and the haplotype VIo, even though the latter was only found in the Iberian Peninsula, presenting some geographical structure, with the Middle Atlas separated from the Rift Mountains. The second group collapses all Iberian haplotypes into a start-shaped network, with no evident geographical structure.
2.4.2 Microsatellites analysis
No evidence of linkage disequilibrium or deviation to Hardy-Weinberg equilibrium was found in the eleven microsatellites used, so all of them were used in subsequent analysis. Overall, the number of alleles per locus ranged from 2 (Locus A32 and D121) to 16 (Locus D16), averaging 9 alleles per locus, amounting to a total of 99 alleles across all loci. For the Moroccan populations, the highest expected heterozygosity values were observed in Fifi (0.695 for the complete dataset, 0.757 for the partial dataset), while in Moulay Abdesalam the lowest values of expected heterozygosity were found (0.578 for the complete dataset, 0.663 for the partial dataset). These values were still lower than those presented in Doñana (0.80 partial dataset only; southernmost population of the Iberian Peninsula sampled in Velo-Antón et al. 2008). As for the Mean number of alleles per locus, Fifi presents again the highest values
(8.43) and Moulay Abdesalam presents the lowest values (4.86). Nonetheless, Fifi and Sidi Mimoun (7.29) present higher values than those found in Doñana (6.18) (Table 2.1).
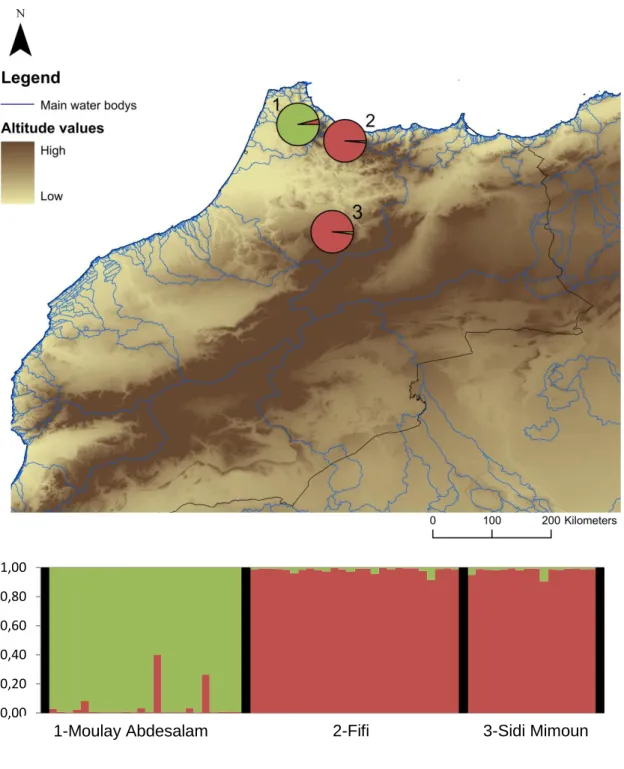
As for the genetic structure, two clusters were presented as the most probable umber of genetic clusters by the Evanno method (Supplementary material Figure 7.1 Top). In this solution, Moulay Abdesalam (Rif Mountains) is assigned to its own genetic group, while Fifi (Rif Mountains) and Sidi Mimoune (Middle Atlas) are grouped together (Figure 2.2). We have found very little genetic admixture, especially in the Fifi-Sidi Mimoune genetic cluster, in the Moulay Abdesalam cluster, two individuals present some genetic admixture (Figure 2.2).
2.5 Discussion
2.5.1 Re-evaluating the role of North Africa as the source
of the Iberian populations
North Africa played an important role as refugia in the glacial-interglacial cycles. When temperatures started to decrease, various European species started to contract their ranges to the south, where mild temperatures could be found, settling in several areas that acted as refugia, both in the European Peninsulas and in North Africa (Hewitt 2000; Husemann et al. 2014). Nowadays, the origin of several taxa that are currently present in both margins of the Mediterranean Sea can be traced to a North African origin; such is the case in arthoprods (Buthus, Sousa et al. 2012), reptiles (Mauremys leprosa, Fritz et al. 2006; various snakes, Carranza et al. 2004, 2006;
Testudo graeca, Álvarez et al. 2000; Chamaeleo chamaeleon, Paulo et al. 2002). Table 2.1: Summary table of diversity indices for both complete and partial dataset. n: number of samples per population; HO: observed heterozygosity; HE: expected heterozygosity; PA: private alleles; MNA: Mean Number of Alleles.
Complete Dataset Partial Dataset
Population n HO HE HO HE MNA
Fifi 26 0.736 0.695 0.777 0.757 8.4286
Sidi Mimoun 16 0.614 0.607 0.765 0.751 7.2857
Moulay Abdesalam 24 0.655 0.578 0.763 0.663 4.8571
Figure 2.2: Top: A spatial representation of the genetic structure found in Morocco for k=2. Each pie chart corresponds to a sampling location, identified by a number that corresponds to the population in the graphic below. Rivers are here represented as blue lines. Bottom: Structure output for k=2, each vertical bar corresponds to a individual, where the proportion of colours indicates its probability of assignment to the corresponding cluster. Black lines separate sampling locations.
0,00 0,20 0,40 0,60 0,80 1,00
In a recent study, Stuckas et al. (2014) uncovered two major groups for the lineage VI of E. orbicularis, one in North Africa, with a higher number of haplotypes and a more structured network, and a second group, derived from Morocco, confined to the Iberian Peninsula with a widespread and common haplotype (VIa) and several other satellite haplotypes differing in only one or two nucleotides, a pattern that is very typical of lineages that are undergoing a demographic expansion. The low haplotype diversity found is expected as turtles tend to have slower evolutionary rates when compared to other vertebrates (Avise et al. 1992). Also, Stuckas et al. (2014) uncovered deeply divergent lineages in North Africa, between Morocco and the Eastern Maghreb. These results seem to indicate that E. orbicularis have been present in North Africa longer than on the Iberian Peninsula.
In light of our results, the hypothesis of a North African origin for E. orbicularis seems very plausible. This hypothesis is also supported by the microsatellite data where a higher allelic richness was found in North Africa even though genetic diversity is lower. Widmer & Lexer (2001) suggested that potential glacial refugia will present higher Allelic Richness than the recently colonized regions, as several alleles might disappear through genetic drift (Austerlitz et al. 1997). Nonetheless, this might not be true for heterozygosity as the genetic drift acts faster on allelic richness than on the expected heterozygosity (Widmer & Lexer 2001). We should not rule out the possibility that the low levels of genetic diversity observed in Morocco, especially in Moulay Abdesalam, might be associated with possible anthropogenic pressures (Fahd et al. 2009; Velo-Antón et al. unpublished data).
2.5.2 Genetic relationships at both sides of the Gibraltar
Strait
Here we discuss two distinct hypotheses for the presence of shared haplotypes between Morocco and the southernmost Iberian Populations (Cádiz and Málaga): 1) either by natural transmarine dispersal of Moroccan individuals to the Iberian Peninsula or by 2) Human mediated introductions.
Transmarine dispersal as been observed in other Chelonians (Caccone et al. 1999; Gerlach et al. 2006; Vamberger et al. 2014), and several other cases document possible transmarine migration through the Strait of Gibraltar (Carranza et al. 2006b; Kaliontzopoulou et al. 2011). The distance between both sides of the Strait is relatively small (14 km at the present to 4-5 km in some glacial cycles; Brandt et al. 1996; Zazo