ISSN: 1809-4430 (on-line)
_________________________
1 Enga. Agrônoma, Prof. Doutor, Câmpus Experimental de Registro, UNESP, Registro, SP, Fone: (13) 3828 3048, email:
kelly@registro.unesp.br
2 Enga. Agrônoma, Mestre em Enga. Sistemas Agrícolas, Depto. Enga.de Biossistemas, ESALQ/USP, Piracicaba, SP. e-mail:
danifernandes@usp.br
3 Cientista da computação, Prof. Doutor, Câmpus Experimental de Registro, UNESP, Registro, SP, email: silvia@registro.unesp.br EVALUATION OF THERMORREGULATORY CAPACITY OF DAIRY BUFFALOES
USING INFRARED THERMOGRAPHY Doi:http://dx.doi.org/10.1590/1809-4430-Eng.Agric.v36n1p 1-12/2016
KELLY B. SEVEGNANI1, DANIELLE P. B. FERNANDES2,
SILVIA H. MODENESE-GORLA DA SILVA3
ABSTRACT: The objective of this study was to evaluate the thermoregulatory response of dairy buffaloes in pre-milking and post-milking. To identify animal thermoregulatory capacity, skin surface temperatures were taken by an infrared thermometer (SST), a thermographic camera (MTBP) as well as respiratory rate records (RR). Black Globe and Humidity Index (BGHI), radiating thermal load (RTL) and enthalpy (H) were used to characterize the thermal environment. Artificial Neural Networks analyzed those indices as well as animal physiological data, using a single layer trained with the least mean square (LMS) algorithm. The results indicated that pre-milking and post-milking environments reached BGHI, RR, SST and MTBP values above thermal neutrality zone for buffaloes. In addition, limits of surface skin temperatures were mostly influenced by changing ambient conditions to the detriment of respiratory rates. It follows that buffaloes are sensitive to environmental changes and their skin temperatures are the best indicators of thermal comfort in relation to respiratory rate.
KEYWORDS: buffalo, heat stress, respiratory rate, surface temperature.
AVALIAÇÃO DA CAPACIDADE TERMORREGULATÓRIA DE BÚFALAS LEITEIRAS UTILIZANDO TERMOGRAFIA DE INFRAVERMELHO
RESUMO: O objetivo deste trabalho foi avaliar a resposta termorregulatória de búfalas leiteiras nos ambientes de pré-ordenha (sala de espera) e pós-ordenha. Para identificar a capacidade termorregulatória dos animais, coletou-se a temperatura de superfície da pele, utilizando um termômetro de infravermelho (TMPT) e uma câmera termográfica (TMPC), e a frequência respiratória (FR) dos animais. Para a caracterização do ambiente térmico, foram calculados o índice de temperatura de globo e umidade (ITGU), a carga térmica radiante (CTR) e a entalpia (H). Os índices e os dados fisiológicos dos animais foram analisados utilizando-se de Redes Neurais Artificiais com uma única camada, treinadas com o algoritmo mínimo quadrado médio
(LMS - Least mean square). Os resultados indicaram que os ambientes de pré e pós-ordenha
alcançaram valores de ITGU, FR, TMPT e TMPC acima dos limites relacionados à zona de termoneutralidade dos bubalinos, sendo a temperatura superficial da pele influenciada mais intensamente pela variação das condições ambientais em detrimento da frequência respiratória. Conclui-se que os bubalinos são sensíveis às variações ambientais, sendo o s valores de temperatura de superfície da pele melhores indicadores de conforto térmico em relação à frequência respiratória.
INTRODUCTION
Vale do Ribeira is the major buffalo milk-producing region for São Paulo state in Brazil, sustaining a herd of approximately 25 thousand buffaloes, and buffalo milk representing the third most important local production chain (ABCB, 2012). However, the fac ilities for dairy buffaloes, in this region, are not always adequate as the same structure is used for bovines, which is not ideal. As these two species possess morphological and anatomical differences, they perform distinctly dissimilar behaviors in the bodily function of heat release (KOGA et al., 2004).
Producing animals must be placed in installations that provide at least minimal thermal comfort, because in unfavorable climate conditions animal food ingestion and water consumption may be impaired, due to difficulties with thermal exchanges. (MARAI & HABEEB, 2010).
Buffaloes (Bubalus bubalis) are animals known for their rusticity, as they cope well in adverse environments, besides being considered a suitable option in areas where bovines do not adapt (DAMASCENO et al., 2010). However, literature states that these animals have difficulty in releasing body-heat under high temperature and humidity, what can affect on productive and reproductive performance of this species (MARAI et al., 2009; GARCIA et al., 2011).
Under hot temperatures, buffaloes increase blood volume and surface flow to keep sk in temperature high and to facilitate heat dissipation while they are in mud or water (OLIVEIRA et al., 2013). Thus, mechanisms that help with their thermal comfort and consequently wellbeing are essential, although often neglected by producers.
During milking process, dairy buffaloes that stay in waiting rooms are exposed to high temperatures for a considerable amount of time, since they are kept in pastures that most of the times have no shade. Consequently, before being milked, these animals go through a stress period that can interfere with their productive indices.
Studies of alterations in physiological and behavioral variables of dairy buffaloes during the milking process are therefore essential, as they contribute to improve local microclimate where these animals are located.
In light of this, the aim of this study was to evaluate the thermoregulatory response of dairy buffaloes in both pre-milking rooms (waiting rooms) and post-milking environments.
MATERIAL AND METHODS
The experiment was conducted in confinement installations of the Research and Development Unit (UPD) of the Development Regional Pole of Vale do Ribeira Agribusiness (APTA), in Registro - SP, Brazil. It is located at 24º 26’ 15” South and 47º 48’ 45” West, at a mean altitude of 40m, with a rainy tropical climate, without a dry winter season, of Af type as stated by Köeppen’s classification (CEPAGRI, 2015).
The methodology was established considering the daily management carried on the property, aiming to interfere minimally, without causing animal stress during the proposed procedures.
Fifteen contemporary buffaloes of Murrah breed were used. Once a day, in the morning, they were sent to a covered barn (pre-milking room) for machine milking. The barn has dimensions of 12 x 25 meters, with a ceiling of 3.2 meters in height, built in brick masonry, covered with clay roofing tiles and walls up to a height of 1.8 meters. The milking room is a space contiguous to the
waiting room, within the same barn, of “bucket milking” type and capacity for two milked animals
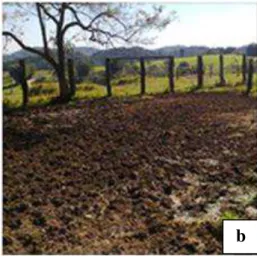
FIGURE 1. Pre-milking (a) and post-milking (b) sites.
Data of physiological variables were collected in the waiting room (pre-milking) at 8:00 am, when the animals arrived from pasture and waited to be milked. In the post-milking environment, data were collected at 10:30 am, post-milking time when the animals stayed in corral. The following physiological variables were collected: respiratory rate (quantity of respiratory movements/minute) and mean temperature of skin surface. Black globe temperature, air temperature, relative humidity, and wind speed were simultaneously quantified.
The respiratory rate (RR) was verified through the counting of right side movements for 30 seconds, and subsequently multiplied by two, in order to obtain respiratory rate per minute. The timekeeping was carried out with the aid of a chronometer.
The skin surface temperature (SST) was measured by an infrared radius thermometer with laser sighting and adjusted emissivity of 0.98 (adequate value for biological materials). Temperatures were assessed in the following regions: chamfer (forehead), ear, “neck side”, front
shank, back shank, right side udder and in between legs.
The mean SST was calculated as the arithmetical mean between these two measurements, according to [eq. (1)] (DAS et al., 1999):
(1)
In which,
AST – mean skin surface temperature; CT – chamfer temperature (ºC); ET – ear temperature (ºC); NT – neck temperature (ºC);
FST - front shank temperature (ºC); BST - back shank temperature (ºC); RSUT - right-side udder temperature (ºC).
Each animal was photographed using a thermographic infrared camera, Flir® brand, E30 model, with emissivity adjusted for biological materials of 0.98. Pictures were taken from the right side of the animal in order to compare with the temperatures measured with the common infrared thermometer.
Regarding the thermographic images analysis, QuickReport® software was used. To this end,
a “dot” tool was used to measure skin surface mean temperature per body part (MTBP) determined
by the thermographic camera.
Black globe temperature was measured under shading (BGTUS) of the waiting room and in the post-milking room without shading (BGTWS), with the globe being placed at a height of 1.50 m (mean height that an animal withers), located in the center of the pre-milking and post-milking environments. Black globe temperature is the measurement of all incident radiation in a black frosted room with a temperature sensor in the geometric center. This temperature is an indicator of the thermal sensation in the animals at that time, given in degrees Celsius.
Air temperature, relative humidity and wind speed were also measured with a thermo anemometer located in the center of the evaluated environments, at a height of 1.50m. These environmental variables were manually measured every minute during the collection of the physiological variable data, for subsequent correlation and characterization of the environment.
Using the environmental variables, we calculated specific enthalpy (H), radiating thermal load (RTL), Black Globe and Humidity Index (BGHI).
The specific enthalpy (H; kJ kg-¹ of dry air), proposed by RODRIGUES et al. (2011), was measured according the following equation (Equation 2):
(2) In which,
t - Dry bulb temperature (ºC); RH – Air relative humidity (%); Bp– Barometric pressure, mmHg.
The radiating thermal load (W m-²), proposed by ESMAY (1969), was calculated in accordance with eqs. (3) and (4):
(3) In which,
c - Stefan-Boltzman constant 5.67*10-8 W m-2 K-4; RAT – Radiating mean temperature (K).
With the RAT calculated in accordance with the following equation (ESMAY, 1969):
(4)
In which,
Sw – Wind speed (m s-1);
Tbg - Temperature of black globe thermometer (K); Td - Temperature of dry bulb (K).
The Black Globe and Humidity Index, was calculated in accordance with the equation described by BUFFINGTON et al. (1981) (Equation 5):
(5) In which,
Tdp – Dew point temperature (ºC).
The dew point temperature was established regarding the equation described by HELLICKSON & WALKER (1983) (Equation 6):
(6) In which,
Pv = Vapor pressure (mmHg).
With the vapor pressure measured through the equation proposed by HELLICKSON & WALKER (1983) (Equation 7):
(7) In which,
Td – Dry bulb temperature (ºC); RH– Air relative humidity (%).
For this study and for the elaboration of a regression model, the following indices were used as input: BGHI, H, RTL; aside from the physiological variables: RR, SST and MTBP intercalated as input and output variables.
The indices related to environmental variables and physiological data were analyzed with a Machine learning (ML) study, using Artificial Neural Networks with a single layer, trained with the least mean square algorithm (LMS - Least mean square), through a WEKA public domain computer tool.
Firstly, we verified the correlation degree between the defined model and all different variables or variable set. After this, we submitted the greatest correlation to a multiple regression analysis by the algorithm mentioned above. The aim of this analysis was to validate a possible influence of the environmental variables on respiratory rates and skin surface temperatures of dairy buffaloes in pre-milking and post-milking environments.
RESULTS AND DISCUSSION
During the experimental period, room temperature and relative humidity mean values varied respectively from 23.9 to 28.4 ºC and 76.7 to 80.6 % in pre-milking, and 29.2 to 35.4 ºC and 50.7 to 72.6 % in post-milking (Figure 2).
As observed, the post-milking environment provided higher temperatures than those recommended by literature for nursing buffaloes. According to GUDEV et al. (2007), nursing buffaloes must be protected from direct solar radiation during summer months when the environment temperature is above 30 ºC. However, GOSWAMI & NARAIN (1962) observed that buffaloes only feel the need to seek body thermoregulation alternatives when air temperature is above 29°C and once the thermal neutral zone of buffaloes range from 15.5 °C to 21.2 °C. Although the search for thermoregulation is observed in post-milking, it is also verified the necessity of focusing efforts on acclimatizing the pre-milking environment, since internal temperatures above buffalo thermal neutral zone are observed
and minerals, enzymatic reactions, hormonal secretions and blood metabolites. Such changes result in decreased reproduction and production performances (MARAI & HABEEB, 2010).
FIGURE 2. Temperature and air humidity variation in pre-milking (PrM) and post-milking (PoM) regarding days of collection.
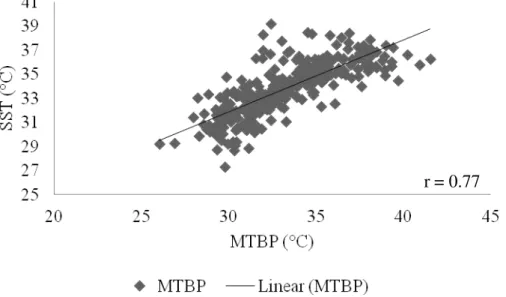
Regarding MTBP and SST data, Figure 3 evidences that these are highly correlated (r = 0.77). However, it must be highlighted that the thermographic cameras proved to be the most appropriate way of collecting skin surface temperature, mainly in the post-milking environment where greater animal movement was allowed.
FIGURE 3. Graphic representation of skin surface mean temperature measured by the thermographic camera (x-axis: MTBP) and by the thermometer (y-axis: SST).
In this location, animals had more room to move around, even those most agitated ones, so that made data collection longer. This fact complicated SST measurement with infrared thermometer, as a few animals did not allow people to get closer than 30 centimeters to the collection target (which is the ideal distance to measure SST with this type of thermometer).
Values of SST and RR collected in post-milking environment tend to be higher than the ones found in pre-milking. Table 1 shows that the greatest values of H, RTL and BGHI in post-milking indicate direct influence of environmental variables on animal physiological variables.
TABLE 1. Minimum, maximum and mean values of Black Globe and Humidity Index (BGHI), enthalpy (H), radiating thermal load (RTL), respiratory rate (RR), and mean skin surface temperature assessed with thermometer and infrared camera (SST and MTBP).
Descriptive Statistics BGHI H RTL RR SST MTBP
Pre-milking
Minimum 69.43 61.41 436.17 12 26.03 27.32
Maximum 78.19 75.19 500.29 32 35.25 35.82
Mean 74.38 68.27 456.91 21.98 31.14 32.12
Standard deviation 2.73 4.81 17.75 4.09 1.66 1.57
Post-milking
Minimum 78.09 74.85 469.16 18 29.7 30.82
Maximum 87.47 88.47 509.27 66 41.55 39.22
Mean 83.54 81.88 493.77 33.77 35.22 35.37
Standard deviation 2.92 4.49 14.45 8.19 2.37 1.54
The H, BGHI and RTL increasing values in post-milking environment were followed by a steep increase in both RR and SST to the detriment of the pre-milking environment. The minimum, and maximum BGHI mean values found in post-milking environment (78, 09; 83.54 and 87.47, respectively) indicate that in several moments animals were submitted to alert and emergency conditions. As defined by BAÊTA & SOUZA (2010), when BGHI values reach 74 to 78 and above 84. Although the pre-milking environment has offered conditions of greater comfort, there was still a warning situation (maximum BGHI of 78.19).
These results support once again the need for adoption of mechanisms that enable thermal comfort to the animals, such as showers in the pre-milking environment and shading material (shade cloth) in the post-milking environment (KHONGDEE et al., 2013; OLIVEIRA et al., 2013; SEVEGNANI et al., 2013).
Previous studies evidenced that when these resources are adequately dimensioned, a significant reduction of BGHI is observed, which demonstrates positive results in the thermoregulation of these animals. SILVA et al. (2011) reported that for animals submitted to treatment where shading was provided, the BGHI was 84.7, which was comparable to treatment without shading, at which a mean of 89.1 were achieved. In parallel, when using showers in a pre-milking environment, OLIVEIRA et al. (2013) confirmed variations (in a few animals) in warning or stress zone to the thermal comfort zone compared to treatments without shower availability. In the last example, all the animals were under thermal stress.
When animals are going through thermal discomfort, the first visible sign of stress is an increase in RR (VILELA et al., 2013). ALAM et al. (2010) also affirmed that when buffaloes are under thermal stress: panting, excessive salivation, tongue protrusion a nd neck extension are followed by a RR of 42.7 movements/ minute and SST of 38.9 °C, for skin exposed to sun and 36.9 °C for skin under shade. By comparing the values found by these authors to the maximum values of RR, MTBP and SST in the post-milking environment of this study, we observed that, in certain moments, the animals became distressed and might have evidenced visible signs of discomfort.
TABLE 2. Estimated regression model concerning physiological variables and zootechnical indexes.
Variable Regression equation r R²
RR RR = 0.019×RTL + 0.6394×BGHI + 0.7914×SST - 58.3899 +0.72 0.52
SST SST = 0.0625×RR + 0.1011×H + 0.0158×RTL + 0.1583×BGHI + 3.9226 +0.81 0.66
MTBP MTBP = 0.0239×RR + 0.0572×H + 0.0265×RTL + 0.1088×BGHI + 7.6501 +0.79 0.62
r - Correlation coefficient; R2– Determination coefficient
Enthalpy data was not used in the model that refers to RR prediction, because when employed in the regression equation, it led to a negative coefficient for this variable. This result indicates that the higher the enthalpy, the lower the expected RR. This theory appears to be false because an enthalpy system, utilizing the amount of heat referred above, by kilogram of dry air, shows positive correlation with RR as a consequence of increased animal discomfort (DE ALMEIDA et al., 2011). For this reason, enthalpy was eliminated from the equation to grant greater reliability to the model. It was also opted to use SST instead of MTBP, due to a greater correlation coefficient being found in the regression equation of this variable.
Also regarding the RR regression equation, we perceived that SST was strongly associated with RR compared to the others. SST, as well as MTBP, were extremely dependent on BGHI and on H compared to the other variables, demonstrating that SST is more sensitive to changes in environmental conditions.
Figure 4 displays observed and estimated SST data. When the temperature is lower than 29 ºC, or higher than 37.82 ºC, the established model is not adequate for data prediction. It happens because for temperatures outside this range, the degree of error between observed and estimated data becomes higher. Therefore, it is suggested that the regression model is not used during winter, when lower temperatures are found.
FIGURE 4. Observed and estimated temperature of skin surface (limited by black lines) by an infrared thermometer.
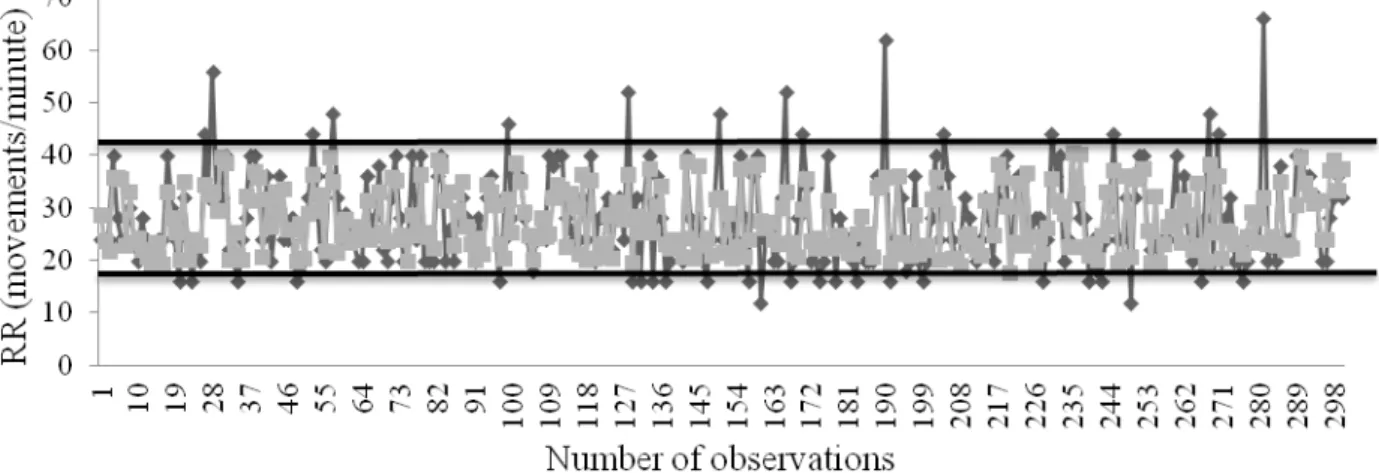
FIGURE 5. Respiratory rate (movements/minute) observed and estimated (limited by black lines).
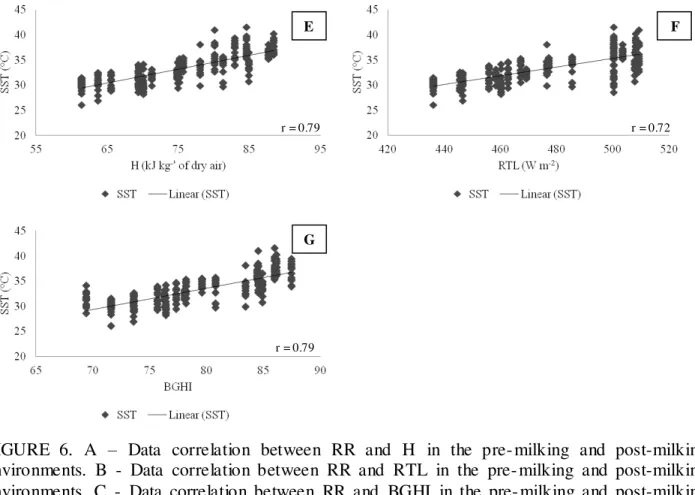
Figure 6 evidences RR variation depending on H (r = 0.65), RTL (r = 0.61), BGHI (r = 0.70) and SST depending on H (r = 0.79), RTL (r = 0.72) and BGHI (r = 0.79), as well as the correlation between RR and SST (r = 0.64) and RR depending on MTBP (0.60). In accordance with the graphs cited above, H, RTL, BGHI, BGHI, were positively correlated with the mean SST and the respiratory rate.
A B
C D
r = 0.65 r = 0.61
FIGURE 6. A – Data correlation between RR and H in the pre-milking and post-milking environments. B - Data correlation between RR and RTL in the pre-milking and post-milking environments. C - Data correlation between RR and BGHI in the pre-milking and post-milking environments. D - Data correlation between RR and SST in the pre-milking and post-milking environments. E - Data correlation between SST and H in the pre-milking and post-milking environments. F - Data correlation between SST and RTL in the pre-milking and post-milking environments. G - Data correlation between SST and BGHI in the pre-milking and post-milking environments.
These results agree with SILVA et al. (2011), who achieved a positive correlation between RR (r = 0.48) and SST (r = 0.90) with BGHI. The results also confirmed that H, RTL and BGHI possess a high degree of linear statistical dependence with SST. Thus, for all the evaluated indices, the SSTs were most influenced by environmental conditions variation that affects RR.
CONCLUSIONS
Buffaloes are sensitive to environmental variations, once adverse conditions, such as high temperature, reflect directly in skin surface temperature increases and in lower degree of respiratory rate for pre-milking and post-milking environments. For these reason, skin surface temperature is the best indicator of thermal comfort in relation to respiratory rate.
REFERENCES
ABCB – Associação Brasileira de Criadores de Búfalos. Disponível em: <http://www.bufalo.com.br/noticias.html>. Acesso em: 5 nov. 2012.
ALAM, M.R.; GREGORY, N.G.; UDDIN, M.S.; JABBAR, M.A.; CHOWDHURY, S.; DEBNATH, N.C. Frequency of nose and tail injuries in cattle and water buffalo at livestock markets in Bangladesh. Animal Welfare, London, v.19, p.295-300. 2010. Disponível em: <http://www.fao.org/fileadmin/user_upload/animalwelfare/Injuries_1.pdf>. Acesso em: 21 abr. 2015.
r = 0.79
E F
G
BAÊTA, F.C.; SOUZA, C.F. Ambiência e m edificações rurais - conforto animal. Viçosa: Editora da Universidade Federal de Viçosa, 2010. 269p.
BUFFINGTON, D.E.; COLLAZO-AROCHO, A.; CANTON, G.H.; PITT, D.; THATCHER, W.W.; COLLIER, R.J/ Black globe-humidity index (BGHI) as comfort equation for dairy cows. Transactions of the ASAE, St. Joseph, v.24, n.3, p.711-714 1981. Disponível em: <https://elibrary.asabe.org/azdez.asp?AID=34325&T=2>. Acesso em: 23 abr. 2015.
CEPAGRI – Centro de Pesquisas Meteorológicas e Climáticas Aplicadas a Agricultura. 2015. Disponível em: <http://www.cpa.unicamp.br/outras-informacoes/clima_muni_480.html>. Acesso em: 11 abr. 2015.
DAMASCENO, F.A.; VIANA, J.M.; TINÔCO, I.D.F.F.; GOMES, R.C.C.; SCHIASSI, L. Adaptação de Bubalinos ao Ambiente Tropical. Revista Eletrônica Nutritime, Viçosa, v.7,
p.1370-1381, 2010. Disponível em:
<http://www.ufv.br/dea/ambiagro/gallery/publica%C3%A7%C3%B5es/Adapta%C3%A7%C3%A3 o%20de%20bubalinos%20ao%20ambiente%20tropical_damasceno%20et%20al.pdf>. Acesso em: 10 abr. 2015.
DAS, S.K., UPADHYAY, E.C., MADAN, M.L. Heat stress in Murrah buffalo calves. Livestock Production Science, Amsterdam, v.61, n.1, p.71-78, 1999. Disponível em: <http://ac.els- cdn.com/S0301622699000408/1-s2.0-S0301622699000408-main.pdf?_tid=b39c822c-1780-11e5-ae20-00000aacb35f&acdnat=1434827904_ef0c8e74ff5c7aff2ab3d3aae891aff9>. doi: 10.1016/S0301-6226(99)00040-8
DE ALMEIDA, G.L.; PANDORFI, H.; GUISELINI, C.; HENRIQUE, H.M.; DE ALMEIDA, G.A. Uso do sistema de resfriamento adiabático evaporativo no conforto térmico de vacas da raça girolando. Revista Brasileira Engenharia Agrícola e Ambiental, Campina Grande, v.15, n.7, p.754-760, 2011. Disponível em: <http://www.scielo.br/pdf/rbeaa/v15n7/v15n07a15.pdf>. Acesso em: 20 abr. 2015.
ESMAY, M. Principles of animal environment. West Port: AVI Publishing, 1969. 325p.
GARCIA, A.R.; MATOS, L.B.; LOURENÇO JÚNIOR, J.B., NAHÚM, B.S.; ARAÚJO, C.V.; SANTOS, A.X. Variáveis fisiológicas de búfalas leiteiras criadas sob sombreamento em sistemas silvipastoris. Pesquisa Agropecuária Brasileira, Brasília, v.46, n.10, p.1409-1414, 2011. Disponível em:< http://www.scielo.br/pdf/pab/v46n10/46v10a38.pdf>. Acesso em: 16 abr. 2015. GOSWAMI, S.B.; NARAIN, P. The effect of air temperate and relative humidity on some physiological indices of buffalo bulls (Bubalus bubalis L.). The Indian Jounal Veterinary Sciences,New Delhi, v.33, p.112, 1962.
GUDEV, D.; POPOVA-RALCHEVA, S.; MONEVA, P.; ALEKSIEV, Y.; PEEVA, T.Z.; PENCHEV, P.; ILIEVA, I. Physiological indices in buffaloes exposed to sun. Archiva
Zootechnica, Bucharest, v.10, 2007. Disponível em:
<http://www.ibna.ro/arhiva/AZ%2010/AZ%2010_17%20Gudev.pdf>. Acesso em: 24 abr. 2015. HELLICKSON, M.A.; WALKER, J.N. Ventilation of agricultural structures. St. Joseph, ASAE, 1983. 372 p. (MI 49085).
KHONGDEE, T.; SRIPOON, S.; VAJRABUKKA, C. The effects of high temperature and roof modification on physiological responses of swamp buffalo (Bubalus bubalis) in the tropics. Inte rnational Journal of Biometeorology, Heidelberg, v.57, n.3, p.349-354, 2013. Disponível em: <http://link.springer.com/article/10.1007/s00484-012-0557-3>. doi: 10.1007/s00484-012-0557-3
em:<http://journals.cambridge.org/action/displayAbstract?fromPage=online&aid=265999&fileId=S 0021859604004216>. doi: 10.1017/S0021859604004216
MARAI, I.F.M.; HABEEB, A.A.M. Buffaloes’ reproductive and productive traits as affected by
heat stress. Tropical and Subtropical Agroecosystems, Yucatán, v.12, n.2, p.193-217, 2010. Disponível em: <http://www.ccba.uady.mx/ojs/index.php/TSA/article/view/290/363>. Acesso em: 16 de abr. 2015.
MARAI, I.F.M.; DAADER, A.H.; SOLIMAN¸ A.M.; EL-MENSHAWY, S.M.S. Non-genetic factors affecting growth and reproduction traits of buffaloes under dry management housing (in sub-tropical environment) in Egypt. Livestock Research for Rural Development, Cali, v.21, n.3, 2009. Disponível em: <http://www.lrrd.cipav.org.co/lrrd21/3/mara21030.htm>. Acesso em: 20 abr 2015.
OLIVEIRA, J. P. F.; ARAÚJO, V. M.; RANGEL, A. H. N.; BARRETO, M. L. J.; NOVAES, L. P.; AURELIANO, I. P. L. Temperamento de búfalas em sala de ordenha sobre índices produtivos e adaptabilidade ao ambiente: uma revisão. Journal of Animal Behaviour and Biometeorology,
Mossoró, v.1, n.1, p.21-30, 2013. Disponível em:
<http://periodicos.ufersa.edu.br/revistas/index.php/jabb/article/view/3496/5212> doi:10.14269/2318-1265.v01n01a05
RODRIGUES, V.C.; SILVA, I.J.O.; VIEIRA, F.M.C.; NASCIMENTO, S.T.A correct enthalpy relationship as thermal comfort index for livestock. International Journal of Biometeorology,
Heidelberg, v.55, n.3, p.455-459, 2011. Disponível em:
<http://link.springer.com/article/10.1007/s00484-010-0344-y>.doi: 10.1007/s00484-010-0344-y SEVEGNANI, K.B.; FERNANDES, D.P.B.; DA SILVA, S.H.M.G.; DE CARVALHO, N.A.T. Efeito da aspersão de água, do sombreamento e do banho de imersão na capacidade termorregulatória e no ganho de peso de bubalinos. Energia na Agricultura, Botucatu, v.28, n.1, p.25-32, 2013. Disponível em: <http://200.145.140.50/index.php/energia/article/view/919>. doi: 10.17224/EnergAgric.2013v28n1p25-32


