ISSN 1678-992X
ABSTRACT: Awareness of evapotranspiration (ET) and crop coefficient (Kc) is necessary for irrigation management in coffee crops. ET and Kc spatial variabilities are disregarded in tradi-tional methods. Methods based on radiometric measurements have potential to obtain these spatialized variables. The Kc curve and spatial variability of actual evapotranspiration (ETa) were determined using images from Landsat 8 satellite. We used images of young and adult coffee plantations from OLI (Operational Land Imager) and TIRS (Thermal Infrared Sensor) sensors over a two-year period. Evapotranspiration was estimated using the Surface Energy Balance Algorithm for Land (SEBAL). Moreover, the reference evapotranspiration (ETo) was estimated through the Penman-Monteith method. We obtained the values for the evapotranspiration fraction (ETf), analogous to Kc, according to ET and ETo values. The study was conducted in Buritis, Minas Gerais State, Brazil, in areas cropped with Coffea arabica irrigated by central pivots. A compara-tive analysis was made using different statistical indices. Average ETa was 2.17 mm d–1 for young coffee plantations, , and the Kc mean value was 0.6. For adult coffee plantations, average ETa was 3.95 mm d–1, , and the K
c mean value was 0.85. The ETc and Kc data obtained based on the SEBAL algorithm displayed similar values to studies that used traditional methods. This model has huge potential to estimate ET of different stages of coffee plantation for the region studied. Keywords:evapotranspiration, crop coefficient, satellite
Spatial variability of coffee plant water consumption based on the SEBAL algorithm
Jéfferson de Oliveira Costa1* , Rubens Duarte Coelho1 , Wagner Wolff1 , Jefferson Vieira José2 , Marcos Vinicius Folegatti1 , Silvio
Frosini de Barros Ferraz3
1Universidade de São Paulo/ESALQ – Depto. de Engenharia de Biossistemas, Av. Pádua Dias, 11 – 13418-900 – Piracicaba, SP – Brasil.
2Universidade Federal do Mato Grosso/ICAA, Av. Estudantes, 5055 – 78735-901 – Rondonópolis, MT – Brasil.
3Universidade de São Paulo/ESALQ – Depto. de Ciências Florestais.
*Corresponding author <[email protected]> Edited by: Lincoln Zotarelli
Received May 02, 2017 Accepted October 07, 2017
Introduction
Crop evapotranspiration (ETc) in non-deficit
cultivation areas is determined by the crop coefficient
(Kc) level, which correlates ETc and the referential
evapotranspiration (ETo). However, evapotranspiration
(ET) is a complex function of soil properties, atmospheric conditions, soil use, vegetation and topography, and is influenced by these parameters in space and time (Navarro et al., 2016).
In the field, ETc can be measured along a
homogeneous surface, using conventional techniques such as the Bowen ratio, Eddy covariance, soil water
balance and lysimetric procedure. However, in situ
measurements are limited in generating area estimates in terms of cost and accuracy, because of natural heterogeneity (Allen et al., 2011; Kiptala et al., 2013). Thus, estimating or measuring the variable on a regional scale is difficult.
With the advent of satellites for Earth observation (Navarro et al., 2016), numerous ET-based remote sensing algorithms have been developed and validated (Paul et al., 2013). One of these methods is the SEBAL (Surface Energy Balance Algorithm for Land) (Bastiaanssen et al., 1998a, b), developed in the 1990s. The main advantage of remote sensing is that ET can be calculated on a large scale, on a pixel-to-pixels basis, in a consistent set of equations (Teixeira et al., 2009).
This method has demonstrated great potential in estimating ET of several crops in large areas and in different regions worldwide, using limited meteorological data (Bala et al., 2016; Bastiaanssen et al., 2005; Kiptala
et al., 2013; Li et al., 2008; Mkhwanazi et al., 2015; Paul et al., 2013; Rawat et al., 2017; Ruhoff et al., 2012; Sari et al., 2013; Teixeira et al., 2009).
Some studies on ET were conducted in coffee growing areas (Flumignan et al., 2011; Marin et al., 2005); however, estimation of water consumption using SEBAL algorithm in coffee cultivation should be better studied, since remote sensing can improve irrigation management considering the spatial variability of cultivated areas.
This study aimed to estimate spatial distribution
of ETc and Kc curve of coffee plantation, using Landsat
8 sensor and SEBAL algorithm. It also aimed validate
spatial estimates of ETc using FAO guidelines and other
reference studies for Kc of coffee plantations in Brazil.
Materials and Methods
Location and characterization of the study site
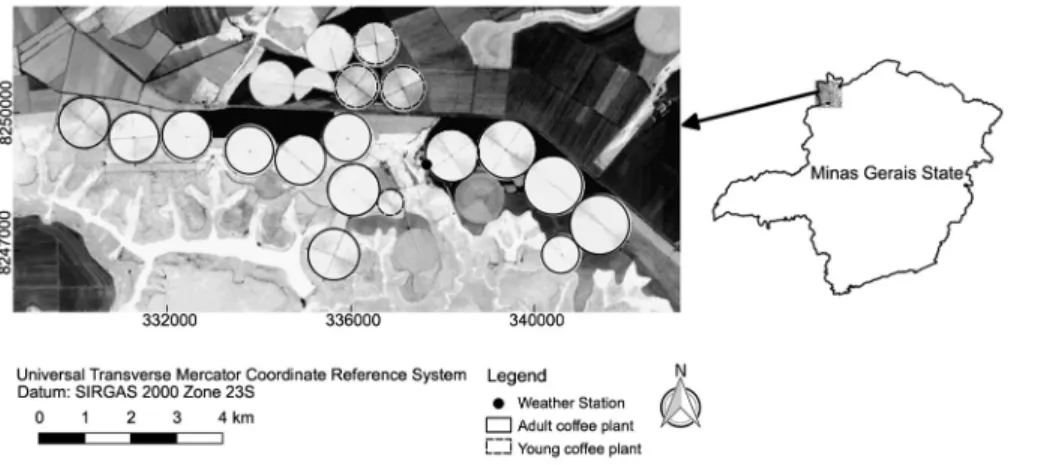
The study was carried out in coffee crops from the northwestern regions of the state of Minas Gerais (MG), Brazil (Brazilian Cerrado). The farms are located in the municipality of Buritis and neighboring municipalities (15°48’S lat., 46°30’W long. and elevation of 600 m), totaling approximately two thousand irrigated hectares of Coffea arabica (Figure 1). The irrigation systems used in the area are central pivot-type, equipped with LEPA (Low Energy Precise Application) emitters.
The local weather is type Aw (Alvares et al., 2013), tropical with dry season in the winter. The average annual temperature is 24.3 °C and the average annual rainfall is 1,815 mm. The terrain is flat and the predominant soils were classified as Oxisol (Typic Ustox).
Agr
ometeor
ology
|
Resear
ch Ar
Satellite imaging
Images of young and adult coffee crops, from OLI (Operational Land Imager) and TIRS (Thermal Infrared Sensor), from the Landsat 8 satellite, were used during a two-year period (2014-2015) (Table 1). Regarding selection, images without clouds were prioritized and regularly distributed throughout the study period for a better evaluation of the variables (evapotranspiration and crop coefficient) according to the different phenological stages of coffee plants. An image of the ASTER GEDEM V2 satellite was also applied, referring to the digital terrain model (DTM).
Landsat 8 satellite images were re-routed into the Universal Transverse Mercator (UTM) coordinate system, Zone 23 South and Datum Sirgas 2000, using the EPSG 31983 code. In addition, the images were converted from digital numbers to reflectance values at the top of the atmosphere. These data preprocessing procedures were performed in the geographic information systems (GIS) Gdal (Geospatial Data Abstraction Library, version 2.0) and QGIS (QGIS Development Team, version 2.8.3), the latter using the GRASS GIS program (GRASS Development Team, version 7.0) plugin, which enables the interaction between both GISs.
Evapotranspiration estimation (SEBAL algorithm)
Following image preprocessing, ETa was estimated
by the SEBAL algorithm (Bastiaanssen et al., 1998a). To estimate ET at different temporal and spatial scales, SEBAL algorithm uses the residual approaches of surface energy balance. The net energy from the sun and atmosphere in the form of short and long-wave radiation is transformed and used for: (i) heating the soil (soil heat flux into the ground); (ii) heating the surface environment (sensible heat flux to the atmosphere), and; (iii) transforming water into vapor (latent heat flux from the crop/soil surfaces). All the energy involved in the
soil-plant-atmosphere system can be given as the energy balance equation:
Rn = G + H + λET (1)
where: Rn is the net radiation, (W m−2); G is the soil
hear flux, (W m−2); H is the sensible hear flux, (W m−2),
and; λ ET is the latent head flux, (W m−2). Therefore,
adjusting the energy balance equation and considering
the λ ET as the “residual” energy, the ET is estimated as:
λET = Rn – G − H (2)
The latent heat is expressed as hourly ET (mm) by dividing LE by the latent heat of vaporization and water
density, multiplying by 3600 s h−1.
Net radiation (Rn) represents the balance between
input and output flux radiation, expressed as:
Rn = RS↓ − αRS↓ + RL↓ − RL↑ − (1 – ε0) RL↓ (3)
where: RS↓ is incoming shortwave radiation, (W m−2); α
is surface albedo, (decimal); RL↓ is incoming longwave
radiation, (W m−2); ε0 is broadband surface thermal
Figure 1 – Location of the study site, with image obtained by the Operational Land Imager (OLI) sensor – Landsat 8 on 28 July 2015. Note the central pivots in the young and adult coffee crops and the weather station.
Table 1 – Satellite transits date referring to Operational Land Imager (OLI)-Thermal Infrared Sensor (TIRS) imagery used in the study.
2014 2015
Jan 14th July 9th Jan17th July 28th Feb 15th Aug 10th Feb 2nd Aug 29th Mar 19th Sept 11th Mar 6th Sept 30th Apr 20th Oct 13th Apr 23th Oct 16th May 22nd Nov 30th May 25th *
The iteration of internal calibration is carried out to assign two evapotranspiration extreme conditions. One when H is equal to zero called “cold” pixel, and
another for the latent heat flux (λET) equal to zero called
“hot” pixel.
The “cold” pixel is selected on well-irrigated agricultural surfaces covered by vegetation, representing the maximum quantity of energy available that was consumed by the evapotranspiration process. The “hot” pixel is selected in fields with dry bare soil, where
evapotranspiration is assumed zero (λET = 0) or H =
Rn − G. The selection of the pixels is described in Allen et al. (2007). In this study, “hot” and “cold” pixels were selected manually.
The last stage of the SEBAL algorithm is the evapotranspiration estimate. Once calculating the energy balance fluxes, the instantaneous evapotranspiration
(ETi) at satellite overpass time is calculated as follow:
ETi=3600 ET
λ
λ (6)
where: ETi is the instantaneous evapotranspiration, (mm
h−1); 3600 is the number of seconds at one hour, and; λ
is the latent heat of vaporization, (J kg−1) stated by Allen
et al. (2007) as:
λ = [2.501 – 0.00236 (TS – 273.15)] 106 (7)
Therefore, daily (ETo) and hourly (EToi) reference evapotranspirations were calculated through the Penman-Monteith method (Allen et al.,1998). After
estimating the values of ETi, from SEBAL, and EToi, the
ratio between these variables provides a coefficient
called reference evapotranspiration fraction (ETof).
When obtained on agricultural surfaces, this
coefficient is similar to crop coefficient (Kc) (Tasumi
et al., 2005).
ETof at hour of satellite overpass is relatively
constant during the day, as highlighted by Allen et al.
(2007). The daily or actual evapotranspiration (ETa) is
calculated as:
ETa = ETof ETo (8)
where: ETa is the actual evapotranspiration, (mm d−1);
ETof reference evapotranspiration fraction, (decimal),
and; ETo is the reference of daily evapotranspiration
(mm d−1).
The calculation steps of the SEBAL algorithm were performed using a Python script SEBAL GRASS (Wolff, 2016), at GRASS GIS (GRASS Development Team, version 7.0).
Reference evapotranspiration (ETo) and crop coefficient (Kc)
The reference evapotranspiration for the satellite days of passage was estimated using the Penman-Monteith method, according to the methodology
emissivity, (decimal), and; RL↑ is outgoing longwave
radiation, (W m−2). The term αR
S↓ corresponds to
fraction of incoming longwave radiation reflected from the surface.
Net shortwave radiation available on Earth
surface depends on RS↓ and α, which was calculated
from spectral radiance for each infrared and visible band, following the mathematical expressions for spectral integration and atmospheric correction given
by Silva et al. (2016). RS↓ was estimated from the
theoretical radiation on top of atmosphere (RTOA) and
from atmosphere transmissivity (τSW), both expressions
are found in Allen et al. (1998).
RL↑ was computed according to the
Stefan-Boltzman equation (Stefan-Boltzmann, 1884), which expresses a theoretical quantity of radiation emitted by the surface with the surface temperature on the fourth power. After the atmospheric correction and using the thermal band
10, the surface temperature (Ts) was assigned by Weng
et al. (2004). In turn, ε0 was estimated through the
Soil-Adjusted Vegetation Index (SAVI) and Leaf Area Index (LAI) according to Allen et al. (2007).
As noted for RL↑, RL↓ is estimated by the
Stefan-Boltzman equation Stefan-Boltzmann (1884), which is related
to the empirical emissivity of the atmosphere (εA) and
the fourth power of air temperature, as demonstrated by boundary conditions given by Allen et al. (2007).
Rn was obtained after the incoming and outgoing
radiation fluxes of soil-plant-atmosphere system were calculated. Soil heat flux (G) was calculated through the
ratio G/Rn adopted by Bastiaanssen (2000) and Allen et
al. (2007), expressed as:
G R
T
n s
=( −273 15. )
α
0.0038 α + 0.0074 α2) (1 – 0.98 NDVI4)
(4)
where: TS is surface temperature, (K); NDVI is Normalized
Difference Vegetation Index, (dimensionless). For water surfaces, where the NDVI value is negative, the ratio G/
Rn is defined as 0.5.
Sensible heat flux (H) is estimated from the near surface temperature gradient given by the aerodynamic equation:
H c bT
r p s ah = +
ρ α (5)
where: ρ is the air density, (kg m−3); c
p is the specific heat
of air at constant pressure, (≈ 1004 J kg−1 K−1); r
ah is the
aerodynamic resistance to head transfer, (s m−1), and; a
and b are empirical coefficients determined through an internal calibration for each satellite image.
The term (a + bTS) is an equation represented
described by Allen et al. (1998), using the REF-ET software (Reference Evapotranspiration Calculation, version 2.01.14). Solar radiation, relative humidity, wind speed and precipitation are required to estimate
ETo in REF-ET and a dataset of maximum and minimum
temperatures.
The meteorological data used in ETo estimates
were obtained from the automatic meteorological station in the study site. This station was installed at 2 m above ground and recorded the time data, storing them
in a data acquisition system. After obtaining ETo, the Kc
value was obtained from the ratio between actual and reference evapotranspiration.
The term crop coefficient (Kc) was applied
throughout the study representing Kc multiplied by the
soil water stress coefficient (Ks) (Allen et al., 1998). If Kc
includes Ks and Kc, it influences the comparison with
theoretical Kc values of FAO 56. In other words, the soil
was considered to be at field capacity on the assessed days.
The Kc values obtained from the images were only
considered for the following study stages in adult and
young coffee crops. The mean Kc for young coffee plants
was calculated using values from areas of four central
pivots that cover an area of 2,250,000 m2, corresponding
to 2,491 pixels (30 m × 30 m). The mean Kc for adult
coffee plants, on the other hand, was calculated using values from the areas of 13 central pivots, which cover
an area of 12,840,000 m2, corresponding to 14,267 pixels
(30 m × 30 m).
Coffee crops were considered young with less than three years and adult with three years or more. The polygon delimitation of young and adult coffee crops considered edge pixels that entered neighboring
fields. However, the ETc values of these edge pixels
were only considered to calculate the averages when more than 50 % of their coverage area was within a certain pivot.
Data analyses
The monthly mean and standard deviation calculations were performed for each situation
considering ETa and Kc values obtained through the
SEBAL method. ET monthly average was calculated based on data from 2014 and 2015. For young coffee crops, we used mean values of four pivots and for adult coffee plantations, 13 pivots were used to calculate mean values.
ETa values of young and adult coffee crops based
on the SEBAL algorithm were compared to ETc (mm d–1)
calculated from observed data. The measured ETc was
obtained by multiplying the estimated ETo in the
Penman-Monteith (PM) method by the Kc of recommendations
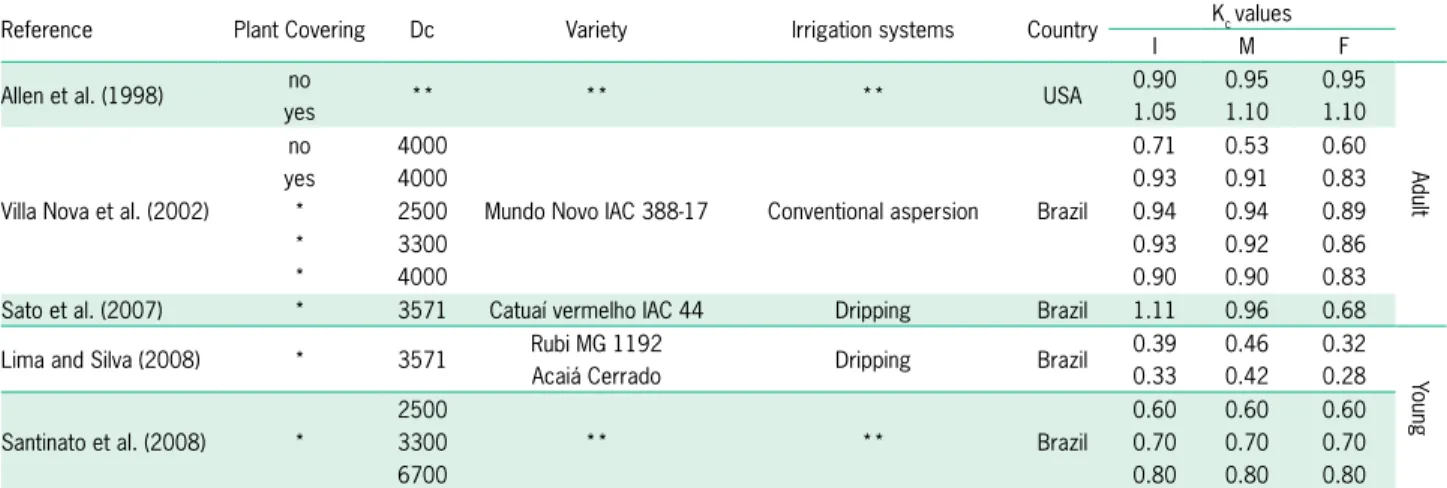
from the FAO-56 bulletin and reference studies in Brazil (Table 2).
Statistical analyses were performed to determine
differences between ETc measured and estimated: Root
Mean Square Error (RMSE), Mean Bias Error (MBE), Normalized Root Mean Square Error (NRMSE) and Index of Agreement (d) to know the significance between measured and estimated values.
Results and Discussion
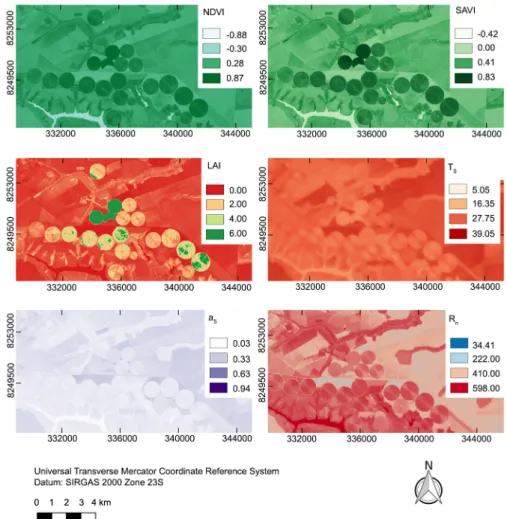
Figure 2 shows some steps applied in the SEBAL algorithm to estimate actual evapotranspiration and coffee crop coefficient. For this satellite date of passage (28 July 2015), the NDVI (index of vegetation that varies in a scale from –1 to 1) negative values correspond to water surfaces and positive values represent surfaces, low values for less vegetated and high values for more vegetated) displayed a maximum value of 0.87 and a minimum value of –0.88.
The SAVI varied between -0.42 and 0.83, and the LAI was between 0 and 6. Surface temperature exhibited a maximum value of 39.05 °C and a minimum value of 5.5 °C (average maximum surface temperature in July
Table 2 – Conditions for the development of coffee crop coefficient (Kc) studies and values used in comparison of the coffee Kc estimated by the
SEBAL model with the Kc recommended by the reference studies.
Reference Plant Covering Dc Variety Irrigation systems Country Kc values
I M F
Allen et al. (1998) no ** ** ** USA 0.90 0.95 0.95
Adult
yes 1.05 1.10 1.10
Villa Nova et al. (2002)
no 4000
Mundo Novo IAC 388-17 Conventional aspersion Brazil
0.71 0.53 0.60
yes 4000 0.93 0.91 0.83
* 2500 0.94 0.94 0.89
* 3300 0.93 0.92 0.86
* 4000 0.90 0.90 0.83
Sato et al. (2007) * 3571 Catuaí vermelho IAC 44 Dripping Brazil 1.11 0.96 0.68 Lima and Silva (2008) * 3571 Rubi MG 1192 Dripping Brazil 0.39 0.46 0.32
Young
Acaiá Cerrado 0.33 0.42 0.28
Santinato et al. (2008)
2500
** Brazil
0.60 0.60 0.60
* 3300 ** 0.70 0.70 0.70
6700 0.80 0.80 0.80
in the study site is 29.1 °C). The surface albedo was between 0.03 and 0.94 and the radiation balance varied
from 34.41 W m–2 to 598 W m–2.
Figure 3 shows examples of the spatial distribution
ET annual and the Kc, estimated using the SEBAL
algorithm. The annual evapotranspiration ranged from 0.0 to 960.30 mm, and vegetation areas displayed the highest values of ET annual. Areas with bare soil were showed the lowest values of ET annual and areas with rivers and lakes showed average values of the variable.
Figure 2 – Spatial distribution of the variables used in the Surface Energy Balance Algorithm for Land (SEBAL). Normalized Difference Vegetation Index (NDVI), Soil Adjusted Vegetation Index (SAVI), Leaf Area Index(LAI), Surface temperature (Ts), Surface albedo (aS) and Radiation balance
(Rn). Variables were calculated based on images obtained on 28 July 2015.
Figure 3 – Spatial distribution of annual evapotranspiration (ETannual) and crop coefficient (Kc) in the studied areas. Kc was calculated based on
Regarding the crop coefficient, a variation between 0.0 and 1.20 was observed and, as expected,
the vegetation areas had the highest values, while
areas with bare soil, had the lowest. The central pivot areas with adult coffee plants can be easily identified
since they retain high Kc values. The areas with adult
coffee crops present a higher percentage of vegetated surface when compared to the areas with young coffee plantations planted with 3.5 m spacing between rows in the study site. Furthermore, the SEBAL method is calibrated based on the “hot” and “cold” pixels that are selected according to the vegetal cover percentage.
Thus, ETc estimated by SEBAL is higher in areas with
higher vegetated surface, if the pixel is chosen properly,
resulting in higher Kc values.
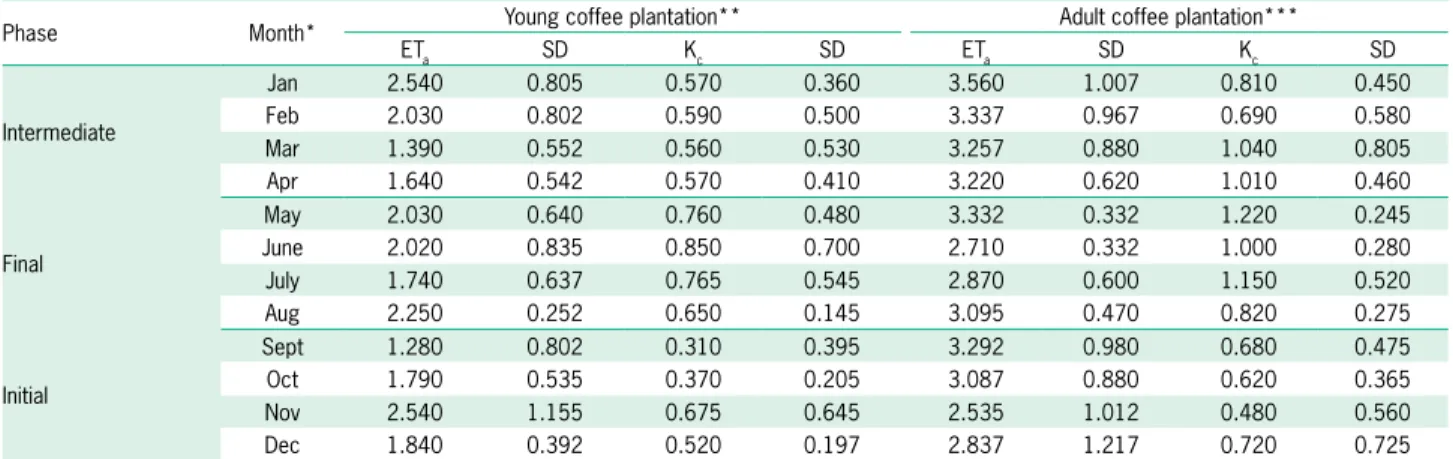
Table 3 shows the monthly average values of ETa
and Kc of young and adult coffee plantations based on
the SEBAL algorithm. For young coffee crops, the ETa
was 2.17 mm d–1, on average, with a standard deviation
0.7 mm d–1, on average. The mean value K
c was 0.6
for coffee plants in the same phase, with a standard deviation 0.43, on average.
Regarding the adult coffee plantation, the ETa was
3.95 mm d–1, on average, with a standard deviation 0.78
mm d–1, on average. The low standard deviation values
observed among the pixels are indicative of a uniform water supply by the central pivots, which enables homogeneous growth of coffee plants, resulting in a
smaller difference between the Kc values at different
points of the plantation. The mean Kc value was 0.85 for
coffee plants in the same phase, with a mean standard
deviation 0.48. On average, the Kc for adult coffee plants
was higher in the final phase and lower in the initial phase, with median value during the intermediate phase.
Figure 4 (A, B, C, D and E) show values of ETc of
young coffee plantations based on the SEBAL algorithm
and ETc calculated with observed data. Comparing ETc
obtained by the SEBAL algorithm with ETc calculated
and recommended by Lima and Silva (2008) using the variety Rubi MG 1192 (Figure 4A) and Acaiá Cerrado (Figure 4B), the Index of Agreement (d) described exhibited values below 0.44, regardless of the variety, indicating low accuracy of the model in these situations. The Root Mean Square Error (RMSE) was below 0.94, the Mean Bias Error (MBE) was below 0.82 and the Normalized Root Mean Square Error (NRMSE) was below 0.75, indicating a rather unacceptable precision
of the ETc estimate, based on the SEBAL method.
This may have occurred because crop coefficients
show little or no variation throughout the year,
recommended by the reference studies. This issue differs from the other estimation studies, carried out using the SEBAL model, which obtained a different crop coefficient value for each month. Furthermore, sites of young coffee plantations present a higher rate of soil without vegetation cover, reducing accuracy of the estimation model. For future studies in these conditions, changes are suggested in the algorithm including correction factors for estimates in young coffee plantations.
In the validation of the ETc obtained by the
SEBAL algorithm with the values of the ETc calculated
by observed data and recommended by Santinato et al. (2008) using the crop density of 2500 (Figure 4C), 3300
(Figure 4D) and 6700 plants ha−1 (Figure 4E), the index
d described exhibited values lower than 0.50, regardless of the crop density, indicating low accuracy of the model in these situations. The RMSE was below 0.79, the MBE was below 0.67 and the NRMSE was below 0.63, also
indicating unacceptable precision of the ETc estimate,
based on the SEBAL method.
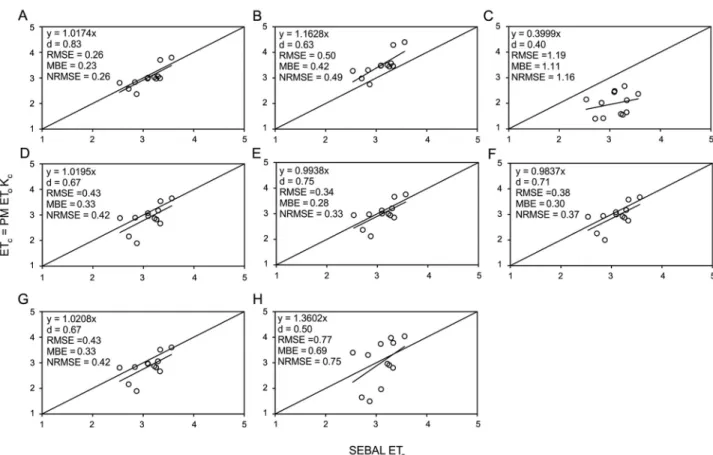
The comparison of ETc values of the adult coffee
plantations based on the SEBAL method with values
of ETc calculated is shown in Figures 5A, B, C, D, E,
F, G, and H. In the validation of the ETc obtained by
the SEBAL algorithm with the ETc calculated through
Table 3 – Monthly average values of actual evapotranspiration (ETa) and crop coefficient (Kc) of young and adult coffee plantations based on the
SEBAL algorithm and the respective standard deviation (SD).
Phase Month* Young coffee plantation** Adult coffee plantation***
ETa SD Kc SD ETa SD Kc SD
Intermediate
Jan 2.540 0.805 0.570 0.360 3.560 1.007 0.810 0.450
Feb 2.030 0.802 0.590 0.500 3.337 0.967 0.690 0.580
Mar 1.390 0.552 0.560 0.530 3.257 0.880 1.040 0.805
Apr 1.640 0.542 0.570 0.410 3.220 0.620 1.010 0.460
Final
May 2.030 0.640 0.760 0.480 3.332 0.332 1.220 0.245
June 2.020 0.835 0.850 0.700 2.710 0.332 1.000 0.280
July 1.740 0.637 0.765 0.545 2.870 0.600 1.150 0.520
Aug 2.250 0.252 0.650 0.145 3.095 0.470 0.820 0.275
Initial
Sept 1.280 0.802 0.310 0.395 3.292 0.980 0.680 0.475
Oct 1.790 0.535 0.370 0.205 3.087 0.880 0.620 0.365
Nov 2.540 1.155 0.675 0.645 2.535 1.012 0.480 0.560
Dec 1.840 0.392 0.520 0.197 2.837 1.217 0.720 0.725
observed data and recommended by Allen et al. (1998) with (Figure 5A) and without (Figure 5B) plant covering, index d presents values higher than 0.62, regardless of plant cover, indicating relatively high accuracy of the model in these situations. The RMSE was below 0.51, the MBE was below 0.43 and the NRMSE was below
0.50, also indicating reasonable precision of the ETc
estimate, based on the SEBAL method.
Rawat et al. (2017) estimated the ETc of wheat
crop by the SEBAL and standardized FAO-PM methods in Bhiwani District of Haryana, India, and the results obtained were evaluated through statistical performance measure tests. The statistical parameters found (RMSE = 0.56, NRMSE = 0.20 and d = 0.87) showed a good
agreement between SEBAL ETc and PM ETc. The
find-ings of this work suggested that the SEBAL model shows
a good potential to estimate spatial ETc for the region
studied.
In the validation of the ETc obtained by the SEBAL
algorithm with the values of the ETc calculated with
observed data and recommended by Villa Nova et al. (2002) with (Figure 5C) and without (Figure 5D) plant covering and with crop density of 2500 (Figure 5E), 3300
(Figure 5F) and 4000 plants ha−1 (Figure 5G), the index d
described exhibited values higher than 0.40, regardless of the plant covering and the crop density, indicating relatively high accuracy of the model in these situations. The RMSE was below 1.20, the MBE was below 1.12 and the NRMSE was below 1.17, also indicating
reasonable precision of the ETc estimate, based on the
SEBAL method.
In the comparison of the ETc obtained by the SEBAL
algorithm with the values of the ETc calculated with
observed data and recommended by Sato et al. (2007) (Figure 5H), the index d presents exhibited value 0.50, indicating low accuracy of the model in this situation. The RMSE was 0.77, the MBE was 0.69 and the NRMSE
was 0.75, also indicating reasonable accuracy of the ETc
estimate, based on the SEBAL method.
Bala et al. (2016) also estimated the ETc of wheat
crop by SEBAL and compared it to ET from lysimetric technique by using statistical parameters. The authors found RMSE values equal to 0.19 and NRMSE 0.21 mm
d−1. The errors or deviations found in the comparisons
between estimated and measured values may come
from the estimation model itself or from the way these data are compared. The comparison methodology using
fixed Kc values for long periods of the year can also result
in unexpected values of certain statistical parameters.
Conclusion
The ETc and Kc data obtained based on the SEBAL
algorithm displayed similar values to studies that used traditional methods. The SEBAL algorithm is a more
parsimonious alternative in Kc estimation; therefore,
the Kc obtained by this method can be used directly in
coffee crops.
Figure 4 – Crop evapotranspiration (ETc) of young coffee plantations
based on the SEBAL algorithm compared to ETc (mm d
–1) calculated
with observed data. ETc observed was obtained by multiplying
the reference evapotranspiration (ETo) calculated by the
Penman-Monteith (PM) method by the crop coefficient (Kc) of reference
The method of ETa and spatialized Kc estimation allowed understanding the variability of the study site, supporting the use of precision irrigation. Therefore, this model has high potential to estimate ET of different stages of coffee plantations for the region studied. This may also help understand crop water requirement and irrigation scheduling in the region.
Acknowledgements
LANDSAT data from USGS used in this study are acknowledged. This study was financed in part by the Coordenação de Aperfeiçoamento de Pessoal de Nível Superior - Brazil (CAPES) - Finance Code 001. We are thank also to the Conselho Nacional de Desenvolvi-mento Científico e Tecnológico (CNPq), the Fundação de Amparo à Pesquisa do Estado de São Paulo (FAPESP) and the Fundação de Estudos Agrários Luiz de Queiroz (FEALQ) for financial support.
Authors’ Contributions
Conceptualization: Costa , J.O. , Coelho, R.D., Folegatti , M.V. Data acquisition: Costa , J.O. , José ,
J.V. Data analysis: Costa , J.O. , Wolff , W., José , J.V.,
Ferraz, S.F.B. Design of Methodology: Costa , J.O.
, Coelho, R.D., Wolff , W. Software development:
Costa , J.O. , Wolff, W. Writing and editing: Costa , J.O. , Coelho, R.D., José , J.V., Folegatti, M.V., Fer-raz, S.F.B.
References
Allen, R.G.; Pereira, L.S.; Raes, D.; Smith, M. 1998. Crop Evapotranspiration: Guidelines for Computing Crop Water Requirements. FAO, Rome, Italy. (Irrigation and Drainage Paper, 56).
Allen, R.G.; Tasumi, M.; Trezza, R. 2007. Satellite-based energy balance for mapping evapotranspiration with internalized calibration (METRIC)-model. Journal of Irrigation and Drainage Engineering 133: 380-394.
Allen, R.G.; Pereira, L.S.; Howell, T.A.; Jensen, M. E. 2011. Evapotranspiration information reporting. I. Factors governing measurement accuracy. Agricultural Water Management 98: 899-920.
Alvares, C.A.; Stape, J.L.; Sentelhas, P.C.; Gonçalves, J.L.M.; Sparovek, G. 2013. Köppen’s climate classification map for Brazil. Meteorologische Zeitschrift 22: 711-728.
Figure 5 – Crop evapotranspiration (ETc) of adult coffee plantations based on the SEBAL algorithm compared to ETc (mm d
–1) calculated with
observed data. ETc observed was obtained by multiplying the reference evapotranspiration (ETo) calculated by the Penman-Monteith (PM) method
by the crop coefficient (Kc) of recommendations from the FAO-56 bulletin and reference studies in Brazil. Allen et al. (1998) with (A) and without
Bala, A.; Rawat, K.S.; Misra, A.K.; Srivastava, A. 2016. Assessment and validation of evapotranspiration using SEBAL algorithm and Lysimeter data of IARI agricultural farm, India. Geocarto International 31: 739-764.
Bastiaanssen, W.G.; Menenti, M.; Feddes, R.A.; Holtslag, A.A.M. 1998a. A remote sensing surface energy balance algorithm for land (SEBAL). 1. Formulation. Journal of Hydrology 212: 198-212. Bastiaanssen, W.G.; Pelgrum, H.; Wang, J.; Ma, Y.; Moreno, J. F.;
Roerink, G. J.; Van der Wal, T. 1998b. A remote sensing surface energy balance algorithm for land (SEBAL). Part 2. Validation. Journal of Hydrology 212: 213-229.
Bastiaanssen, W. 2000. SEBAL-based sensible and latent heat fluxes in the irrigated Gediz Basin, Turkey. Journal of Hydrology 229: 87-100.
Bastiaanssen, W.G.M.; Noordman, E.J.M.; Pelgrum, H.; Davids, G.; Thoreson, B.P.; Allen, R.G. 2005. SEBAL model with remotely sensed data to improve water-resources management under actual field conditions. Journal of Irrigation and Drainage Engineering 131: 85-93.
Boltzmann, L. 1884. Derivation of Stefan’s law, concerning the dependence of thermal radiation on temperature from the electromagnetic theory of light = Ableitung des Stefan’schen Gesetzes, betreffend die Abhängigkeit der Wärmestrahlung von der Temperatur aus der electromagnetischen Lichttheorie. Annalen der Physik 258: 291-294 (in German).
Flumignan, D.L.; Faria, R.T.; Prete, C.E.C. 2011. Evapotranspiration components and dual crop coefficients of coffee trees during crop production. Agricultural Water Management 98: 791-800. Kiptala, J.K.; Mohamed, Y.; Mul, M.L.; Zaag, P. 2013. Mapping
evapotranspiration trends using MODIS and SEBAL model in a data scarce and heterogeneous landscape in Eastern Africa. Water Resources Research 49: 8495-8510.
Koloskov, G.; Mukhamejanov, K.; Tanton, T. 2007. Monin-Obukhov length as a cornerstone of the SEBAL calculations of evapotranspiration. Journal of Hydrology 335: 170-179. Li, H.; Zheng, L.; Lei, Y.; Li, C.; Liu, Z.; Zhang, S. 2008. Estimation
of water consumption and crop water productivity of winter wheat in North China Plain using remote sensing technology. Agricultural Water Management 95: 1271-1278.
Lima, E.P.; Silva, E.L. 2008. Base temperature, crop coefficients and degrees-day for arabic coffee plants in the implantation phase. Revista Brasileira de Engenharia Agrícola e Ambiental 12: 266-273 (in Portuguese, with abstract in English).
Marin, F.R.; Angelocci, L.R.; Righi, E.Z.; Sentelhas, P.C. 2005. Evapotranspiration and irrigation requirements of a coffee plantation in southern Brazil. Experimental Agriculture 41: 187-197.
Mkhwanazi, M.; Chávez, J.L.; Andales, A.A. 2015. SEBAL-A: a remote sensing ET algorithm that accounts for advection with limited data. Part I. Development and validation. Remote Sensing 7: 15046-15067.
Navarro, A.; Rolim, J.; Miguel, I.; Catalao, J.; Painho, M.; Vekerdy, Z. 2016. Crop monitoring based on SPOT-5 Take-5 and Sentinel-1A data for the estimation of crop water requirements. Remote Sensing 8: 525-544.
Paul, G.; Gowda, P.H.; Prasad, P.V.; Howell, T.A.; Staggenborg, S.A.; Neale, C.M. 2013. Lysimetric evaluation of SEBAL using high resolution airborne imagery from BEAREX 08. Advances in Water Resources 59: 157-168.
Rawat, K.S.; Bala, A.; Singh, S.K.; Pal, R.K. 2017. Quantification of wheat crop evapotranspiration and mapping: a case study from Bhiwani District of Haryana, India. Agricultural Water Management 187: 200-209.
Ruhoff, A.L.; Paz, A.R.; Collischonn, W.; Aragao, L.E.; Rocha, H.R.; Malhi, Y.S. 2012. A MODIS-based energy balance to estimate evapotranspiration for clear-sky days in Brazilian tropical savannas. Remote Sensing 4: 703-725.
Santinato, R.; Fernandes, A.L.; Fernandes, D.R. 2008. Irrigation in Coffee Culture = Irrigação na Cultura do Café. O Lutador, Uberaba, MG, Brazil (in Portuguese).
Sari, D.K.; Ismullah, I.H.; Sulasdi, W.N.; Harto, A.B. 2013. Estimation of water consumption of lowland rice in tropical area based on heterogeneous cropping calendar using remote sensing technology. Procedia Environmental Sciences 17: 298-307.
Sato, F.A.; Silva, A.M.D.; Coelho, G.U.; Silva, A.C.; Carvalho,
L.G.D. 2007. Crop coefficient (Kc) for coffee (Coffea arabica
L.) during the winter-fall seasons in Lavras region-MG, Brazil. Engenharia Agrícola 27: 383-391 (in Portuguese, with abstract in English).
Silva, B.B.; Braga, A.C.; Braga, C.C.; Oliveira, L.M.M.D.; Montenegro, S.M.G.L.; Barbosa Junior, B. 2016. Procedures for calculation of the albedo with OLI-Landsat 8 images: application to the Brazilian semi-arid. Revista Brasileira de Engenharia Agrícola e Ambiental 20: 3-8.
Tasumi, M.; Allen, R.G.; Trezza, R.; Wright, J.L. 2005. Satellite-based energy balance to assess within- population variance of crop coefficient curves. Journal of Irrigation and Drainage Engineering 131: 94-109.
Teixeira, A.D.C.; Bastiaanssen, W.G.M.; Ahmad, M.U.D.; Bos, M.G. 2009. Reviewing SEBAL input parameters for assessing evapotranspiration and water productivity for the Low-Middle Sao Francisco river basin, Brazil. Part A. Calibration and validation. Agricultural and Forest Meteorology 149: 462-476. Villa Nova, N.A.; Favarin, J.L.; Angelocci, L.R.; Dourado-Neto,
D. 2002. Estimative of the coffee crop coefficient as function of the weather and plant parameters. Bragantia 61: 81-88 (in Portuguese, with abstract in English).
Weng, Q.; Lu, D.; Schubring, J. 2004. Estimation of land surface temperature vegetation abundance relation-ship for urban heat island studies. Remote Sensing of Environment 89: 467-483. Wolff, W. 2016. Script to calculate daily evapotranspiration